

Cubs vs Red Sox Live Score (25 Sep, 2026)
Game Information
Stage
STD
Season
2026
First Pitch
Fri, Sep 25, 5:30 pm
Venue
Fenway Park
Location
Boston, Massachusetts
Venue Type
Outdoor
Broadcast
ESPN Unlmtd
Attendance
36,449
Live Situation
2Balls
1Strikes
0Outs
—Pitcher
—At Bat
Pitch Sequence
1
STRIKE LOOKING
Curve
78 MPH
2
BALL
Changeup
81 MPH
3
BALL
Changeup
81 MPH
4
BALL IN PLAY
Sinker
89 MPH
Injury Report
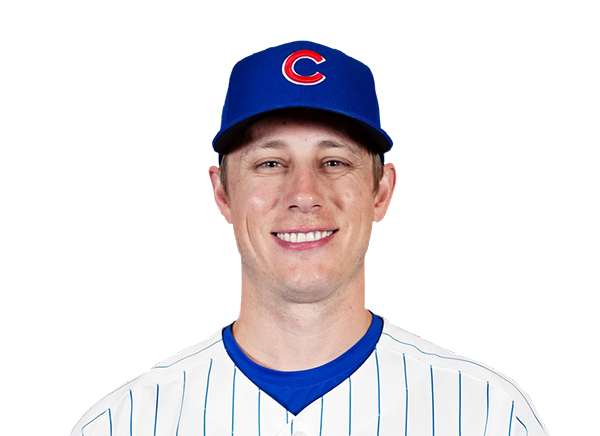
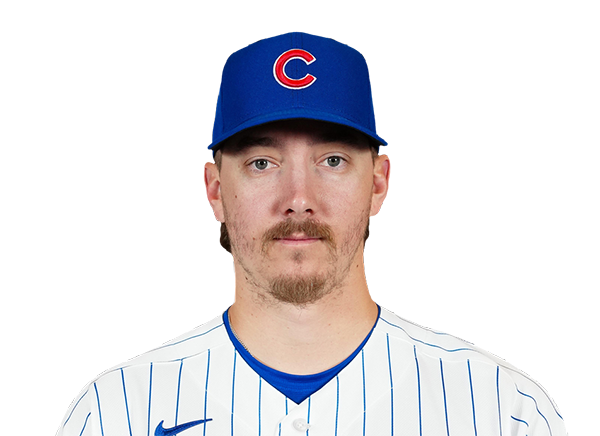
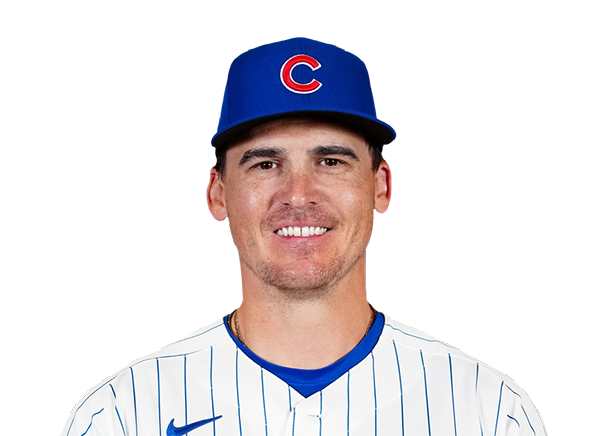
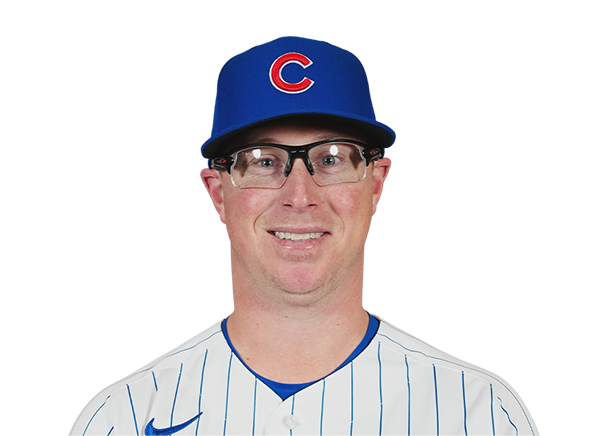
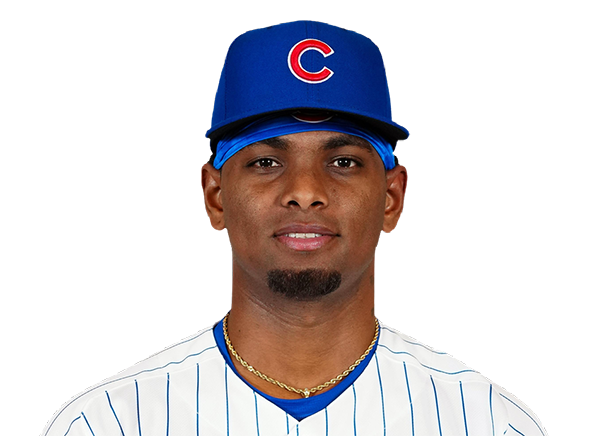

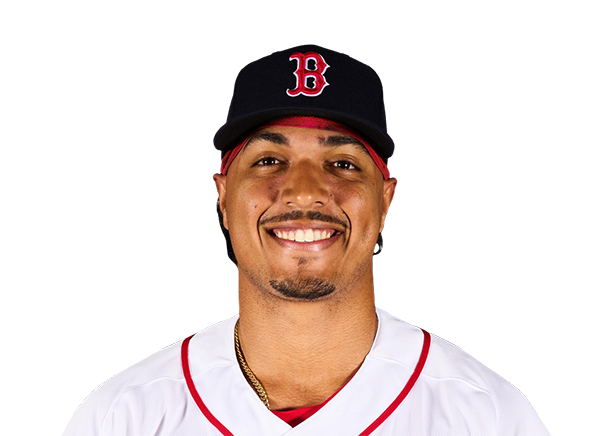

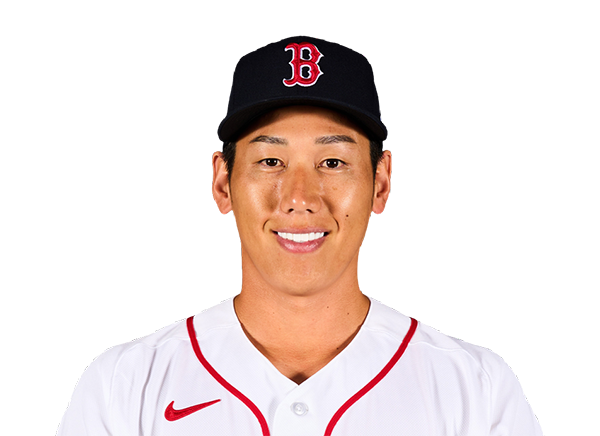
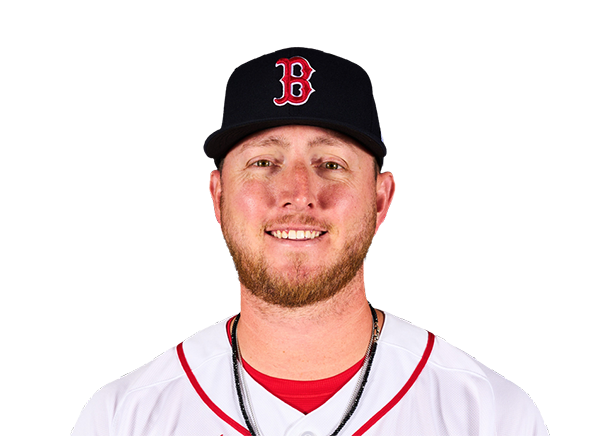
Team Stats
 CHC
BOS


0
Runs
2
7
Hits
4
0
Errors
0
0
Home Runs
0
1
Walks
5
7
Strikeouts
10
Player Box Score
Chicago Cubs
| Player | H-AB | AB | R | H | RBI | HR | BB | K | #P | AVG | OBP | SLG |
|---|---|---|---|---|---|---|---|---|---|---|---|---|
 Pete Crow-Armstrong | 0-4 | 4 | 0 | 0 | 0 | 0 | 0 | 1 | 22 | .278 | .372 | .570 |
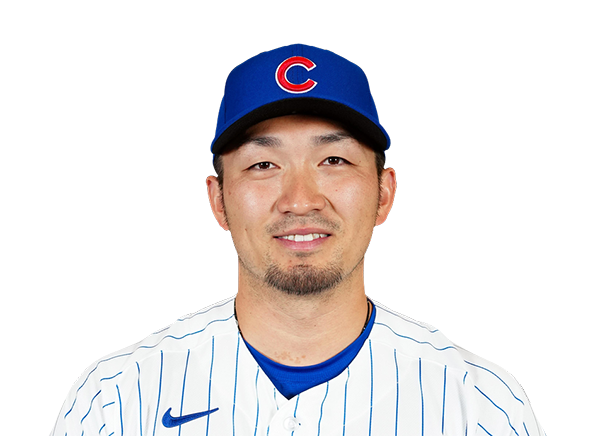 Seiya Suzuki | 2-3 | 3 | 0 | 2 | 0 | 0 | 1 | 1 | 18 | .270 | .368 | .473 |
 Michael Busch | 2-4 | 4 | 0 | 2 | 0 | 0 | 0 | 2 | 13 | .243 | .354 | .395 |
 Michael Conforto | 0-4 | 4 | 0 | 0 | 0 | 0 | 0 | 0 | 13 | .237 | .330 | .466 |
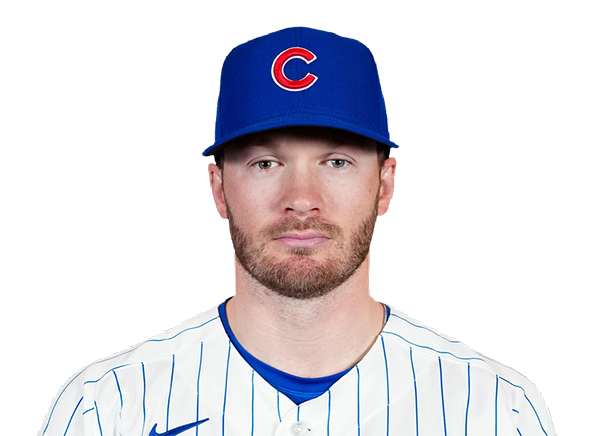 Ian Happ | 0-4 | 4 | 0 | 0 | 0 | 0 | 0 | 1 | 21 | .220 | .329 | .416 |
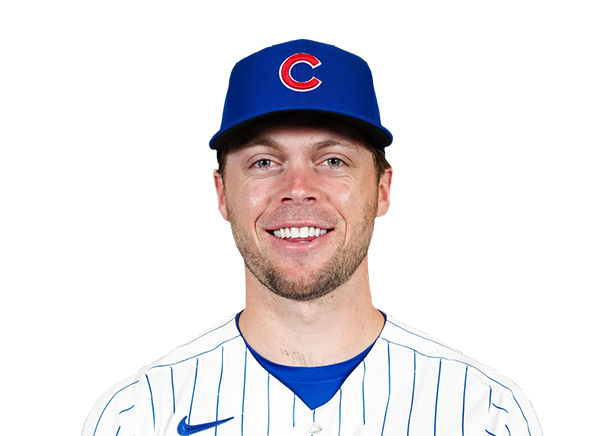 Nico Hoerner | 2-4 | 4 | 0 | 2 | 0 | 0 | 0 | 0 | 17 | .264 | .317 | .351 |
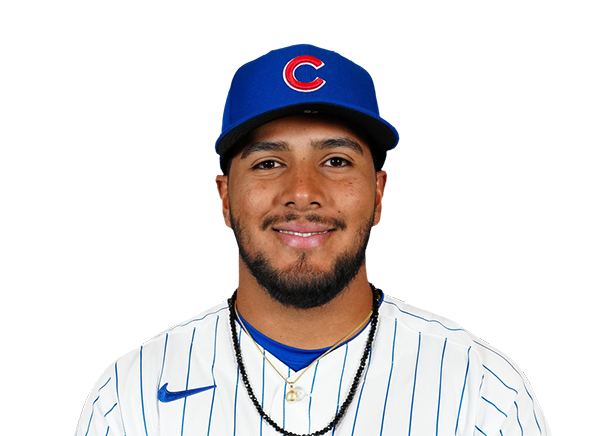 Pedro Ramirez | 0-3 | 3 | 0 | 0 | 0 | 0 | 0 | 1 | 15 | .257 | .315 | .401 |
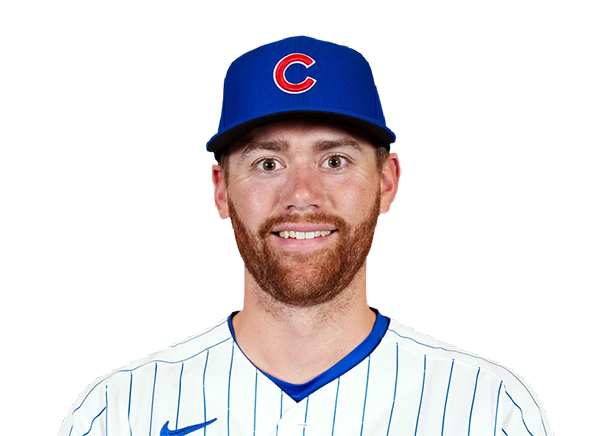 Carson Kelly | 0-3 | 3 | 0 | 0 | 0 | 0 | 0 | 1 | 11 | .258 | .336 | .376 |
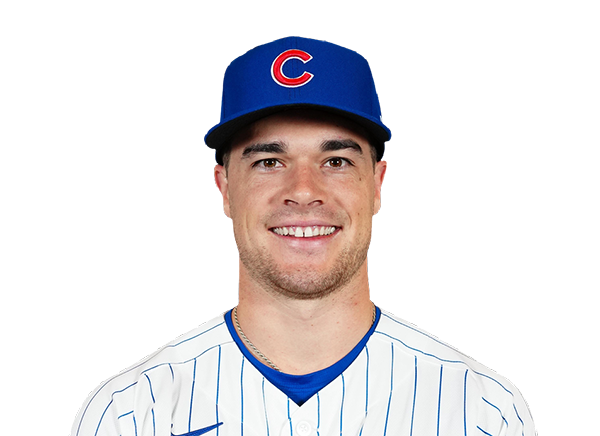 Matt Shaw | 1-3 | 3 | 0 | 1 | 0 | 0 | 0 | 0 | 5 | .240 | .327 | .415 |
Boston Red Sox
| Player | H-AB | AB | R | H | RBI | HR | BB | K | #P | AVG | OBP | SLG |
|---|---|---|---|---|---|---|---|---|---|---|---|---|
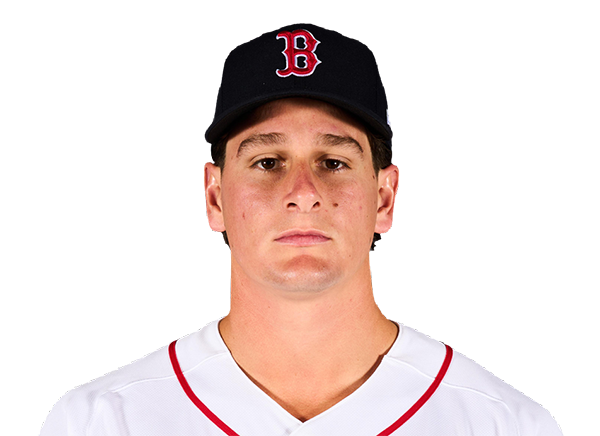 Roman Anthony | 1-3 | 3 | 0 | 1 | 0 | 0 | 1 | 2 | 23 | .248 | .342 | .400 |
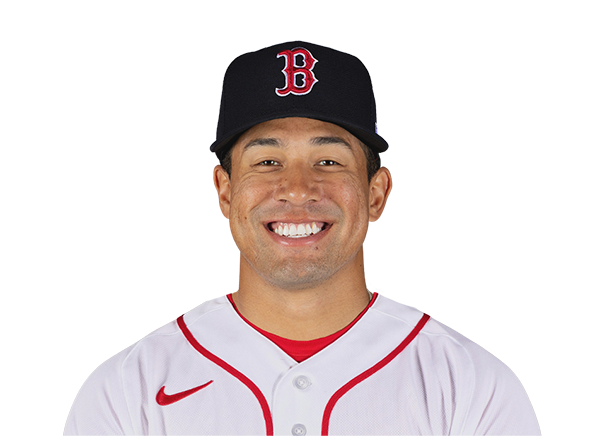 Jahmai Jones | 0-3 | 3 | 1 | 0 | 0 | 0 | 1 | 2 | 23 | .209 | .302 | .373 |
 Wilyer Abreu | 1-4 | 4 | 0 | 1 | 2 | 0 | 0 | 2 | 16 | .249 | .328 | .448 |
 Trevor Story | 0-3 | 3 | 0 | 0 | 0 | 0 | 1 | 3 | 16 | .237 | .270 | .353 |
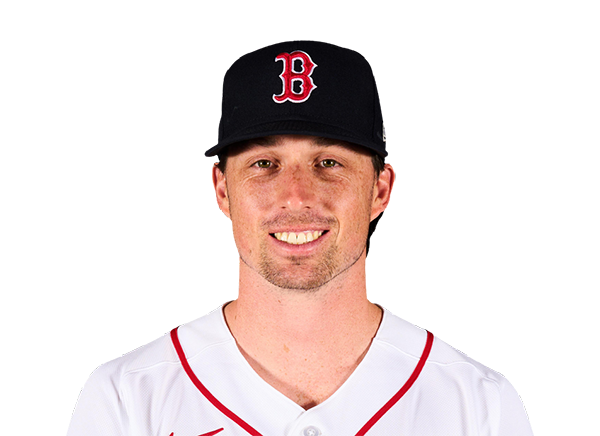 Nick Sogard | 1-4 | 4 | 0 | 1 | 0 | 0 | 0 | 0 | 12 | .254 | .340 | .386 |
 Andruw Monasterio | 0-3 | 3 | 0 | 0 | 0 | 0 | 0 | 0 | 14 | .235 | .297 | .374 |
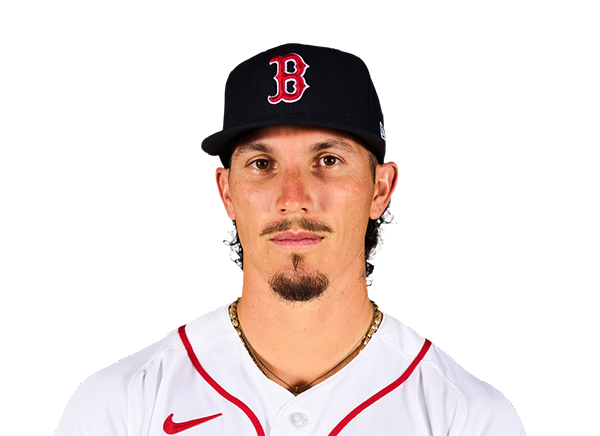 Jarren Duran | 0-3 | 3 | 0 | 0 | 0 | 0 | 0 | 1 | 15 | .208 | .267 | .362 |
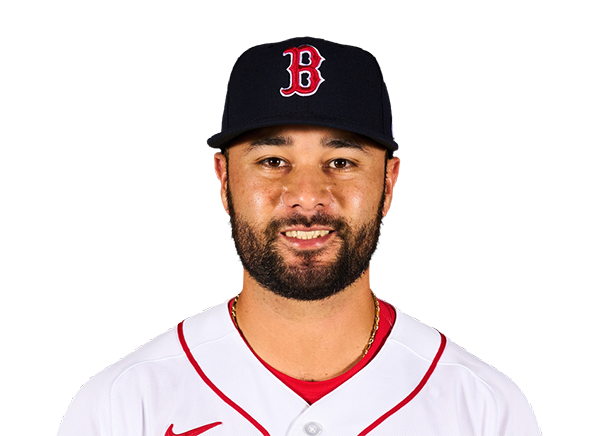 Isiah Kiner-Falefa | 1-1 | 1 | 1 | 1 | 0 | 0 | 2 | 0 | 16 | .242 | .322 | .311 |
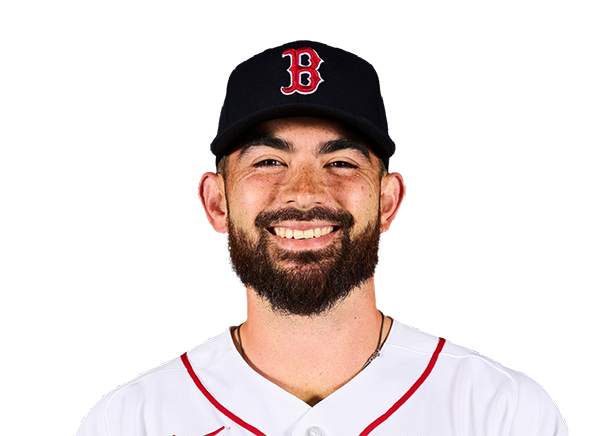 Connor Wong | 0-3 | 3 | 0 | 0 | 0 | 0 | 0 | 0 | 10 | .234 | .309 | .349 |
Chicago Cubs
| Player | IP | H | R | ER | BB | K | HR | PC-ST | ERA | PC |
|---|---|---|---|---|---|---|---|---|---|---|
 David Peterson | 5.0 | 3 | 0 | 0 | 2 | 6 | 0 | 91-57 | 4.79 | 91 |
 Javier Assad | 2.1 | 0 | 1 | 1 | 1 | 3 | 0 | 35-24 | 3.63 | 35 |
 Ryan Rolison | 0.1 | 1 | 1 | 1 | 1 | 1 | 0 | 13-6 | 3.14 | 13 |
 Gavin Hollowell | 0.1 | 0 | 0 | 0 | 1 | 0 | 0 | 6-2 | 2.45 | 6 |
Boston Red Sox
| Player | IP | H | R | ER | BB | K | HR | PC-ST | ERA | PC |
|---|---|---|---|---|---|---|---|---|---|---|
 Brayan Bello | 4.0 | 4 | 0 | 0 | 1 | 2 | 0 | 58-39 | 4.33 | 58 |
 Jedixson Paez | 5.0 | 3 | 0 | 0 | 0 | 5 | 0 | 77-54 | 10.80 | 77 |
H2H / Season Series
BOS2–0
CHC
BOS4–3
CHC
Last 5 Games
| Date | Opponent | Result |
|---|---|---|
| Sep 25 | @ BOS | L0–2 |
| Sep 25 | @ BOS | L3–4 |
| Sep 24 |  vs MIA | W2–1 |
| Sep 23 | vs MIA | L2–3 |
| Sep 22 | vs MIA | L2–8 |
| Date | Opponent | Result |
|---|---|---|
| Sep 25 | vs CHC | W2–0 |
| Sep 25 | vs CHC | W4–3 |
| Sep 24 |  vs CLE | L0–1 |
| Sep 23 | vs CLE | W1–0 |
| Sep 22 | vs CLE | L2–3 |
Standings
American League
| Team | W | L | PCT | GB | DIFF | STRK |
|---|---|---|---|---|---|---|
1 Rays | 97 | 63 | .606 | - | +79 | W1 |
| 2Guardians | 84 | 76 | .525 | 13 | +6 | W2 |
3 Astros | 79 | 81 | .494 | 18 | -52 | L1 |
4 Yankees | 93 | 68 | .578 | 4.5 | +138 | W1 |
| 5Red Sox | 87 | 74 | .540 | 10.5 | +82 | W2 |
6 White Sox | 83 | 77 | .519 | 14 | +57 | W2 |
7 Rangers | 79 | 81 | .494 | 18 | -48 | L1 |
8 Orioles | 79 | 82 | .491 | 18.5 | -21 | L1 |
9 Blue Jays | 78 | 82 | .488 | 19 | -46 | W1 |
10 Twins | 76 | 84 | .475 | 21 | -56 | W3 |
11 Tigers | 75 | 85 | .469 | 22 | +72 | W1 |
12 Mariners | 74 | 86 | .463 | 23 | -66 | L2 |
13 Royals | 68 | 92 | .425 | 29 | -115 | L2 |
14 Athletics | 64 | 96 | .400 | 33 | -218 | W1 |
15 Angels | 62 | 98 | .388 | 35 | -89 | W2 |
National League
| Team | W | L | PCT | GB | DIFF | STRK |
|---|---|---|---|---|---|---|
1 Brewers | 101 | 59 | .631 | - | +211 | W3 |
2 Dodgers | 98 | 62 | .613 | 3 | +196 | W1 |
3 Braves | 93 | 67 | .581 | 8 | +113 | L2 |
4 Padres | 89 | 71 | .556 | 12 | +33 | L1 |
| 5Cubs | 88 | 73 | .547 | 13.5 | +143 | L2 |
6 Phillies | 87 | 73 | .544 | 14 | +22 | L3 |
7 Diamondbacks | 86 | 74 | .538 | 15 | +17 | W6 |
8 Pirates | 81 | 79 | .506 | 20 | +27 | L1 |
| 9Marlins | 79 | 81 | .494 | 22 | +6 | W1 |
10 Cardinals | 77 | 83 | .481 | 24 | -26 | L2 |
11 Nationals | 76 | 84 | .475 | 25 | +10 | W3 |
12 Reds | 74 | 86 | .463 | 27 | -160 | L1 |
13 Mets | 73 | 87 | .456 | 28 | -36 | L2 |
14 Giants | 65 | 95 | .406 | 36 | -86 | L3 |
15 Rockies | 57 | 103 | .356 | 44 | -193 | L5 |
CHC
VS
BOS
Pitchers
David Peterson
Catchers
Carson Kelly
Infielders
Michael Busch
Nico Hoerner
Pedro Ramirez
Matt Shaw
Outfielders
Pete Crow-Armstrong
Seiya Suzuki
Ian Happ
Designated Hitters
Michael Conforto
Pitchers
Brayan Bello
Catchers
Connor Wong
Infielders
Trevor Story
Nick Sogard
Andruw Monasterio
Isiah Kiner-Falefa
Outfielders
Roman Anthony
Jahmai Jones
Jarren Duran
Designated Hitters
Wilyer Abreu
Cubs
VS
Red Sox
Batting
161
Team Games Played
161
5526
At Bats
5384
1385
Hits
1321
798
Runs Batted In
656
218
Home Runs
162
114
Stolen Bases
107
.251
Batting Average
.245
844
Runs
687
271
Doubles
285
26
Triples
26
2362
Total Bases
2144
671
Walks
514
1338
Strikeouts
1319
.338
On Base Percentage
.319
.427
Slugging Percentage
.398
.766
OBP Pct + SLG Pct
.718
161
Games Played
161
161
Games Started
161
86
Hit By Pitch
94
0.0
Wins Above Replacement
0.0
0.0
Offensive Wins Above Replacement
0.0
22
Caught Stealing
39
1
Is Qualified
1
827.8
Runs Created
701.7
5.2
Runs Created Per 27 Outs
4.4
.106
Walks Per Plate Appearance
.085
0.50
Walk To Strikeout Ratio
0.39
.177
Isolated Power
.153
.315
Secondary Average
.261
3.96
Pitches Per Plate Appearance
3.85
515
Extra Base Hits
473
6339
Plate Appearances
6078
25.3
At Bats Per Home Run
33.2
10
Sacrifice Hit
36
45
Sacrifice Flies
46
Pitching
161
Team Games Played
161
52
Quality Starts
64
88
Wins
87
73
Losses
74
35
Saves
46
56
Holds
94
1318
Hits
1294
660
Earned runs
560
230
Home Runs
151
497
Walks
466
1253
Strikeouts
1391
7.8
Strikeouts Per 9 Innings
8.7
145.4
Pitches Per Start
140.6
1.26
Walks Plus Hits Per Inning Pitched
1.23
4.13
Earned Run Average
3.52
73
Losses
74
1438.0
Innings pitched
1431.0
.547
Win Percentage
.540
63
Save Opportunities
60
.243
Opponent Batting Average
.240
.312
Opponent's On-base pct.
.306
.409
Opponent's Slugging pct.
.374
.722
Opponent's OPB Pct + SLG Pct
.680
5424
At Bats
5384
185
Doubles
249
14
Triples
9
61
Batters Hit
65
92
Stolen Bases
112
161
Games Played
161
0
Complete Games
0
6
Shutouts
18
35
Wild Pitches
35
677
Runs Batted In
579
3
Balks
3
1438.0
Innings pitched
1431.0
7.8
Strikeouts Per 9 Innings
8.7
32
Caught Stealing
23
161
Games Started
161
0.0
Wins Above Replacement
0.0
1
Is Qualified
1
701
Runs
605
660
Earned Runs
560
2221
Total Bases
2014
Fielding
161
Team Games Played
161
1438
Full Innings
1431
5910
Total Chances
5783
4314
Putouts
4293
1535
Assists
1409
61
Errors
81
271
Double Plays
285
0.990
Fielding Percentage
0.986
36.6
Range Factor
35.9
0.0
Zone Rating
0.0
161
Games Played
161
0
Games Started
0
0.0
Defensive Wins Above Replacement
0.0
1
Qualified
1