

Cubs vs Reds Live Score (20 Sep, 2026)
Game Information
Stage
STD
Season
2026
First Pitch
Sun, Sep 20, 1:40 pm
Venue
Great American Ball Park
Location
Cincinnati, Ohio
Venue Type
Outdoor
Broadcast
MLB.TV
Attendance
28,917
Live Situation
3Balls
2Strikes
0Outs
—Pitcher
—At Bat
Pitch Sequence
1
BALL
Four-seam FB
96 MPH
2
BALL
Curve
80 MPH
3
BALL
Cutter
87 MPH
4
STRIKE LOOKING
Four-seam FB
95 MPH
5
STRIKE FOUL
Changeup
87 MPH
6
BALL IN PLAY
Four-seam FB
95 MPH
Injury Report

Team Stats
 CHC
CIN


9
Runs
1
13
Hits
4
1
Errors
0
3
Home Runs
1
4
Walks
1
10
Strikeouts
8
Player Box Score
Chicago Cubs
| Player | H-AB | AB | R | H | RBI | HR | BB | K | #P | AVG | OBP | SLG |
|---|---|---|---|---|---|---|---|---|---|---|---|---|
 Pete Crow-Armstrong | 3-5 | 5 | 3 | 3 | 2 | 1 | 0 | 0 | 16 | .280 | .371 | .578 |
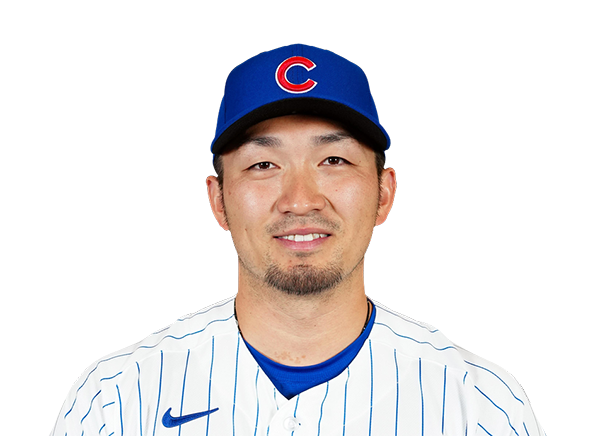 Seiya Suzuki | 1-5 | 5 | 1 | 1 | 1 | 1 | 0 | 1 | 13 | .267 | .365 | .470 |
 Michael Busch | 1-4 | 4 | 1 | 1 | 0 | 0 | 1 | 2 | 24 | .239 | .350 | .396 |
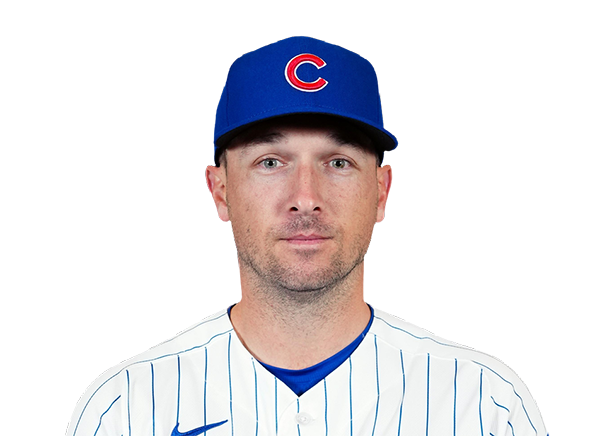 Alex Bregman | 1-1 | 1 | 1 | 1 | 1 | 0 | 1 | 0 | 7 | .262 | .352 | .452 |
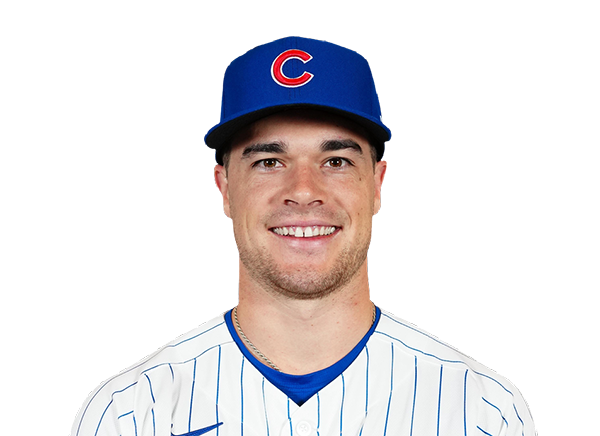 Matt Shaw | 0-2 | 2 | 0 | 0 | 0 | 0 | 1 | 1 | 11 | .238 | .330 | .419 |
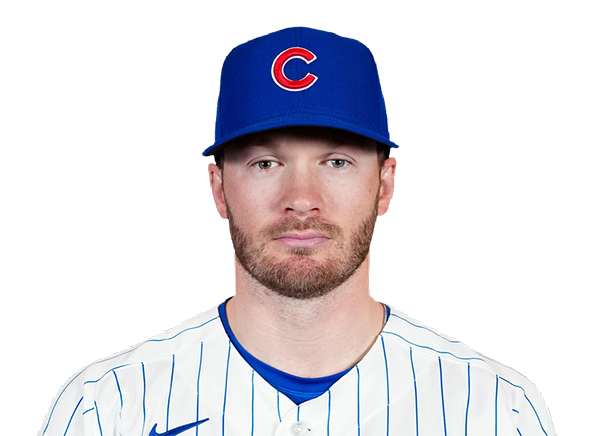 Ian Happ | 2-5 | 5 | 1 | 2 | 1 | 0 | 0 | 2 | 22 | .221 | .331 | .418 |
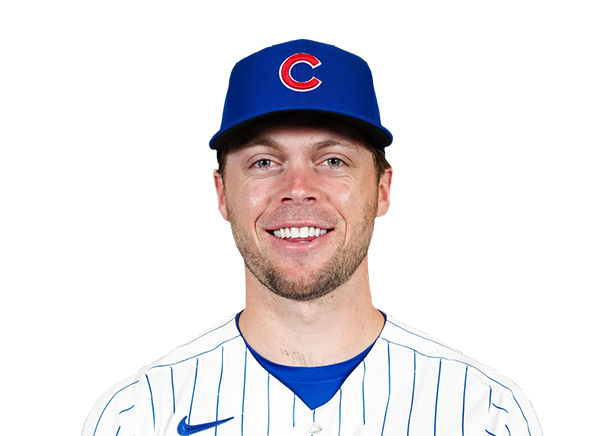 Nico Hoerner | 1-4 | 4 | 0 | 1 | 1 | 0 | 1 | 0 | 23 | .265 | .317 | .355 |
 Michael Conforto | 1-5 | 5 | 1 | 1 | 1 | 1 | 0 | 2 | 12 | .245 | .339 | .482 |
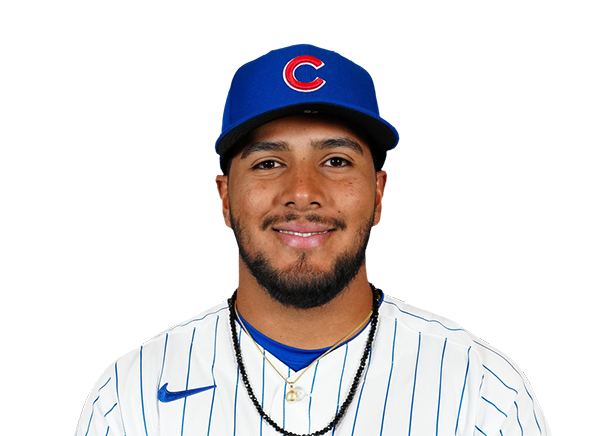 Pedro Ramirez | 3-5 | 5 | 1 | 3 | 2 | 0 | 0 | 0 | 15 | .266 | .324 | .419 |
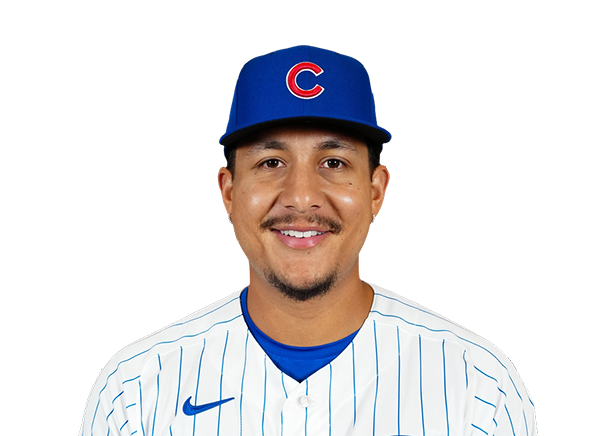 Miguel Amaya | 0-4 | 4 | 0 | 0 | 0 | 0 | 0 | 2 | 16 | .234 | .339 | .371 |
Cincinnati Reds
| Player | H-AB | AB | R | H | RBI | HR | BB | K | #P | AVG | OBP | SLG |
|---|---|---|---|---|---|---|---|---|---|---|---|---|
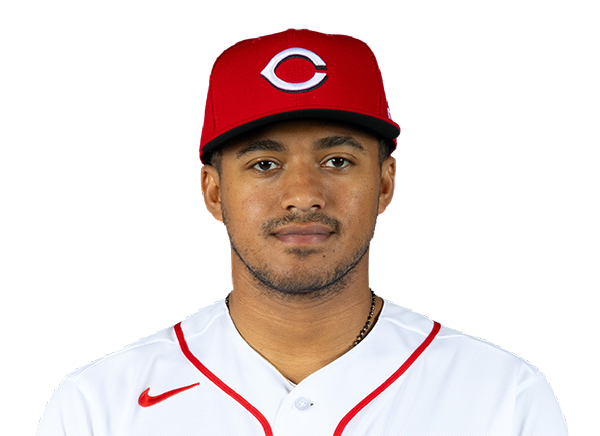 Dane Myers | 0-3 | 3 | 0 | 0 | 0 | 0 | 0 | 1 | 9 | .260 | .347 | .372 |
 Carlos Jorge | 0-1 | 1 | 0 | 0 | 0 | 0 | 0 | 0 | 2 | .120 | .185 | .200 |
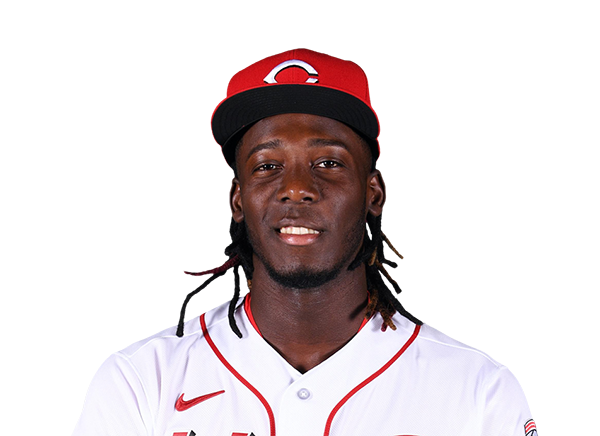 Elly De La Cruz | 1-4 | 4 | 0 | 1 | 0 | 0 | 0 | 1 | 16 | .285 | .366 | .515 |
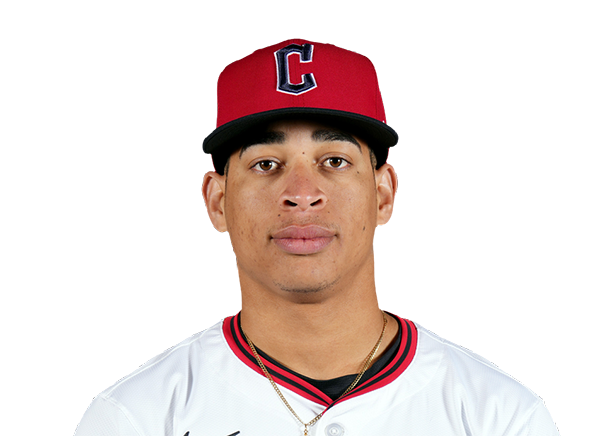 Juan Brito | 0-0 | 0 | 0 | 0 | 0 | 0 | 0 | 0 | 0 | .242 | .293 | .374 |
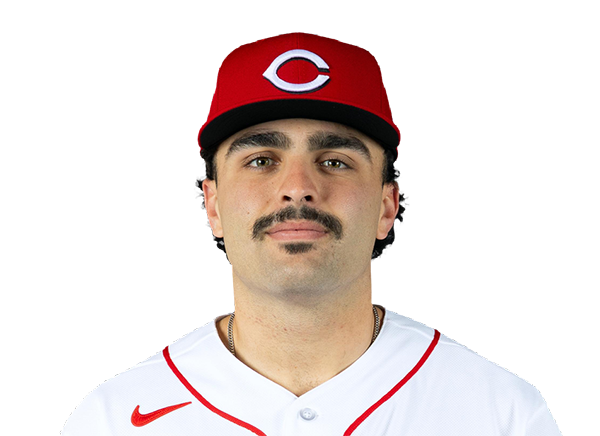 Sal Stewart | 0-4 | 4 | 0 | 0 | 0 | 0 | 0 | 1 | 9 | .268 | .334 | .470 |
 Tyler Stephenson | 0-4 | 4 | 0 | 0 | 0 | 0 | 0 | 2 | 12 | .246 | .327 | .411 |
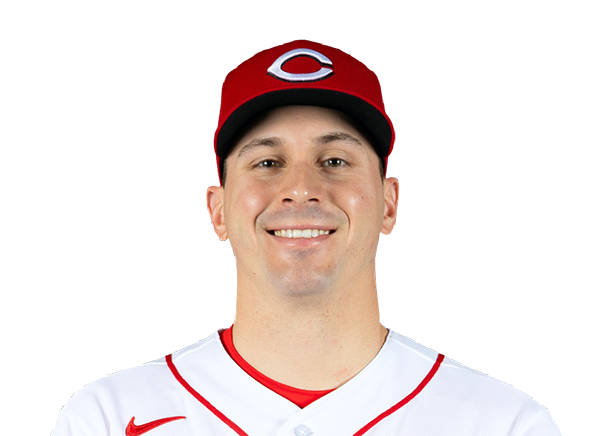 JJ Bleday | 1-3 | 3 | 1 | 1 | 1 | 1 | 1 | 0 | 14 | .215 | .325 | .415 |
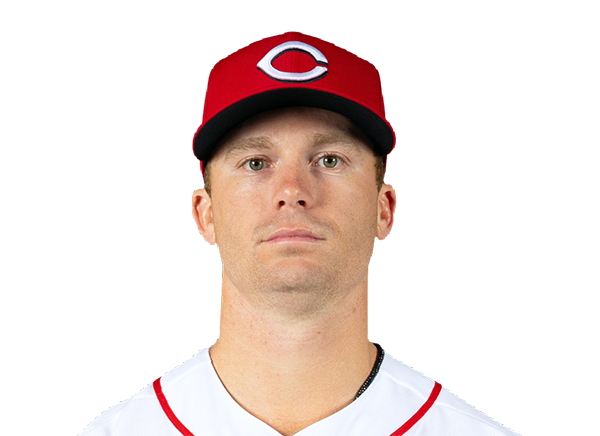 Matt McLain | 1-3 | 3 | 0 | 1 | 0 | 0 | 0 | 0 | 18 | .184 | .274 | .334 |
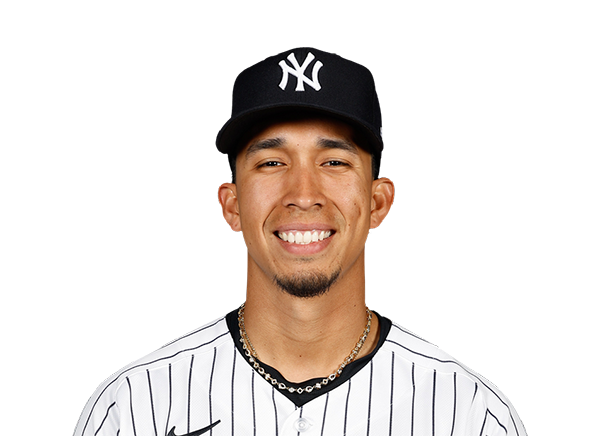 Oswaldo Cabrera | 0-3 | 3 | 0 | 0 | 0 | 0 | 0 | 2 | 19 | .000 | .000 | .000 |
 Will Banfield | 1-3 | 3 | 0 | 1 | 0 | 0 | 0 | 1 | 10 | .200 | .200 | .267 |
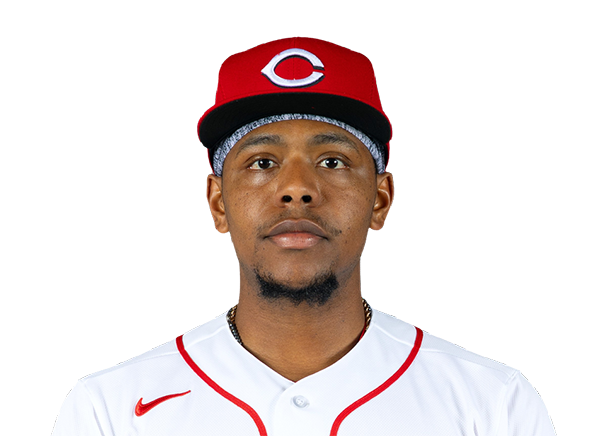 Ke'Bryan Hayes | 0-2 | 2 | 0 | 0 | 0 | 0 | 0 | 0 | 6 | .145 | .200 | .232 |
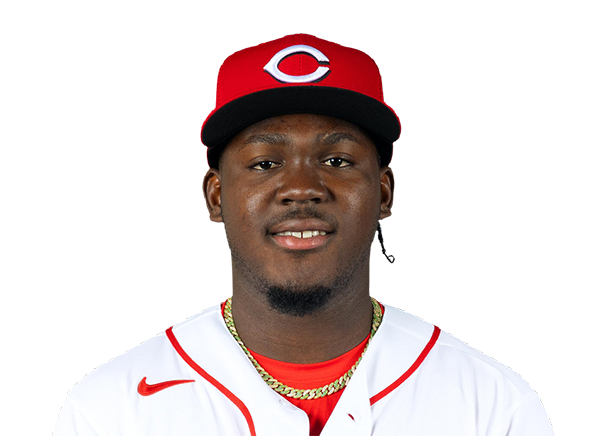 Hector Rodriguez | 0-1 | 1 | 0 | 0 | 0 | 0 | 0 | 0 | 3 | .218 | .265 | .379 |
Chicago Cubs
| Player | IP | H | R | ER | BB | K | HR | PC-ST | ERA | PC |
|---|---|---|---|---|---|---|---|---|---|---|
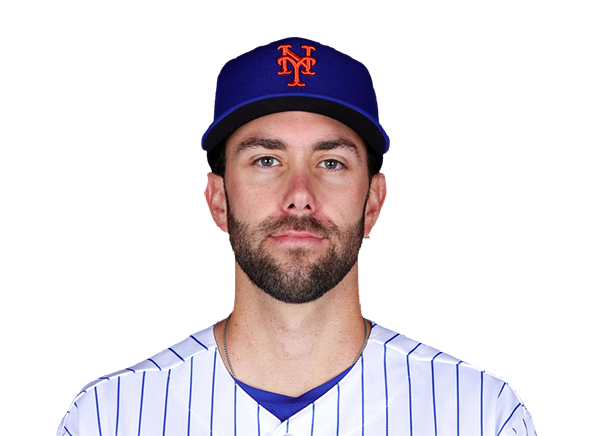 David Peterson | 6.0 | 3 | 1 | 1 | 1 | 7 | 1 | 83-54 | 4.96 | 83 |
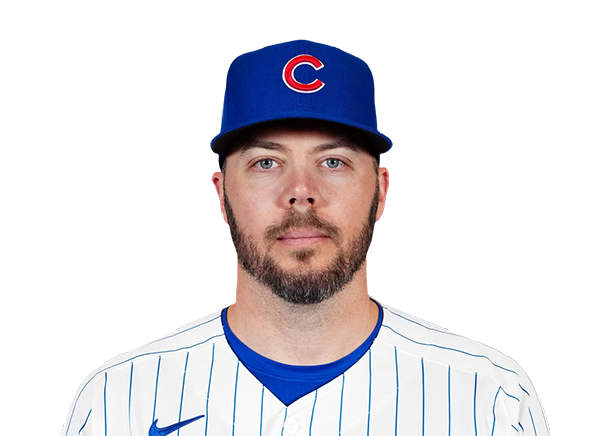 Caleb Thielbar | 1.0 | 0 | 0 | 0 | 0 | 1 | 0 | 18-12 | 4.72 | 18 |
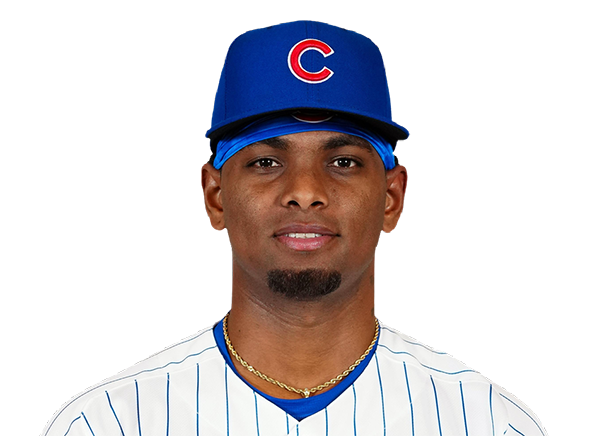 Edward Cabrera | 1.0 | 1 | 0 | 0 | 0 | 0 | 0 | 9-7 | 5.67 | 9 |
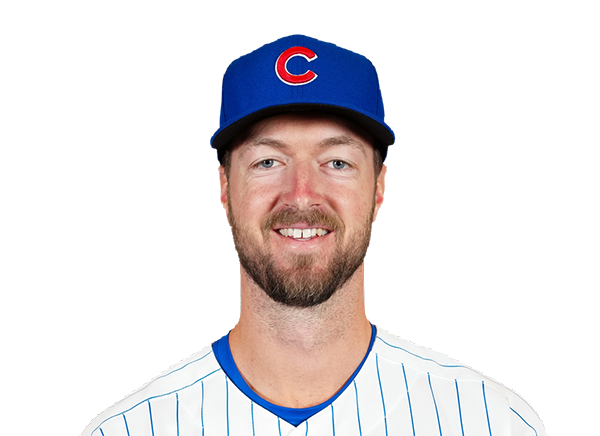 Colin Rea | 1.0 | 0 | 0 | 0 | 0 | 0 | 0 | 8-5 | 4.43 | 8 |
Cincinnati Reds
| Player | IP | H | R | ER | BB | K | HR | PC-ST | ERA | PC |
|---|---|---|---|---|---|---|---|---|---|---|
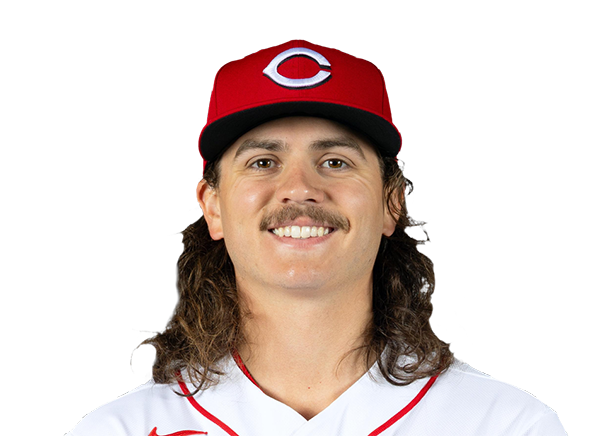 Rhett Lowder | 3.0 | 6 | 5 | 5 | 3 | 3 | 0 | 60-35 | 6.01 | 60 |
 Luis Mey | 1.0 | 1 | 0 | 0 | 1 | 1 | 0 | 20-12 | 5.85 | 20 |
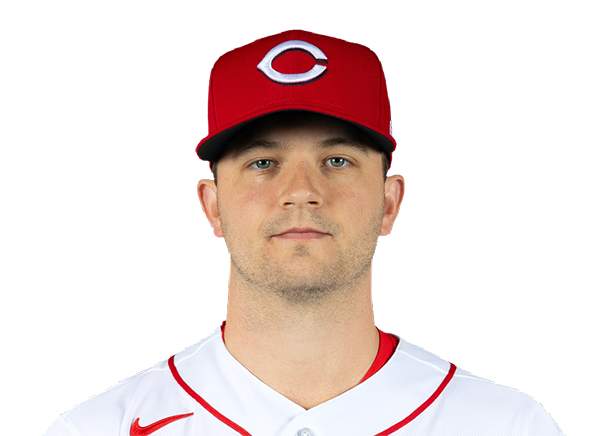 Carson Spiers | 4.0 | 5 | 4 | 4 | 0 | 5 | 3 | 62-47 | 9.00 | 62 |
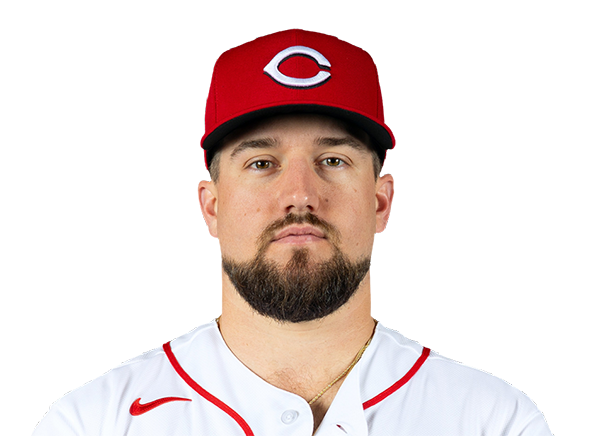 Graham Ashcraft | 1.0 | 1 | 0 | 0 | 0 | 1 | 0 | 17-12 | 4.45 | 17 |
H2H / Season Series
CIN1–9
CHC
CIN2–5
CHC
CIN6–4
CHC
CHC5–7
CIN
CHC17–5
CIN
CHC8–10
CIN
CIN4–8
CHC
CIN3–5
CHC
CIN4–0
CHC
CHC8–3
CIN
Last 5 Games
| Date | Opponent | Result |
|---|---|---|
| Sep 20 | @ CIN | W9–1 |
| Sep 19 | @ CIN | W5–2 |
| Sep 18 | @ CIN | L4–6 |
| Sep 16 |  vs ATL | W8–4 |
| Sep 15 | vs ATL | L3–6 |
| Date | Opponent | Result |
|---|---|---|
| Sep 20 | vs CHC | L1–9 |
| Sep 19 | vs CHC | L2–5 |
| Sep 18 | vs CHC | W6–4 |
| Sep 17 |  vs LAD | L2–8 |
| Sep 16 | vs LAD | W6–2 |
Standings
American League
| Team | W | L | PCT | GB | DIFF | STRK |
|---|---|---|---|---|---|---|
1 Rays | 95 | 60 | .613 | - | +83 | W2 |
2 Guardians | 81 | 75 | .519 | 14.5 | +2 | W5 |
3 Rangers | 78 | 78 | .500 | 17.5 | -34 | L1 |
4 Yankees | 89 | 66 | .574 | 6 | +137 | L2 |
5 Red Sox | 84 | 72 | .538 | 11.5 | +80 | L2 |
6 White Sox | 80 | 76 | .513 | 15.5 | +42 | W2 |
7 Astros | 77 | 79 | .494 | 18.5 | -59 | L3 |
8 Blue Jays | 77 | 79 | .494 | 18.5 | -42 | W1 |
9 Orioles | 75 | 81 | .481 | 20.5 | -31 | L3 |
10 Mariners | 73 | 83 | .468 | 22.5 | -56 | W1 |
11 Twins | 73 | 83 | .468 | 22.5 | -64 | W1 |
12 Tigers | 73 | 83 | .468 | 22.5 | +68 | L2 |
13 Royals | 67 | 89 | .429 | 28.5 | -102 | L4 |
14 Athletics | 61 | 95 | .391 | 34.5 | -223 | L6 |
15 Angels | 60 | 96 | .385 | 35.5 | -87 | L1 |
National League
| Team | W | L | PCT | GB | DIFF | STRK |
|---|---|---|---|---|---|---|
1 Brewers | 98 | 58 | .628 | - | +202 | W3 |
| 2Dodgers | 96 | 60 | .615 | 2 | +193 | W4 |
| 3Braves | 92 | 64 | .590 | 6 | +120 | W3 |
| 4Cubs | 87 | 69 | .558 | 11 | +152 | W2 |
5 Padres | 87 | 69 | .558 | 11 | +41 | W5 |
6 Phillies | 86 | 70 | .551 | 12 | +29 | W1 |
7 Diamondbacks | 82 | 74 | .526 | 16 | -1 | W2 |
8 Pirates | 79 | 77 | .506 | 19 | +29 | W4 |
9 Marlins | 76 | 80 | .487 | 22 | -3 | L3 |
10 Cardinals | 76 | 80 | .487 | 22 | -23 | W1 |
11 Nationals | 73 | 83 | .468 | 25 | +12 | L1 |
| 12Reds | 72 | 84 | .462 | 26 | -163 | L2 |
13 Mets | 71 | 85 | .455 | 27 | -41 | L1 |
14 Giants | 64 | 92 | .410 | 34 | -84 | L3 |
15 Rockies | 57 | 99 | .365 | 41 | -177 | L1 |
CHC
VS
CIN
Pitchers
David Peterson
Catchers
Miguel Amaya
Infielders
Michael Busch
Alex Bregman
Nico Hoerner
Pedro Ramirez
Outfielders
Pete Crow-Armstrong
Seiya Suzuki
Ian Happ
Designated Hitters
Michael Conforto
Pitchers
Rhett Lowder
Catchers
Will Banfield
Infielders
Elly De La Cruz
Sal Stewart
Matt McLain
Ke'Bryan Hayes
Outfielders
Dane Myers
JJ Bleday
Oswaldo Cabrera
Designated Hitters
Tyler Stephenson
Cubs
VS
Reds
Batting
156
Team Games Played
156
5355
At Bats
5178
1350
Hits
1184
790
Runs Batted In
612
217
Home Runs
204
108
Stolen Bases
107
.252
Batting Average
.229
835
Runs
642
264
Doubles
212
25
Triples
14
2315
Total Bases
2036
654
Walks
543
1294
Strikeouts
1482
.340
On Base Percentage
.306
.432
Slugging Percentage
.393
.772
OBP Pct + SLG Pct
.699
156
Games Played
156
156
Games Started
156
83
Hit By Pitch
49
0.0
Wins Above Replacement
0.0
0.0
Offensive Wins Above Replacement
0.0
20
Caught Stealing
34
1
Is Qualified
1
814.6
Runs Created
639.2
5.3
Runs Created Per 27 Outs
4.1
.106
Walks Per Plate Appearance
.093
0.51
Walk To Strikeout Ratio
0.37
.180
Isolated Power
.165
.319
Secondary Average
.284
3.96
Pitches Per Plate Appearance
3.94
506
Extra Base Hits
430
6148
Plate Appearances
5826
24.7
At Bats Per Home Run
25.4
10
Sacrifice Hit
15
45
Sacrifice Flies
38
Pitching
156
Team Games Played
156
51
Quality Starts
46
87
Wins
72
69
Losses
84
34
Saves
41
55
Holds
85
1279
Hits
1355
644
Earned runs
751
228
Home Runs
209
480
Walks
649
1212
Strikeouts
1256
7.8
Strikeouts Per 9 Innings
8.2
145.2
Pitches Per Start
153.3
1.26
Walks Plus Hits Per Inning Pitched
1.45
4.16
Earned Run Average
4.89
69
Losses
84
1392.0
Innings pitched
1381.0
.558
Win Percentage
.462
62
Save Opportunities
63
.243
Opponent Batting Average
.255
.312
Opponent's On-base pct.
.342
.412
Opponent's Slugging pct.
.430
.725
Opponent's OPB Pct + SLG Pct
.772
5255
At Bats
5315
178
Doubles
243
13
Triples
30
58
Batters Hit
82
88
Stolen Bases
141
156
Games Played
156
0
Complete Games
0
6
Shutouts
8
34
Wild Pitches
44
660
Runs Batted In
775
3
Balks
3
1392.0
Innings pitched
1381.0
7.8
Strikeouts Per 9 Innings
8.2
31
Caught Stealing
35
156
Games Started
156
0.0
Wins Above Replacement
0.0
1
Is Qualified
1
683
Runs
805
644
Earned Runs
751
2167
Total Bases
2285
Fielding
156
Team Games Played
156
1392
Full Innings
1381
5713
Total Chances
5480
4176
Putouts
4143
1478
Assists
1250
59
Errors
87
264
Double Plays
212
0.990
Fielding Percentage
0.984
36.6
Range Factor
35.1
0.0
Zone Rating
0.0
156
Games Played
156
0
Games Started
0
0.0
Defensive Wins Above Replacement
0.0
1
Qualified
1