

Diamondbacks vs Astros Live Score (5 Sep, 2026)
Game Information
Stage
STD
Season
2026
First Pitch
Sat, Sep 5, 7:15 pm
Venue
Daikin Park
Location
Houston, Texas
Venue Type
Indoor
Broadcast
MLB.TV
Attendance
36,470
Live Situation
0Balls
3Strikes
0Outs
—Pitcher
—At Bat
Pitch Sequence
1
STRIKE LOOKING
Sinker
97 MPH
2
STRIKE LOOKING
Sinker
98 MPH
3
STRIKE SWINGING
Sinker
99 MPH
Injury Report









Team Stats
 ARI
HOU


4
Runs
3
8
Hits
9
0
Errors
0
1
Home Runs
0
3
Walks
2
8
Strikeouts
10
Player Box Score
Arizona Diamondbacks
| Player | H-AB | AB | R | H | RBI | HR | BB | K | #P | AVG | OBP | SLG |
|---|---|---|---|---|---|---|---|---|---|---|---|---|
 Lars Nootbaar | 2-3 | 3 | 0 | 2 | 1 | 0 | 1 | 0 | 17 | .234 | .338 | .377 |
 Ildemaro Vargas | 0-1 | 1 | 1 | 0 | 0 | 0 | 0 | 0 | 3 | .251 | .292 | .383 |
 Geraldo Perdomo | 0-3 | 3 | 0 | 0 | 1 | 0 | 0 | 1 | 18 | .250 | .357 | .365 |
 Gabriel Moreno | 2-5 | 5 | 0 | 2 | 1 | 0 | 0 | 1 | 24 | .300 | .380 | .469 |
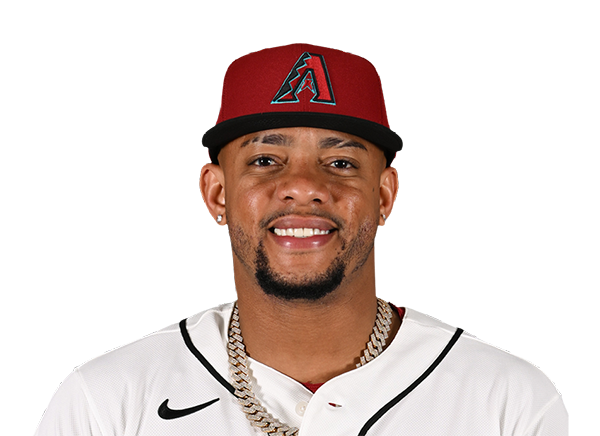 Ketel Marte | 1-5 | 5 | 1 | 1 | 1 | 1 | 0 | 0 | 17 | .251 | .317 | .449 |
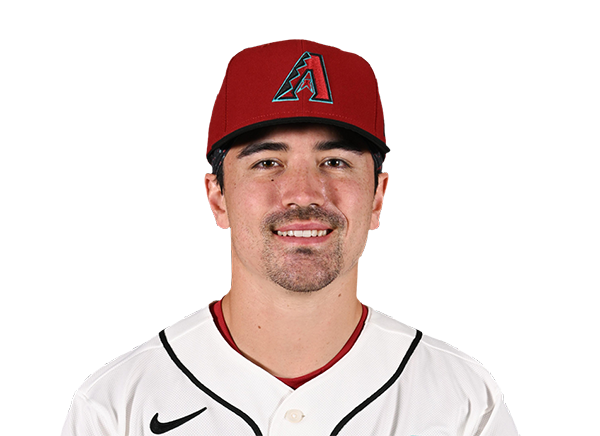 Corbin Carroll | 1-5 | 5 | 0 | 1 | 0 | 0 | 0 | 1 | 27 | .238 | .334 | .465 |
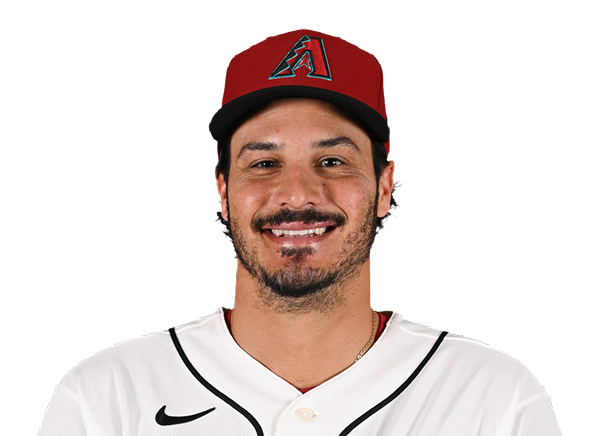 Nolan Arenado | 1-4 | 4 | 0 | 1 | 0 | 0 | 0 | 1 | 11 | .233 | .307 | .418 |
 Max Kepler | 0-4 | 4 | 0 | 0 | 0 | 0 | 0 | 2 | 16 | .205 | .262 | .303 |
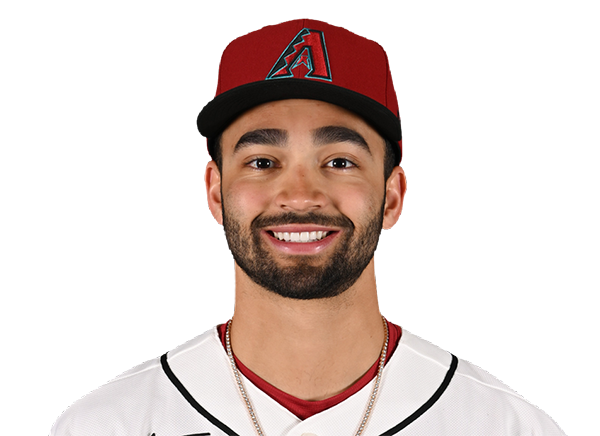 Jordan Lawlar | 0-0 | 0 | 0 | 0 | 0 | 0 | 0 | 0 | 0 | .269 | .337 | .449 |
 Tim Tawa | 1-3 | 3 | 2 | 1 | 0 | 0 | 1 | 2 | 17 | .238 | .299 | .389 |
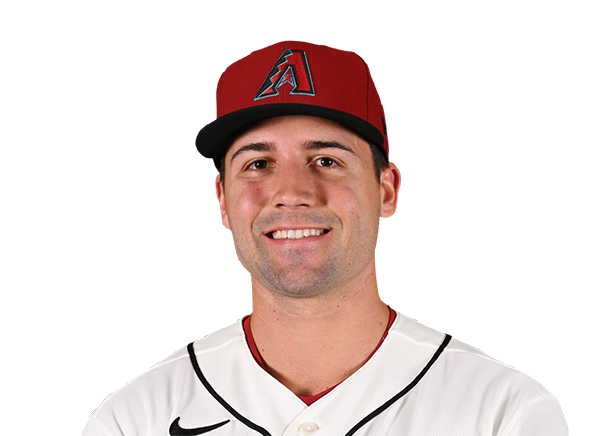 Ryan Waldschmidt | 0-3 | 3 | 0 | 0 | 0 | 0 | 1 | 0 | 21 | .266 | .331 | .378 |
Houston Astros
| Player | H-AB | AB | R | H | RBI | HR | BB | K | #P | AVG | OBP | SLG |
|---|---|---|---|---|---|---|---|---|---|---|---|---|
 Jeremy Pena | 0-5 | 5 | 1 | 0 | 0 | 0 | 0 | 2 | 19 | .274 | .327 | .461 |
 Yordan Alvarez | 0-3 | 3 | 0 | 0 | 0 | 0 | 2 | 2 | 21 | .315 | .434 | .597 |
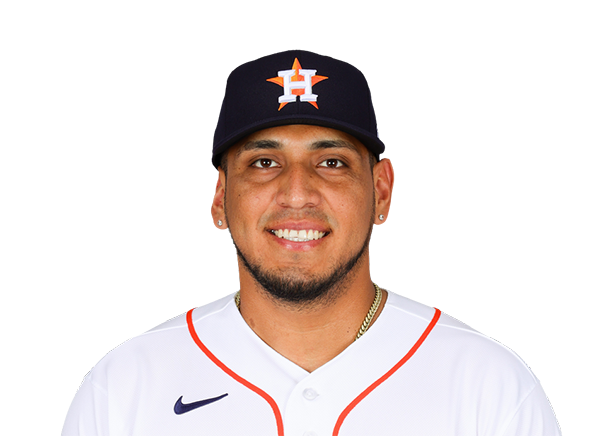 Isaac Paredes | 2-5 | 5 | 0 | 2 | 3 | 0 | 0 | 0 | 24 | .259 | .358 | .423 |
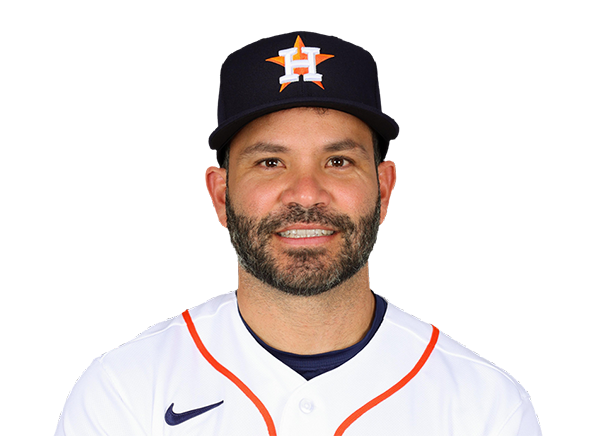 Jose Altuve | 1-5 | 5 | 0 | 1 | 0 | 0 | 0 | 1 | 13 | .242 | .305 | .395 |
 Daulton Varsho | 1-4 | 4 | 0 | 1 | 0 | 0 | 0 | 0 | 14 | .227 | .291 | .359 |
 Christian Walker | 0-4 | 4 | 0 | 0 | 0 | 0 | 0 | 1 | 12 | .227 | .300 | .422 |
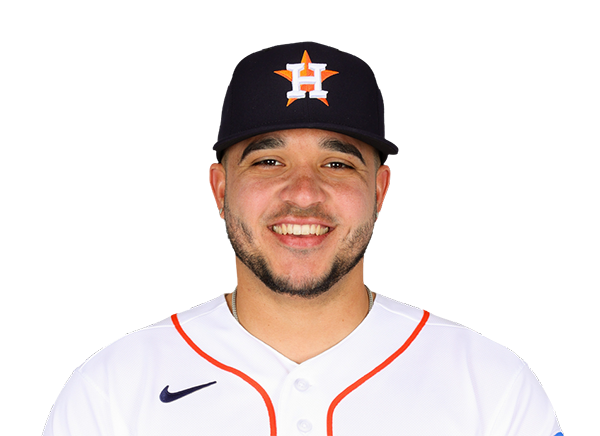 Yainer Diaz | 2-4 | 4 | 1 | 2 | 0 | 0 | 0 | 1 | 16 | .265 | .294 | .429 |
 Jake Meyers | 0-0 | 0 | 0 | 0 | 0 | 0 | 0 | 0 | 0 | .213 | .268 | .326 |
 Christian Vazquez | 0-0 | 0 | 0 | 0 | 0 | 0 | 0 | 0 | 0 | .211 | .267 | .333 |
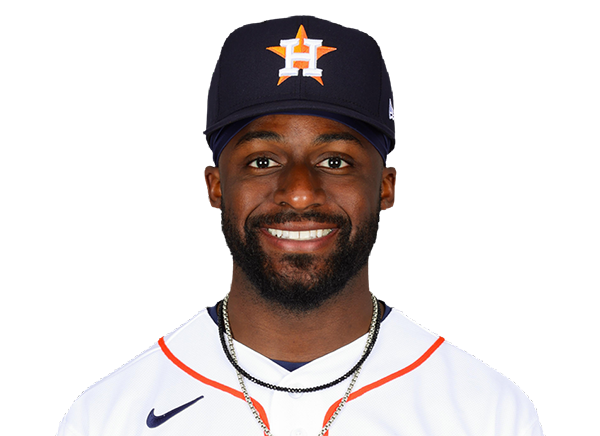 Taylor Trammell | 1-4 | 4 | 1 | 1 | 0 | 0 | 0 | 2 | 14 | .206 | .291 | .362 |
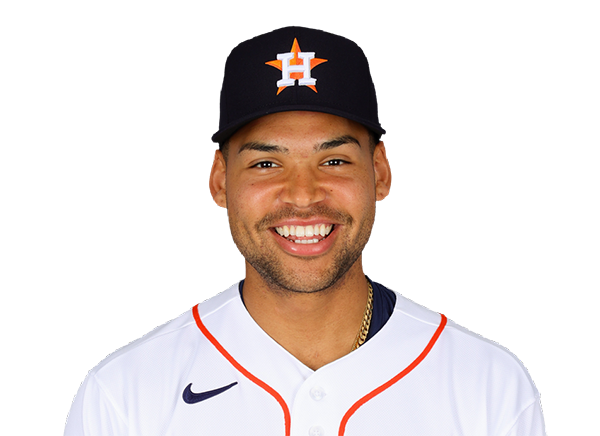 Cam Smith | 2-4 | 4 | 0 | 2 | 0 | 0 | 0 | 1 | 21 | .214 | .280 | .391 |
Arizona Diamondbacks
| Player | IP | H | R | ER | BB | K | HR | PC-ST | ERA | PC |
|---|---|---|---|---|---|---|---|---|---|---|
 Brandon Pfaadt | 6.1 | 7 | 3 | 3 | 2 | 4 | 0 | 93-60 | 3.53 | 93 |
 Kevin Ginkel | 0.2 | 0 | 0 | 0 | 0 | 1 | 0 | 12-8 | 4.14 | 12 |
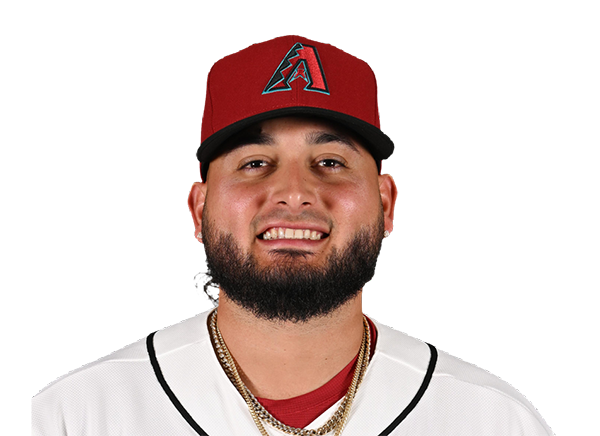 Juan Morillo | 1.0 | 1 | 0 | 0 | 0 | 1 | 0 | 19-13 | 2.08 | 19 |
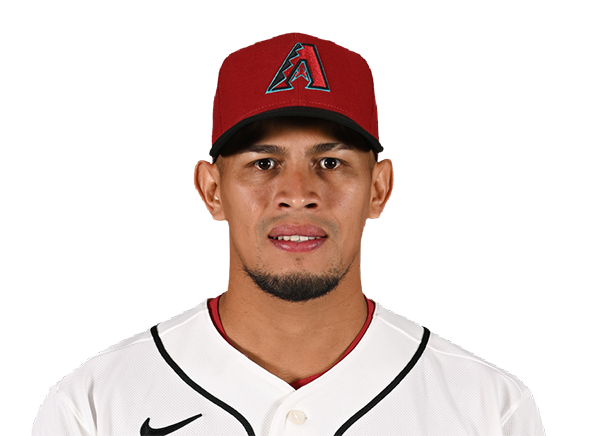 Jonathan Loaisiga | 1.0 | 1 | 0 | 0 | 0 | 2 | 0 | 17-11 | 2.35 | 17 |
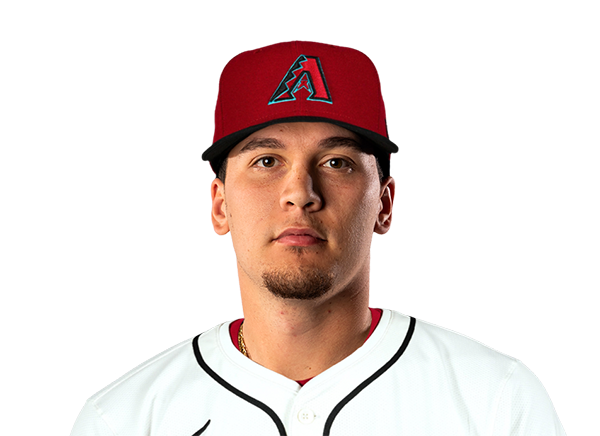 Brandyn Garcia | 1.0 | 0 | 0 | 0 | 0 | 2 | 0 | 13-9 | 2.14 | 13 |
Houston Astros
| Player | IP | H | R | ER | BB | K | HR | PC-ST | ERA | PC |
|---|---|---|---|---|---|---|---|---|---|---|
 Ethan Pecko | 4.1 | 5 | 1 | 1 | 1 | 2 | 0 | 81-48 | 5.19 | 81 |
 Enyel De Los Santos | 1.2 | 0 | 0 | 0 | 0 | 2 | 0 | 22-17 | 4.32 | 22 |
 Kai-Wei Teng | 0.1 | 0 | 1 | 1 | 2 | 1 | 0 | 17-6 | 4.76 | 17 |
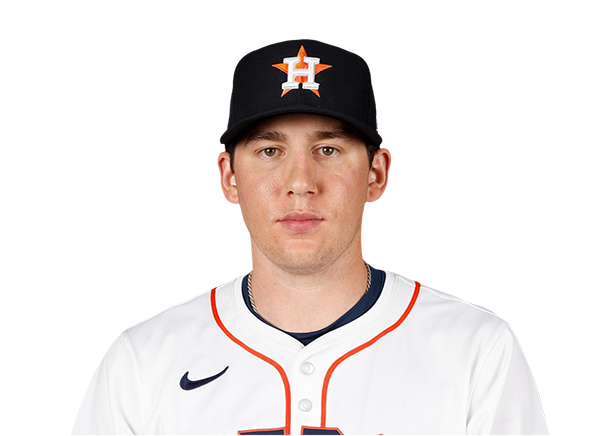 AJ Blubaugh | 1.2 | 2 | 1 | 1 | 0 | 2 | 1 | 31-22 | 3.07 | 31 |
 Josh Hader | 1.0 | 0 | 0 | 0 | 0 | 1 | 0 | 10-9 | 0.69 | 10 |
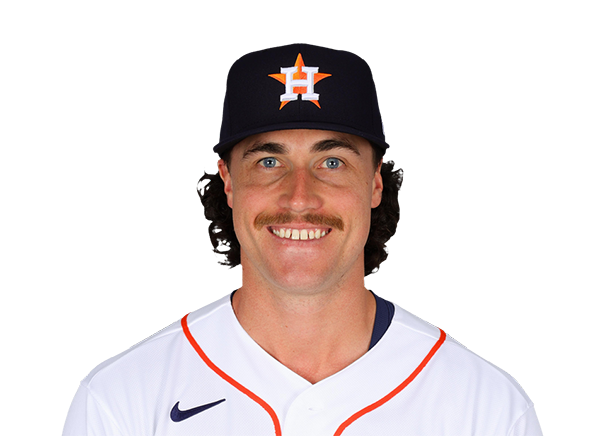 Bryan King | 1.0 | 1 | 1 | 0 | 0 | 0 | 0 | 10-8 | 4.67 | 10 |
H2H / Season Series
HOU3–4
ARI
HOU3–1
ARI
Last 5 Games
| Date | Opponent | Result |
|---|---|---|
| Sep 5 | @ HOU | W4–3 |
| Sep 4 | @ HOU | L1–3 |
| Sep 2 |  vs PHI | W1–0 |
| Sep 1 | vs PHI | L1–7 |
| Aug 31 | vs PHI | L1–2 |
| Date | Opponent | Result |
|---|---|---|
| Sep 5 | vs ARI | L3–4 |
| Sep 4 | vs ARI | W3–1 |
| Sep 3 |  vs CHW | W6–2 |
| Sep 2 | vs CHW | W2–0 |
| Sep 1 | vs CHW | L1–5 |
Standings
American League
| Team | W | L | PCT | GB | DIFF | STRK |
|---|---|---|---|---|---|---|
1 Rays | 85 | 57 | .599 | - | +49 | W2 |
| 2White Sox | 74 | 68 | .521 | 11 | +40 | L1 |
| 3Astros | 73 | 70 | .510 | 12.5 | -37 | L1 |
4 Yankees | 81 | 61 | .570 | 4 | +118 | W1 |
5 Red Sox | 78 | 65 | .545 | 7.5 | +84 | W3 |
6 Blue Jays | 72 | 71 | .503 | 13.5 | -33 | W4 |
7 Guardians | 72 | 71 | .503 | 13.5 | -15 | L1 |
8 Rangers | 70 | 73 | .490 | 15.5 | -46 | L2 |
9 Orioles | 69 | 74 | .483 | 16.5 | -27 | L5 |
10 Twins | 68 | 74 | .479 | 17 | -39 | W1 |
11 Mariners | 66 | 77 | .462 | 19.5 | -73 | L3 |
12 Tigers | 65 | 77 | .458 | 20 | +51 | W1 |
13 Royals | 63 | 80 | .441 | 22.5 | -93 | L2 |
14 Athletics | 57 | 86 | .399 | 28.5 | -186 | W4 |
15 Angels | 54 | 88 | .380 | 31 | -76 | W1 |
National League
| Team | W | L | PCT | GB | DIFF | STRK |
|---|---|---|---|---|---|---|
1 Brewers | 88 | 55 | .615 | - | +172 | L1 |
2 Dodgers | 85 | 57 | .599 | 2.5 | +150 | W3 |
3 Braves | 84 | 58 | .592 | 3.5 | +119 | L1 |
4 Cubs | 81 | 62 | .566 | 7 | +139 | W3 |
| 5Phillies | 80 | 62 | .563 | 7.5 | +35 | W1 |
| 6Diamondbacks | 75 | 68 | .524 | 13 | -2 | W1 |
7 Padres | 74 | 68 | .521 | 13.5 | +7 | L1 |
8 Marlins | 71 | 72 | .497 | 17 | +8 | L3 |
9 Cardinals | 71 | 72 | .497 | 17 | -11 | L1 |
10 Pirates | 70 | 73 | .490 | 18 | +25 | L1 |
11 Reds | 68 | 74 | .479 | 19.5 | -109 | W1 |
12 Nationals | 67 | 77 | .465 | 21.5 | +11 | L3 |
13 Mets | 64 | 78 | .451 | 23.5 | -50 | L1 |
14 Giants | 59 | 84 | .413 | 29 | -73 | W1 |
15 Rockies | 55 | 87 | .387 | 32.5 | -138 | W1 |
ARI
VS
HOU
Pitchers
Brandon Pfaadt
Catchers
Gabriel Moreno
Infielders
Geraldo Perdomo
Ketel Marte
Nolan Arenado
Tim Tawa
Outfielders
Corbin Carroll
Max Kepler
Ryan Waldschmidt
Designated Hitters
Lars Nootbaar
Pitchers
Ethan Pecko
Catchers
Yainer Diaz
Infielders
Jeremy Pena
Isaac Paredes
Jose Altuve
Christian Walker
Outfielders
Daulton Varsho
Taylor Trammell
Cam Smith
Designated Hitters
Yordan Alvarez
Diamondbacks
VS
Astros
Batting
143
Team Games Played
143
4781
At Bats
4801
1155
Hits
1153
604
Runs Batted In
614
140
Home Runs
186
98
Stolen Bases
43
.242
Batting Average
.240
633
Runs
645
239
Doubles
210
35
Triples
18
1884
Total Bases
1957
476
Walks
472
1045
Strikeouts
1168
.314
On Base Percentage
.315
.394
Slugging Percentage
.408
.708
OBP Pct + SLG Pct
.722
143
Games Played
143
143
Games Started
143
49
Hit By Pitch
68
0.0
Wins Above Replacement
0.0
0.0
Offensive Wins Above Replacement
0.0
23
Caught Stealing
19
1
Is Qualified
1
610.6
Runs Created
619.9
4.3
Runs Created Per 27 Outs
4.4
.088
Walks Per Plate Appearance
.087
0.46
Walk To Strikeout Ratio
0.40
.152
Isolated Power
.167
.268
Secondary Average
.271
3.94
Pitches Per Plate Appearance
3.88
414
Extra Base Hits
414
5388
Plate Appearances
5396
34.2
At Bats Per Home Run
25.8
34
Sacrifice Hit
17
45
Sacrifice Flies
36
Pitching
143
Team Games Played
143
52
Quality Starts
39
75
Wins
73
68
Losses
70
35
Saves
45
74
Holds
77
1201
Hits
1130
584
Earned runs
638
161
Home Runs
182
425
Walks
591
979
Strikeouts
1256
6.9
Strikeouts Per 9 Innings
8.9
141.3
Pitches Per Start
152.4
1.28
Walks Plus Hits Per Inning Pitched
1.35
4.14
Earned Run Average
4.52
68
Losses
70
1269.0
Innings pitched
1270.1
.524
Win Percentage
.510
50
Save Opportunities
55
.249
Opponent Batting Average
.238
.315
Opponent's On-base pct.
.330
.411
Opponent's Slugging pct.
.402
.725
Opponent's OPB Pct + SLG Pct
.732
4819
At Bats
4757
239
Doubles
190
28
Triples
22
56
Batters Hit
82
84
Stolen Bases
115
143
Games Played
143
1
Complete Games
0
10
Shutouts
9
26
Wild Pitches
46
619
Runs Batted In
651
5
Balks
6
1269.0
Innings pitched
1270.1
6.9
Strikeouts Per 9 Innings
8.9
18
Caught Stealing
36
143
Games Started
143
0.0
Wins Above Replacement
0.0
1
Is Qualified
1
635
Runs
682
584
Earned Runs
638
1979
Total Bases
1910
Fielding
143
Team Games Played
143
1269
Full Innings
1270
5102
Total Chances
4929
3807
Putouts
3811
1242
Assists
1054
53
Errors
64
239
Double Plays
210
0.990
Fielding Percentage
0.987
35.8
Range Factor
34.5
0.0
Zone Rating
0.0
143
Games Played
143
0
Games Started
0
0.0
Defensive Wins Above Replacement
0.0
1
Qualified
1