

Diamondbacks vs Padres Live Score (26 Sep, 2026)
Game Information
Stage
STD
Season
2026
First Pitch
Fri, Sep 25, 9:40 pm
Venue
Petco Park
Location
San Diego, California
Venue Type
Outdoor
Broadcast
MLB.TV
Attendance
44,512
Live Situation
0Balls
2Strikes
0Outs
—Pitcher
—At Bat
Pitch Sequence
1
STRIKE SWINGING
Slider
89 MPH
2
STRIKE FOUL
Knuckle Curve
82 MPH
3
BALL IN PLAY
Four-seam FB
94 MPH
Injury Report









Team Stats
 ARI
SD


11
Runs
4
8
Hits
10
0
Errors
0
3
Home Runs
0
8
Walks
2
4
Strikeouts
7
Player Box Score
Arizona Diamondbacks
| Player | H-AB | AB | R | H | RBI | HR | BB | K | #P | AVG | OBP | SLG |
|---|---|---|---|---|---|---|---|---|---|---|---|---|
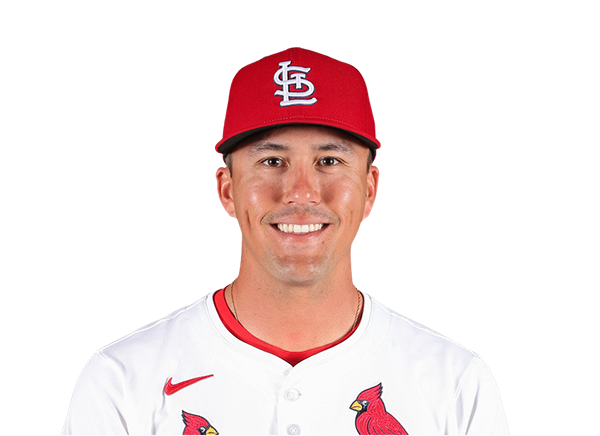 Lars Nootbaar | 1-3 | 3 | 3 | 1 | 1 | 1 | 2 | 0 | 20 | .241 | .343 | .385 |
 Ildemaro Vargas | 0-0 | 0 | 0 | 0 | 0 | 0 | 0 | 0 | 0 | .255 | .299 | .379 |
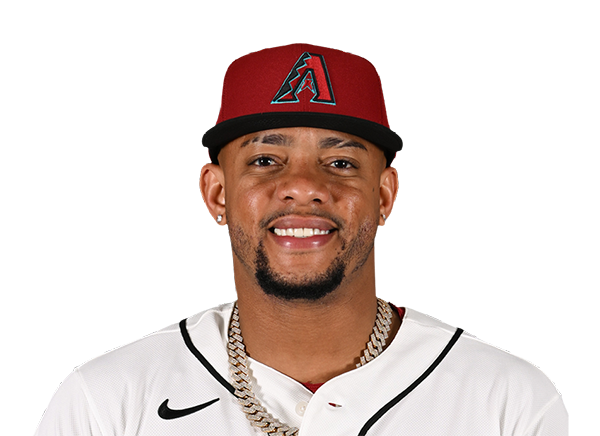 Ketel Marte | 0-4 | 4 | 1 | 0 | 0 | 0 | 1 | 0 | 18 | .248 | .315 | .432 |
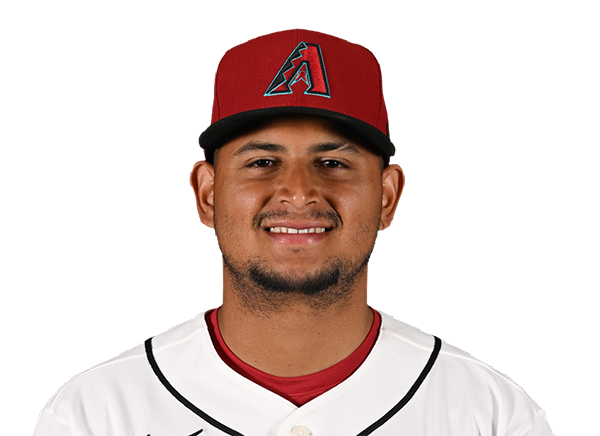 Gabriel Moreno | 2-3 | 3 | 2 | 2 | 1 | 0 | 1 | 0 | 14 | .311 | .387 | .487 |
 James McCann | 0-1 | 1 | 0 | 0 | 0 | 0 | 0 | 1 | 3 | .284 | .314 | .446 |
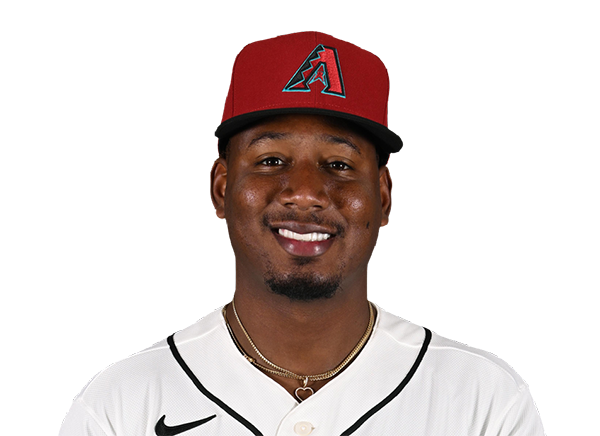 Geraldo Perdomo | 2-3 | 3 | 2 | 2 | 4 | 0 | 2 | 0 | 22 | .263 | .369 | .379 |
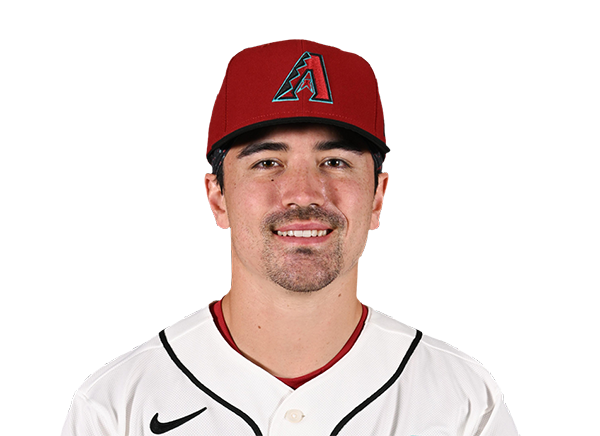 Corbin Carroll | 0-4 | 4 | 0 | 0 | 1 | 0 | 0 | 1 | 15 | .239 | .329 | .469 |
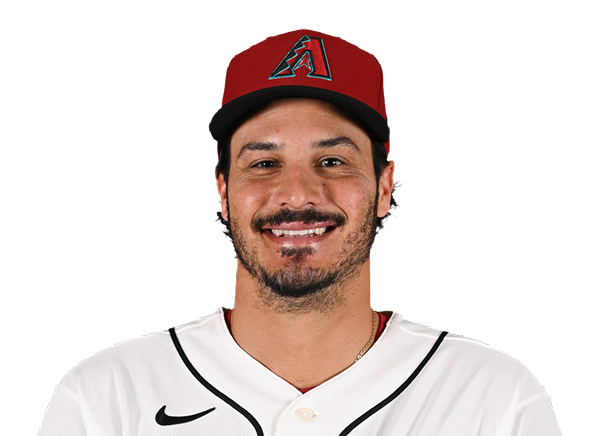 Nolan Arenado | 1-3 | 3 | 2 | 1 | 2 | 1 | 1 | 0 | 17 | .254 | .329 | .474 |
 Tim Tawa | 1-4 | 4 | 0 | 1 | 0 | 0 | 1 | 0 | 24 | .233 | .292 | .390 |
 Pavin Smith | 0-2 | 2 | 0 | 0 | 0 | 0 | 0 | 1 | 8 | .186 | .270 | .304 |
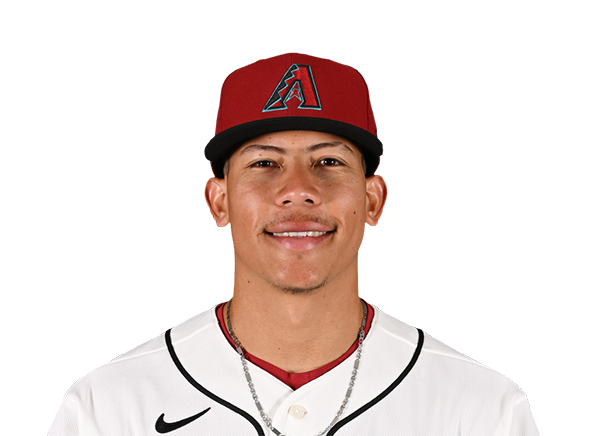 Jose Fernandez | 0-1 | 1 | 0 | 0 | 0 | 0 | 0 | 0 | 7 | .256 | .301 | .345 |
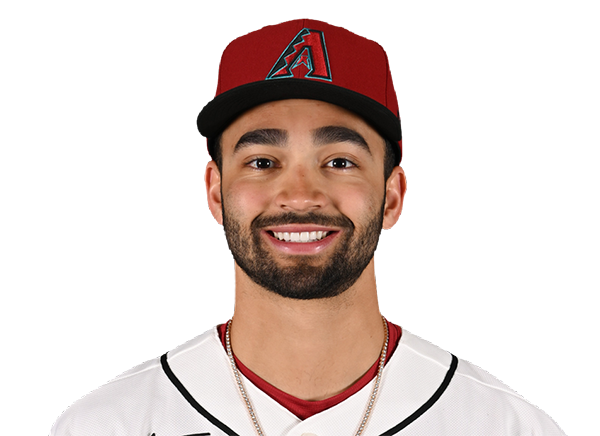 Jordan Lawlar | 1-4 | 4 | 1 | 1 | 1 | 1 | 0 | 1 | 17 | .256 | .318 | .463 |
San Diego Padres
| Player | H-AB | AB | R | H | RBI | HR | BB | K | #P | AVG | OBP | SLG |
|---|---|---|---|---|---|---|---|---|---|---|---|---|
 Fernando Tatis Jr. | 2-3 | 3 | 0 | 2 | 0 | 0 | 0 | 0 | 11 | .291 | .360 | .473 |
 Jase Bowen | 0-1 | 1 | 0 | 0 | 0 | 0 | 0 | 1 | 5 | .151 | .194 | .258 |
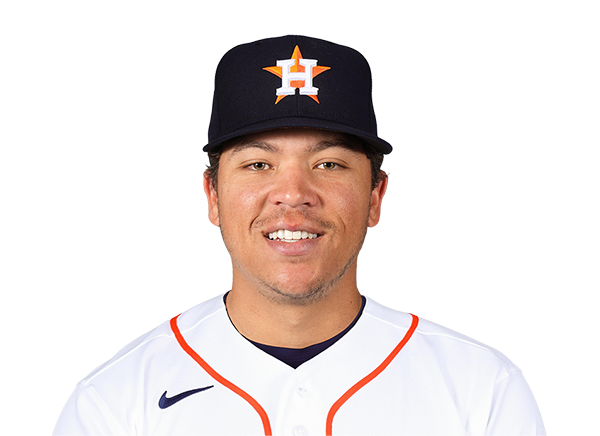 Dustin Harris | 1-3 | 3 | 1 | 1 | 0 | 0 | 1 | 0 | 13 | .285 | .350 | .366 |
 Manny Machado | 0-4 | 4 | 0 | 0 | 0 | 0 | 0 | 2 | 20 | .215 | .302 | .402 |
 Ty France | 0-3 | 3 | 0 | 0 | 0 | 0 | 1 | 3 | 19 | .294 | .360 | .505 |
 Jackson Merrill | 1-2 | 2 | 1 | 1 | 0 | 0 | 0 | 0 | 3 | .253 | .301 | .440 |
 Sung-Mun Song | 2-2 | 2 | 1 | 2 | 1 | 0 | 0 | 0 | 9 | .195 | .293 | .250 |
 Xander Bogaerts | 2-2 | 2 | 1 | 2 | 0 | 0 | 0 | 0 | 7 | .230 | .329 | .338 |
 Austin Hays | 0-2 | 2 | 0 | 0 | 0 | 0 | 0 | 0 | 8 | .271 | .290 | .396 |
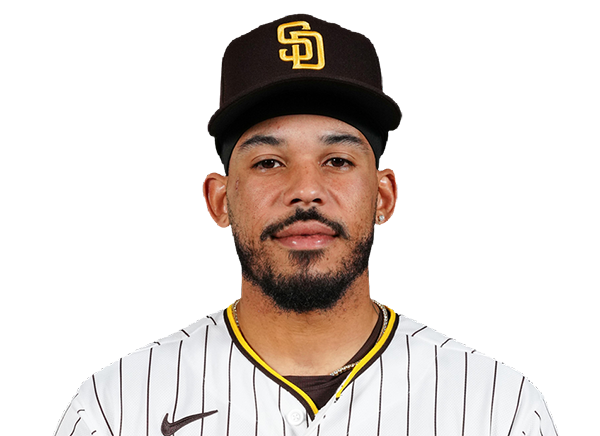 Luis Campusano | 1-4 | 4 | 0 | 1 | 1 | 0 | 0 | 0 | 8 | .268 | .363 | .437 |
 Jake Cronenworth | 1-4 | 4 | 0 | 1 | 2 | 0 | 0 | 1 | 12 | .224 | .303 | .318 |
 Samad Taylor | 0-4 | 4 | 0 | 0 | 0 | 0 | 0 | 0 | 10 | .315 | .391 | .409 |
Arizona Diamondbacks
| Player | IP | H | R | ER | BB | K | HR | PC-ST | ERA | PC |
|---|---|---|---|---|---|---|---|---|---|---|
 Brandon Pfaadt | 7.2 | 9 | 4 | 4 | 2 | 7 | 0 | 106-71 | 3.77 | 106 |
 Ryne Nelson | 0.1 | 1 | 0 | 0 | 0 | 0 | 0 | 12-6 | 4.80 | 12 |
 Zac Gallen | 1.0 | 0 | 0 | 0 | 0 | 0 | 0 | 7-6 | 6.07 | 7 |
San Diego Padres
| Player | IP | H | R | ER | BB | K | HR | PC-ST | ERA | PC |
|---|---|---|---|---|---|---|---|---|---|---|
 Casey Mize | 4.0 | 7 | 7 | 7 | 2 | 1 | 3 | 71-48 | 4.32 | 71 |
 David Morgan | 1.0 | 0 | 0 | 0 | 1 | 0 | 0 | 14-8 | 3.90 | 14 |
 Kyle Hart | 1.0 | 1 | 3 | 3 | 3 | 2 | 0 | 28-13 | 4.92 | 28 |
 Jason Adam | 1.0 | 0 | 1 | 1 | 2 | 0 | 0 | 27-13 | 2.62 | 27 |
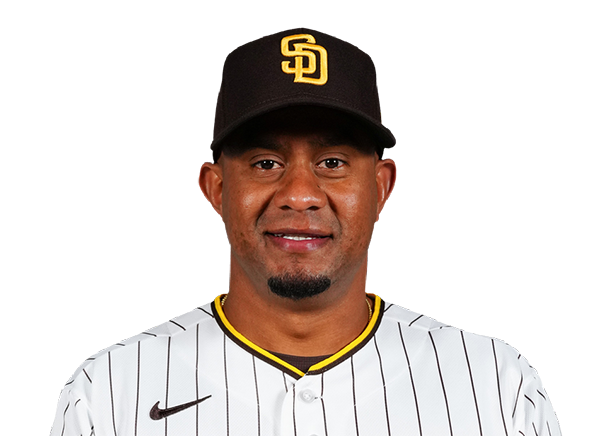 Wandy Peralta | 2.0 | 0 | 0 | 0 | 0 | 1 | 0 | 25-17 | 3.61 | 25 |
H2H / Season Series
SD4–11
ARI
ARI1–5
SD
ARI10–4
SD
ARI4–9
SD
ARI5–1
SD
SD1–3
ARI
SD10–4
ARI
SD4–1
ARI
SD0–8
ARI
ARI12–7
SD
Last 5 Games
| Date | Opponent | Result |
|---|---|---|
| Sep 25 | @ SD | W11–4 |
| Sep 24 |  @ COL | W12–8 |
| Sep 23 | @ COL | W5–3 |
| Sep 22 | @ COL | W7–2 |
| Sep 20 |  vs NYY | W8–4 |
| Date | Opponent | Result |
|---|---|---|
| Sep 25 | vs ARI | L4–11 |
| Sep 24 |  @ LAD | W4–2 |
| Sep 23 | @ LAD | W5–1 |
| Sep 22 | @ LAD | L0–7 |
| Sep 20 |  vs MIA | W7–3 |
Standings
American League
| Team | W | L | PCT | GB | DIFF | STRK |
|---|---|---|---|---|---|---|
1 Rays | 97 | 63 | .606 | - | +79 | W1 |
2 Guardians | 84 | 76 | .525 | 13 | +6 | W2 |
3 Astros | 79 | 81 | .494 | 18 | -52 | L1 |
| 4Yankees | 93 | 68 | .578 | 4.5 | +138 | W1 |
5 Red Sox | 87 | 74 | .540 | 10.5 | +82 | W2 |
6 White Sox | 83 | 77 | .519 | 14 | +57 | W2 |
7 Rangers | 79 | 81 | .494 | 18 | -48 | L1 |
8 Orioles | 79 | 82 | .491 | 18.5 | -21 | L1 |
9 Blue Jays | 78 | 82 | .488 | 19 | -46 | W1 |
10 Twins | 76 | 84 | .475 | 21 | -56 | W3 |
11 Tigers | 75 | 85 | .469 | 22 | +72 | W1 |
12 Mariners | 74 | 86 | .463 | 23 | -66 | L2 |
13 Royals | 68 | 92 | .425 | 29 | -115 | L2 |
14 Athletics | 64 | 96 | .400 | 33 | -218 | W1 |
15 Angels | 62 | 98 | .388 | 35 | -89 | W2 |
National League
| Team | W | L | PCT | GB | DIFF | STRK |
|---|---|---|---|---|---|---|
1 Brewers | 101 | 59 | .631 | - | +211 | W3 |
| 2Dodgers | 98 | 62 | .613 | 3 | +196 | W1 |
3 Braves | 93 | 67 | .581 | 8 | +113 | L2 |
| 4Padres | 89 | 71 | .556 | 12 | +33 | L1 |
5 Cubs | 88 | 73 | .547 | 13.5 | +143 | L2 |
6 Phillies | 87 | 73 | .544 | 14 | +22 | L3 |
| 7Diamondbacks | 86 | 74 | .538 | 15 | +17 | W6 |
8 Pirates | 81 | 79 | .506 | 20 | +27 | L1 |
| 9Marlins | 79 | 81 | .494 | 22 | +6 | W1 |
10 Cardinals | 77 | 83 | .481 | 24 | -26 | L2 |
11 Nationals | 76 | 84 | .475 | 25 | +10 | W3 |
12 Reds | 74 | 86 | .463 | 27 | -160 | L1 |
13 Mets | 73 | 87 | .456 | 28 | -36 | L2 |
14 Giants | 65 | 95 | .406 | 36 | -86 | L3 |
| 15Rockies | 57 | 103 | .356 | 44 | -193 | L5 |
ARI
VS
SD
Pitchers
Brandon Pfaadt
Catchers
Gabriel Moreno
Infielders
Ketel Marte
Geraldo Perdomo
Nolan Arenado
Tim Tawa
Outfielders
Lars Nootbaar
Corbin Carroll
Jordan Lawlar
Designated Hitters
Pavin Smith
Pitchers
Casey Mize
Catchers
Luis Campusano
Infielders
Fernando Tatis Jr.
Ty France
Xander Bogaerts
Jake Cronenworth
Outfielders
Dustin Harris
Jackson Merrill
Samad Taylor
Designated Hitters
Manny Machado
Diamondbacks
VS
Padres
Batting
160
Team Games Played
160
5381
At Bats
5308
1323
Hits
1290
696
Runs Batted In
677
165
Home Runs
180
102
Stolen Bases
162
.246
Batting Average
.243
728
Runs
703
266
Doubles
231
42
Triples
22
2168
Total Bases
2105
534
Walks
544
1179
Strikeouts
1295
.318
On Base Percentage
.318
.403
Slugging Percentage
.397
.721
OBP Pct + SLG Pct
.714
160
Games Played
160
160
Games Started
160
57
Hit By Pitch
60
0.0
Wins Above Replacement
0.0
0.0
Offensive Wins Above Replacement
0.0
27
Caught Stealing
42
1
Is Qualified
1
707.7
Runs Created
684.5
4.5
Runs Created Per 27 Outs
4.3
.088
Walks Per Plate Appearance
.091
0.45
Walk To Strikeout Ratio
0.42
.157
Isolated Power
.154
.270
Secondary Average
.279
3.93
Pitches Per Plate Appearance
3.90
473
Extra Base Hits
433
6070
Plate Appearances
5986
32.6
At Bats Per Home Run
29.5
41
Sacrifice Hit
24
54
Sacrifice Flies
47
Pitching
160
Team Games Played
160
55
Quality Starts
37
86
Wins
89
74
Losses
71
38
Saves
48
84
Holds
106
1344
Hits
1286
650
Earned runs
626
183
Home Runs
179
473
Walks
547
1125
Strikeouts
1299
7.1
Strikeouts Per 9 Innings
8.2
141.8
Pitches Per Start
147.0
1.27
Walks Plus Hits Per Inning Pitched
1.29
4.10
Earned Run Average
3.97
74
Losses
71
1426.0
Innings pitched
1418.1
.538
Win Percentage
.556
56
Save Opportunities
67
.248
Opponent Batting Average
.241
.314
Opponent's On-base pct.
.318
.410
Opponent's Slugging pct.
.393
.723
Opponent's OPB Pct + SLG Pct
.711
5412
At Bats
5327
262
Doubles
226
31
Triples
22
65
Batters Hit
66
94
Stolen Bases
105
160
Games Played
160
1
Complete Games
0
10
Shutouts
11
31
Wild Pitches
42
691
Runs Batted In
646
5
Balks
5
1426.0
Innings pitched
1418.1
7.1
Strikeouts Per 9 Innings
8.2
22
Caught Stealing
51
160
Games Started
160
0.0
Wins Above Replacement
0.0
1
Is Qualified
1
711
Runs
670
650
Earned Runs
626
2217
Total Bases
2093
Fielding
160
Team Games Played
160
1426
Full Innings
1418
5719
Total Chances
5730
4278
Putouts
4255
1377
Assists
1412
64
Errors
63
266
Double Plays
231
0.989
Fielding Percentage
0.989
35.7
Range Factor
36.0
0.0
Zone Rating
0.0
160
Games Played
160
0
Games Started
0
0.0
Defensive Wins Above Replacement
0.0
1
Qualified
1