

Diamondbacks vs Rockies Live Score (24 Sep, 2026)
Game Information
Stage
STD
Season
2026
First Pitch
Wed, Sep 23, 8:40 pm
Venue
Coors Field
Location
Denver, Colorado
Venue Type
Outdoor
Broadcast
MLB.TV
Attendance
21,041
Live Situation
1Balls
2Strikes
0Outs
—Pitcher
—At Bat
Pitch Sequence
1
BALL
Curve
90 MPH
2
STRIKE FOUL
Sinker
98 MPH
3
STRIKE FOUL
Sinker
99 MPH
4
BALL IN PLAY
Curve
90 MPH
Injury Report








Team Stats
 ARI
COL


5
Runs
3
8
Hits
7
0
Errors
1
1
Home Runs
1
0
Walks
2
10
Strikeouts
5
Player Box Score
Arizona Diamondbacks
| Player | H-AB | AB | R | H | RBI | HR | BB | K | #P | AVG | OBP | SLG |
|---|---|---|---|---|---|---|---|---|---|---|---|---|
 Lars Nootbaar | 0-3 | 3 | 0 | 0 | 0 | 0 | 0 | 2 | 12 | .234 | .335 | .372 |
 Jordan Lawlar | 0-1 | 1 | 0 | 0 | 0 | 0 | 0 | 0 | 1 | .256 | .320 | .444 |
 Ketel Marte | 1-4 | 4 | 1 | 1 | 0 | 0 | 0 | 0 | 12 | .249 | .314 | .433 |
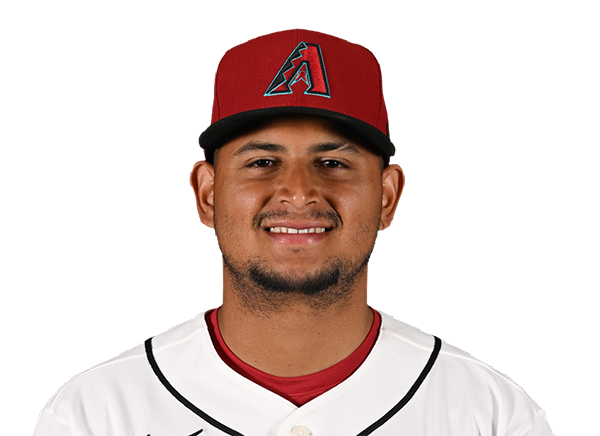 Gabriel Moreno | 3-4 | 4 | 1 | 3 | 1 | 0 | 0 | 0 | 8 | .310 | .387 | .484 |
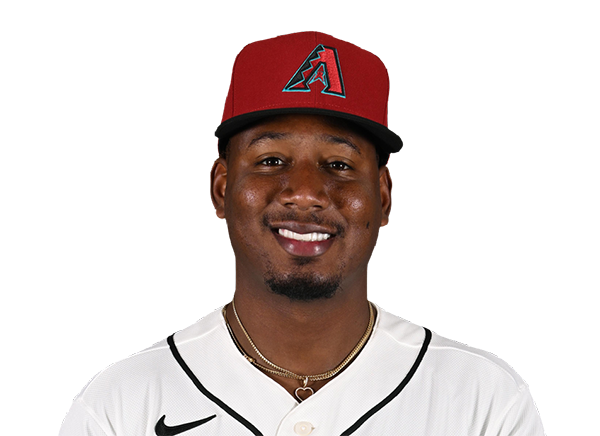 Geraldo Perdomo | 0-4 | 4 | 0 | 0 | 0 | 0 | 0 | 2 | 19 | .257 | .363 | .367 |
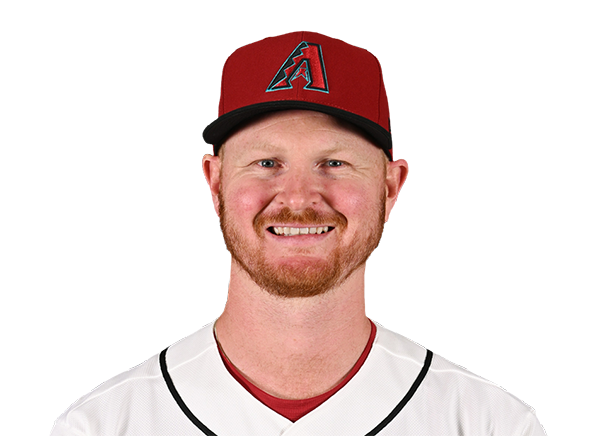 Pavin Smith | 1-3 | 3 | 1 | 1 | 0 | 0 | 0 | 1 | 7 | .175 | .257 | .289 |
 Ildemaro Vargas | 0-1 | 1 | 0 | 0 | 0 | 0 | 0 | 0 | 4 | .256 | .299 | .380 |
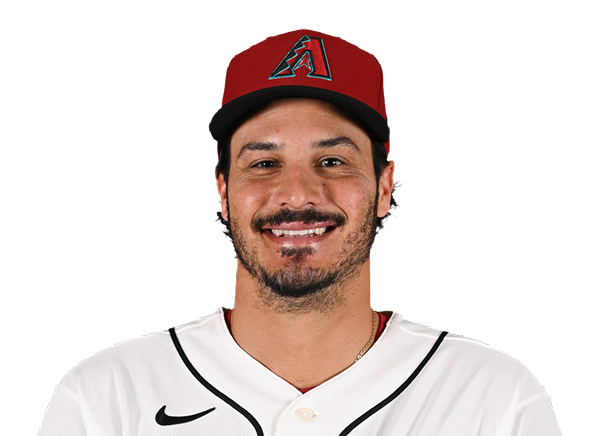 Nolan Arenado | 1-4 | 4 | 1 | 1 | 1 | 0 | 0 | 2 | 13 | .250 | .324 | .462 |
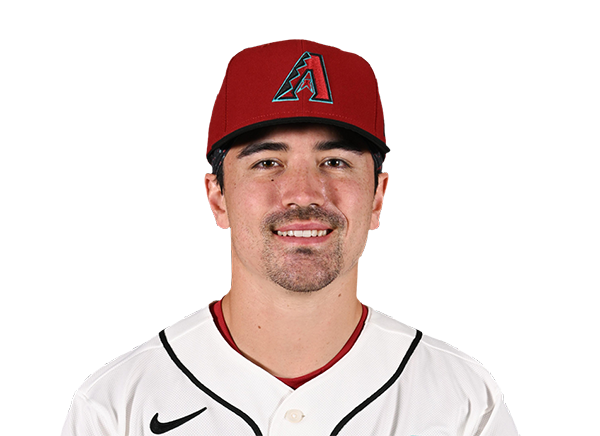 Corbin Carroll | 1-4 | 4 | 0 | 1 | 2 | 0 | 0 | 0 | 18 | .240 | .330 | .473 |
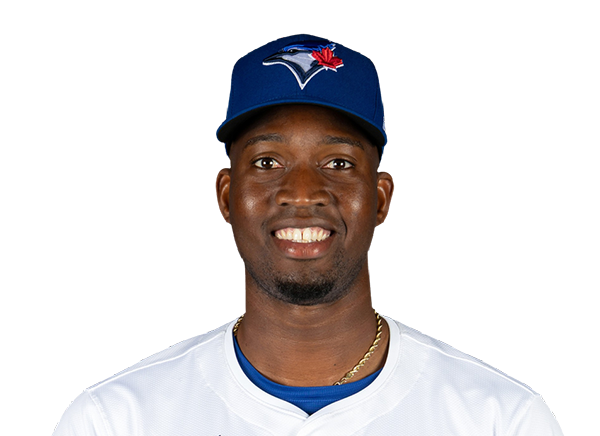 Jesus Sanchez | 0-3 | 3 | 0 | 0 | 0 | 0 | 0 | 2 | 13 | .254 | .311 | .401 |
 Tim Tawa | 1-3 | 3 | 1 | 1 | 1 | 1 | 0 | 1 | 8 | .236 | .294 | .399 |
Colorado Rockies
| Player | H-AB | AB | R | H | RBI | HR | BB | K | #P | AVG | OBP | SLG |
|---|---|---|---|---|---|---|---|---|---|---|---|---|
 Jake McCarthy | 1-4 | 4 | 0 | 1 | 0 | 0 | 0 | 0 | 9 | .295 | .337 | .484 |
 Cole Carrigg | 0-4 | 4 | 0 | 0 | 0 | 0 | 0 | 1 | 15 | .268 | .333 | .454 |
 Hunter Goodman | 2-3 | 3 | 0 | 2 | 1 | 0 | 0 | 0 | 13 | .246 | .311 | .525 |
 TJ Rumfield | 0-4 | 4 | 0 | 0 | 0 | 0 | 0 | 0 | 11 | .296 | .386 | .444 |
 Kyle Karros | 1-3 | 3 | 1 | 1 | 0 | 0 | 1 | 1 | 17 | .256 | .352 | .415 |
 Adael Amador | 1-4 | 4 | 0 | 1 | 1 | 0 | 0 | 0 | 11 | .282 | .363 | .507 |
 Mickey Moniak | 0-2 | 2 | 0 | 0 | 0 | 0 | 0 | 0 | 5 | .241 | .281 | .486 |
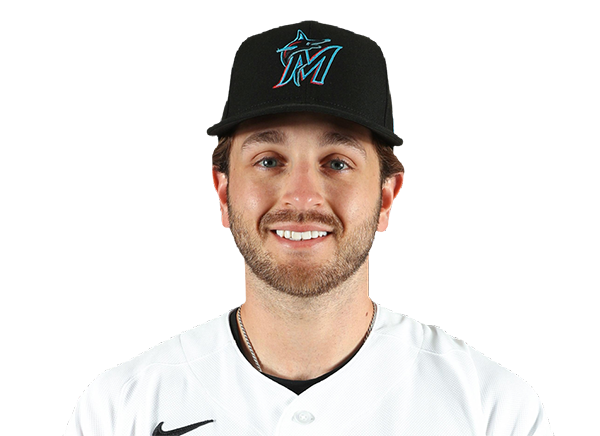 Connor Norby | 0-1 | 1 | 0 | 0 | 0 | 0 | 0 | 1 | 3 | .240 | .339 | .374 |
 Troy Johnston | 0-0 | 0 | 0 | 0 | 0 | 0 | 1 | 0 | 5 | .282 | .354 | .400 |
 Braxton Fulford | 0-0 | 0 | 0 | 0 | 0 | 0 | 0 | 0 | 0 | .167 | .253 | .264 |
 Zac Veen | 0-2 | 2 | 0 | 0 | 0 | 0 | 0 | 1 | 6 | .219 | .306 | .375 |
 Jordan Beck | 0-2 | 2 | 0 | 0 | 0 | 0 | 0 | 1 | 9 | .192 | .253 | .282 |
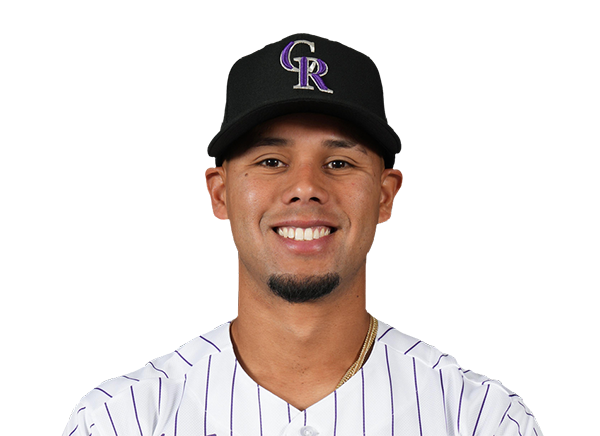 Ezequiel Tovar | 2-4 | 4 | 2 | 2 | 1 | 1 | 0 | 0 | 22 | .218 | .264 | .347 |
Arizona Diamondbacks
| Player | IP | H | R | ER | BB | K | HR | PC-ST | ERA | PC |
|---|---|---|---|---|---|---|---|---|---|---|
 Merrill Kelly | 5.1 | 4 | 2 | 2 | 1 | 2 | 0 | 78-54 | 4.94 | 78 |
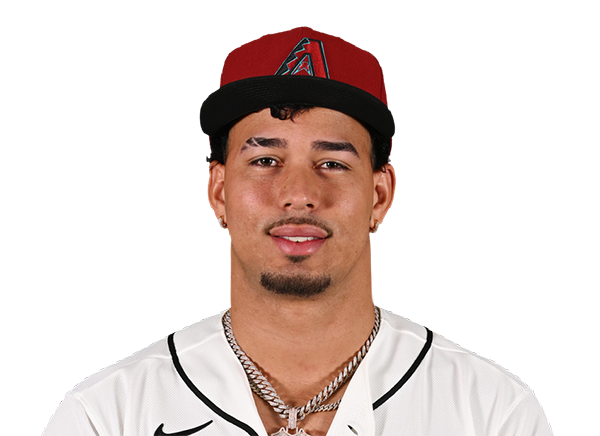 Justin Martinez | 0.2 | 0 | 0 | 0 | 0 | 1 | 0 | 8-4 | 0.00 | 8 |
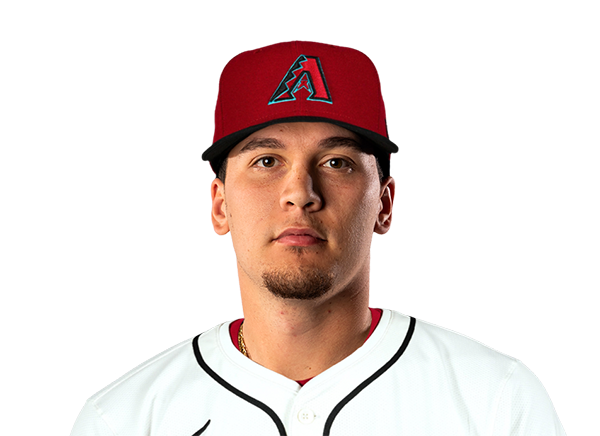 Brandyn Garcia | 1.1 | 1 | 1 | 1 | 0 | 2 | 1 | 18-12 | 1.97 | 18 |
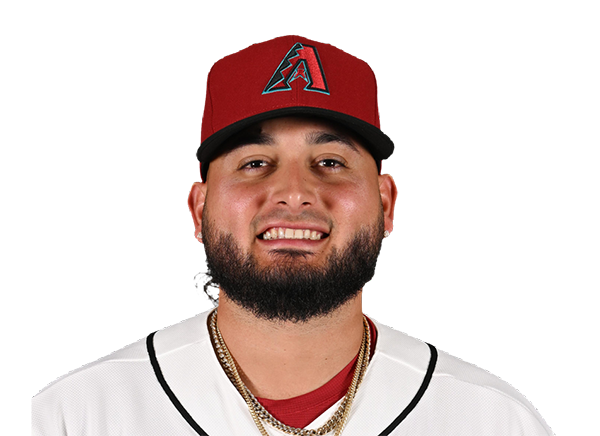 Juan Morillo | 0.2 | 1 | 0 | 0 | 0 | 0 | 0 | 6-4 | 2.13 | 6 |
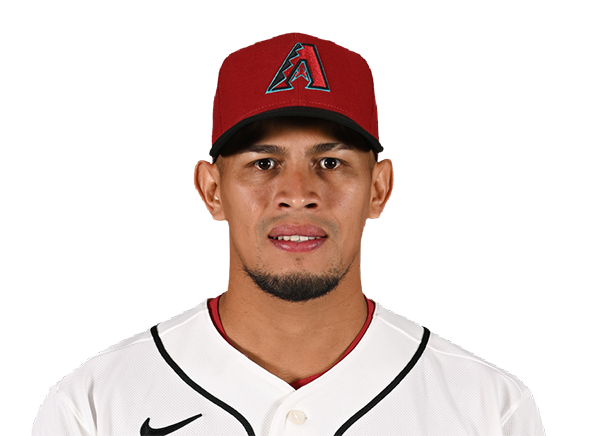 Jonathan Loaisiga | 1.0 | 1 | 0 | 0 | 1 | 0 | 0 | 16-10 | 2.22 | 16 |
Colorado Rockies
| Player | IP | H | R | ER | BB | K | HR | PC-ST | ERA | PC |
|---|---|---|---|---|---|---|---|---|---|---|
 Mason Adams | 6.0 | 5 | 4 | 0 | 0 | 8 | 0 | 80-59 | 4.03 | 80 |
|
Mark Manfredi | 2.0 | 3 | 1 | 1 | 0 | 1 | 1 | 25-18 | 3.45 | 25 |
 Jaden Hill | 1.0 | 0 | 0 | 0 | 0 | 1 | 0 | 10-7 | 5.35 | 10 |
H2H / Season Series
COL3–5
ARI
COL2–7
ARI
ARI4–6
COL
ARI2–3
COL
ARI9–0
COL
ARI9–1
COL
ARI5–4
COL
ARI2–3
COL
ARI2–1
COL
COL6–8
ARI
Last 5 Games
| Date | Opponent | Result |
|---|---|---|
| Sep 23 | @ COL | W5–3 |
| Sep 22 | @ COL | W7–2 |
| Sep 20 |  vs NYY | W8–4 |
| Sep 19 | vs NYY | W5–3 |
| Sep 18 | vs NYY | L2–9 |
| Date | Opponent | Result |
|---|---|---|
| Sep 23 | vs ARI | L3–5 |
| Sep 22 | vs ARI | L2–7 |
| Sep 20 |  vs SEA | L1–2 |
| Sep 19 | vs SEA | W5–3 |
| Sep 18 | vs SEA | L4–5 |
Standings
American League
| Team | W | L | PCT | GB | DIFF | STRK |
|---|---|---|---|---|---|---|
1 Rays | 96 | 62 | .608 | - | +79 | L1 |
2 Guardians | 82 | 76 | .519 | 14 | +2 | L1 |
3 Astros | 78 | 80 | .494 | 18 | -53 | L1 |
| 4Yankees | 91 | 67 | .576 | 5 | +141 | W1 |
5 Red Sox | 85 | 73 | .538 | 11 | +80 | W1 |
6 White Sox | 81 | 77 | .513 | 15 | +44 | L1 |
7 Rangers | 78 | 80 | .494 | 18 | -42 | L3 |
8 Orioles | 78 | 81 | .491 | 18.5 | -26 | W3 |
9 Blue Jays | 77 | 82 | .484 | 19.5 | -47 | L3 |
10 Twins | 75 | 84 | .472 | 21.5 | -64 | W2 |
| 11Mariners | 74 | 84 | .468 | 22 | -62 | W1 |
12 Tigers | 74 | 85 | .465 | 22.5 | +71 | L2 |
13 Royals | 68 | 90 | .430 | 28 | -104 | W1 |
14 Athletics | 63 | 95 | .399 | 33 | -217 | W2 |
15 Angels | 60 | 98 | .380 | 36 | -93 | L3 |
National League
| Team | W | L | PCT | GB | DIFF | STRK |
|---|---|---|---|---|---|---|
1 Brewers | 99 | 59 | .627 | - | +203 | W1 |
2 Dodgers | 97 | 61 | .614 | 2 | +196 | L1 |
3 Braves | 93 | 65 | .589 | 6 | +117 | W1 |
4 Padres | 88 | 70 | .557 | 11 | +38 | W1 |
5 Cubs | 87 | 71 | .551 | 12 | +145 | L2 |
6 Phillies | 87 | 71 | .551 | 12 | +28 | L1 |
| 7Diamondbacks | 84 | 74 | .532 | 15 | +6 | W4 |
8 Pirates | 80 | 78 | .506 | 19 | +27 | L1 |
9 Marlins | 78 | 80 | .494 | 21 | +4 | W2 |
10 Cardinals | 77 | 81 | .487 | 22 | -21 | W1 |
11 Nationals | 75 | 84 | .472 | 24.5 | +9 | W2 |
12 Reds | 73 | 85 | .462 | 26 | -160 | L1 |
13 Mets | 73 | 85 | .462 | 26 | -33 | W2 |
14 Giants | 65 | 94 | .409 | 34.5 | -84 | L2 |
| 15Rockies | 57 | 101 | .361 | 42 | -184 | L3 |
ARI
VS
COL
Pitchers
Merrill Kelly
Catchers
Gabriel Moreno
Infielders
Ketel Marte
Geraldo Perdomo
Pavin Smith
Nolan Arenado
Outfielders
Lars Nootbaar
Corbin Carroll
Tim Tawa
Designated Hitters
Jesus Sanchez
Pitchers
Mason Adams
Catchers
Hunter Goodman
Infielders
TJ Rumfield
Kyle Karros
Adael Amador
Ezequiel Tovar
Outfielders
Cole Carrigg
Mickey Moniak
Zac Veen
Designated Hitters
Jake McCarthy
Diamondbacks
VS
Rockies
Batting
158
Team Games Played
158
5305
At Bats
5376
1297
Hits
1361
674
Runs Batted In
701
159
Home Runs
172
102
Stolen Bases
109
.244
Batting Average
.253
705
Runs
732
263
Doubles
275
39
Triples
39
2115
Total Bases
2230
521
Walks
492
1168
Strikeouts
1373
.316
On Base Percentage
.322
.399
Slugging Percentage
.415
.714
OBP Pct + SLG Pct
.737
158
Games Played
158
158
Games Started
158
55
Hit By Pitch
80
0.0
Wins Above Replacement
0.0
0.0
Offensive Wins Above Replacement
0.0
26
Caught Stealing
41
1
Is Qualified
1
686.7
Runs Created
731.7
4.4
Runs Created Per 27 Outs
4.7
.087
Walks Per Plate Appearance
.082
0.45
Walk To Strikeout Ratio
0.36
.154
Isolated Power
.162
.267
Secondary Average
.266
3.94
Pitches Per Plate Appearance
3.74
461
Extra Base Hits
486
5978
Plate Appearances
6020
33.4
At Bats Per Home Run
31.3
41
Sacrifice Hit
21
53
Sacrifice Flies
50
Pitching
158
Team Games Played
158
54
Quality Starts
24
84
Wins
57
74
Losses
101
38
Saves
33
84
Holds
60
1317
Hits
1591
638
Earned runs
856
180
Home Runs
217
470
Walks
521
1110
Strikeouts
1085
7.1
Strikeouts Per 9 Innings
7.0
141.8
Pitches Per Start
149.4
1.27
Walks Plus Hits Per Inning Pitched
1.52
4.08
Earned Run Average
5.55
74
Losses
101
1408.0
Innings pitched
1387.2
.532
Win Percentage
.361
56
Save Opportunities
58
.247
Opponent Batting Average
.288
.313
Opponent's On-base pct.
.351
.408
Opponent's Slugging pct.
.489
.721
Opponent's OPB Pct + SLG Pct
.840
5334
At Bats
5525
257
Doubles
352
31
Triples
53
65
Batters Hit
60
94
Stolen Bases
127
158
Games Played
158
1
Complete Games
1
10
Shutouts
1
31
Wild Pitches
45
679
Runs Batted In
879
5
Balks
5
1408.0
Innings pitched
1387.2
7.1
Strikeouts Per 9 Innings
7.0
22
Caught Stealing
29
158
Games Started
158
0.0
Wins Above Replacement
0.0
1
Is Qualified
1
699
Runs
916
638
Earned Runs
856
2176
Total Bases
2700
Fielding
158
Team Games Played
158
1408
Full Innings
1388
5652
Total Chances
5582
4224
Putouts
4163
1364
Assists
1322
64
Errors
97
263
Double Plays
275
0.989
Fielding Percentage
0.983
35.7
Range Factor
35.6
0.0
Zone Rating
0.0
158
Games Played
158
0
Games Started
0
0.0
Defensive Wins Above Replacement
0.0
1
Qualified
1