

Dodgers vs Angels Live Score (17 May, 2026)
Game Information
Stage
Standard
Season
2026
First Pitch
Sat, May 16, 9:38 pm
Venue
Angel Stadium
Location
Anaheim, California
Attendance
44,841
Live Situation
2Balls
3Strikes
0Outs
—Pitcher
—At Bat
Pitch Sequence
1
BALL
Four-seam FB
90 MPH
2
STRIKE FOUL
Four-seam FB
86 MPH
3
BALL
Sweeper
77 MPH
4
STRIKE SWINGING
Changeup
82 MPH
5
STRIKE LOOKING
Slider
83 MPH
Injury Report
Team Stats
 LAD
LAA


15
Runs
2
10
Hits
8
0
Errors
2
1
Home Runs
0
9
Walks
4
9
Strikeouts
7
Player Box Score
Los Angeles Dodgers
| Player | H-AB | AB | R | H | RBI | HR | BB | K | #P | AVG | OBP | SLG |
|---|---|---|---|---|---|---|---|---|---|---|---|---|
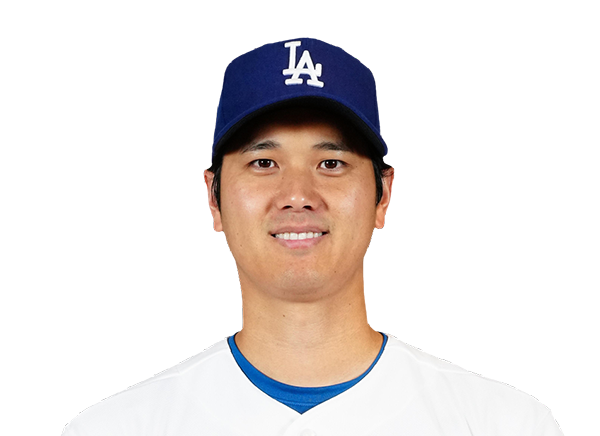 Shohei Ohtani | 2-4 | 4 | 2 | 2 | 5 | 0 | 2 | 0 | 24 | .247 | .379 | .449 |
 Mookie Betts | 2-4 | 4 | 2 | 2 | 1 | 1 | 1 | 0 | 25 | .180 | .255 | .440 |
 Santiago Espinal | 1-1 | 1 | 0 | 1 | 0 | 0 | 0 | 0 | 2 | .216 | .216 | .351 |
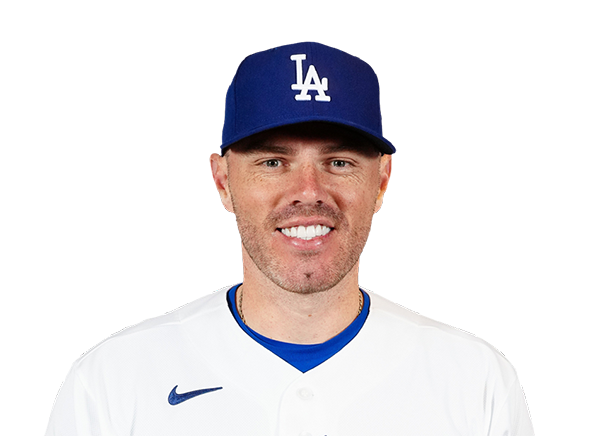 Freddie Freeman | 0-4 | 4 | 1 | 0 | 0 | 0 | 1 | 1 | 21 | .263 | .339 | .413 |
 Dalton Rushing | 0-1 | 1 | 0 | 0 | 0 | 0 | 0 | 0 | 3 | .268 | .342 | .592 |
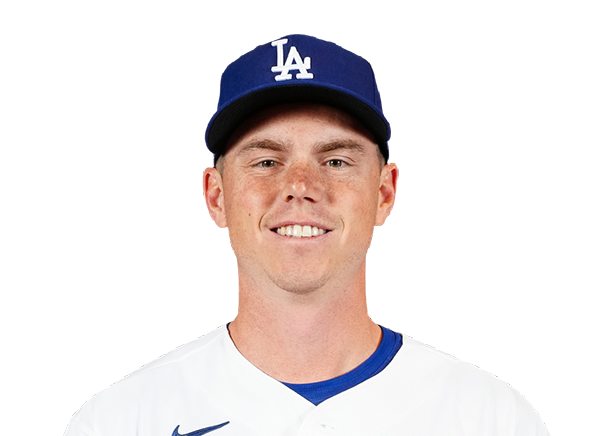 Will Smith | 1-2 | 2 | 2 | 1 | 1 | 0 | 1 | 1 | 19 | .262 | .336 | .377 |
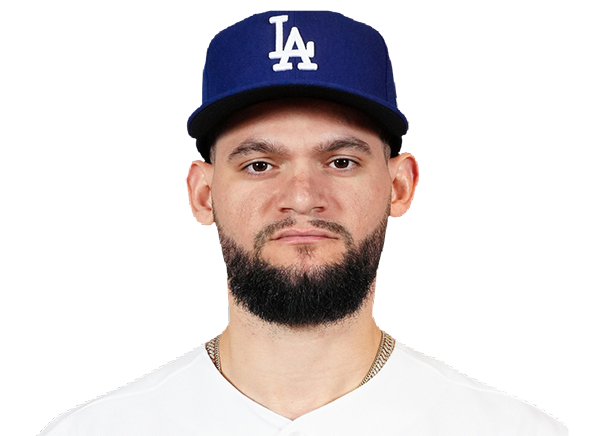 Andy Pages | 1-4 | 4 | 2 | 1 | 1 | 0 | 1 | 2 | 22 | .304 | .357 | .530 |
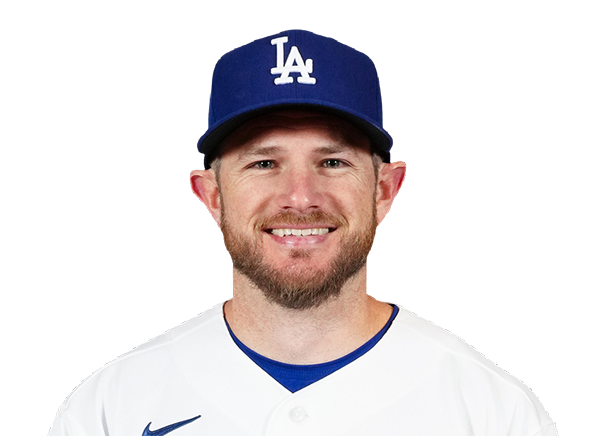 Max Muncy | 1-4 | 4 | 3 | 1 | 1 | 0 | 1 | 1 | 15 | .274 | .373 | .555 |
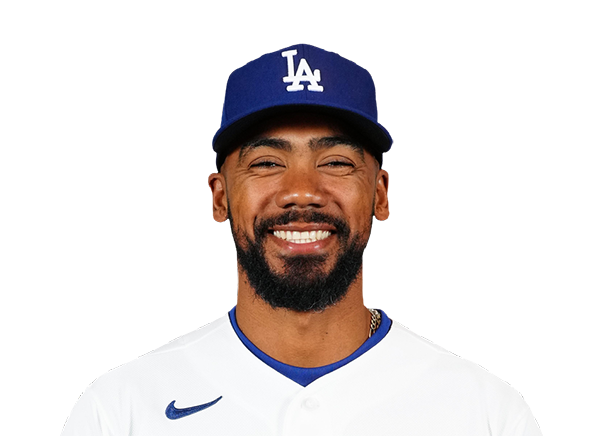 Teoscar Hernandez | 1-4 | 4 | 1 | 1 | 2 | 0 | 0 | 1 | 22 | .268 | .341 | .416 |
 Alex Call | 1-4 | 4 | 1 | 1 | 2 | 0 | 1 | 1 | 19 | .304 | .431 | .391 |
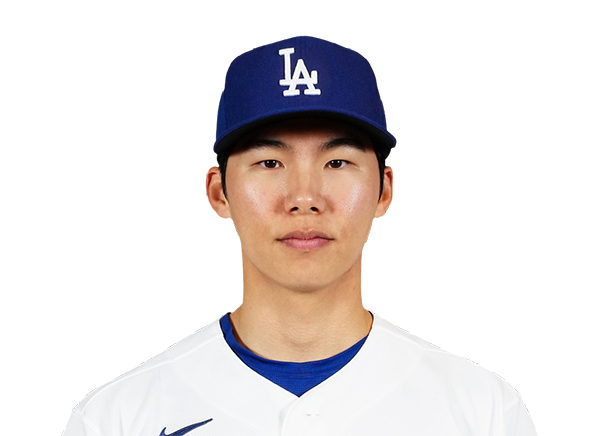 Hyeseong Kim | 0-4 | 4 | 1 | 0 | 0 | 0 | 1 | 2 | 22 | .261 | .324 | .348 |
Los Angeles Angels
| Player | H-AB | AB | R | H | RBI | HR | BB | K | #P | AVG | OBP | SLG |
|---|---|---|---|---|---|---|---|---|---|---|---|---|
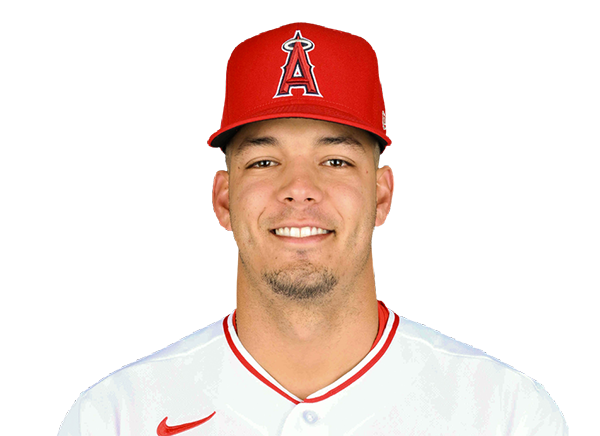 Vaughn Grissom | 1-5 | 5 | 0 | 1 | 0 | 0 | 0 | 0 | 15 | .247 | .330 | .395 |
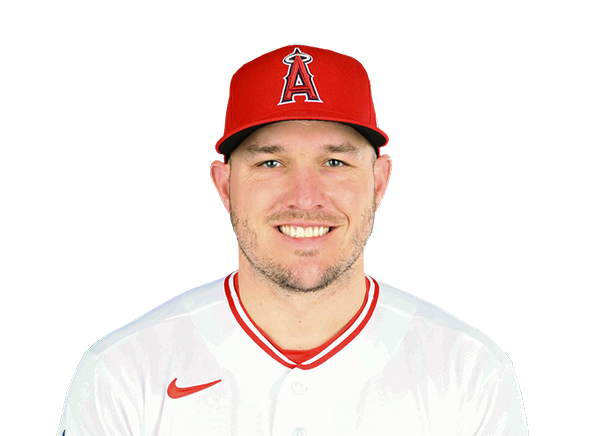 Mike Trout | 0-4 | 4 | 0 | 0 | 0 | 0 | 1 | 1 | 24 | .238 | .402 | .481 |
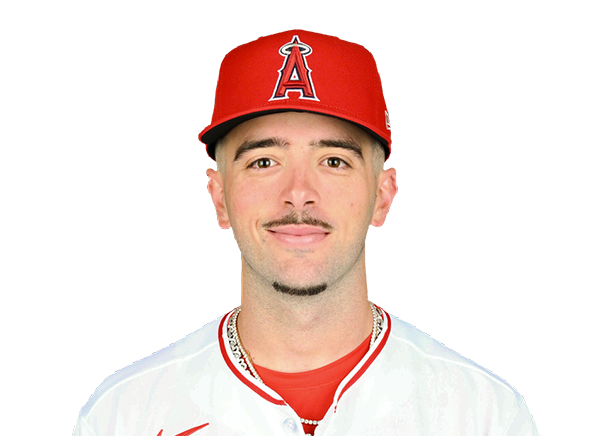 Zach Neto | 1-5 | 5 | 1 | 1 | 0 | 0 | 0 | 2 | 17 | .228 | .340 | .406 |
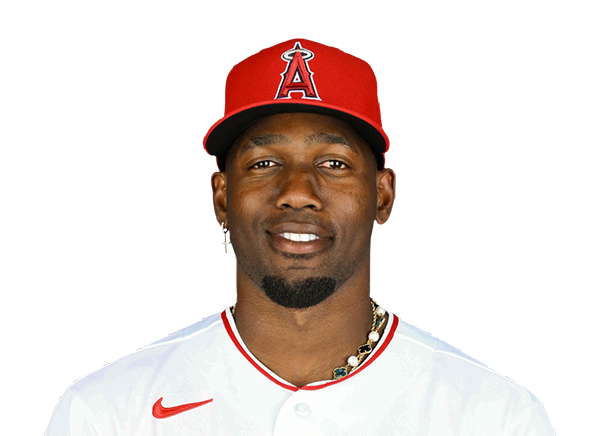 Jorge Soler | 2-3 | 3 | 1 | 2 | 0 | 0 | 1 | 1 | 17 | .224 | .320 | .441 |
 Jo Adell | 1-2 | 2 | 0 | 1 | 2 | 0 | 2 | 1 | 22 | .266 | .313 | .401 |
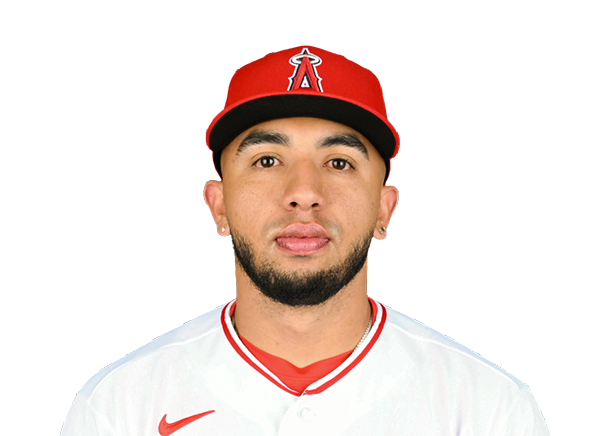 Oswald Peraza | 0-4 | 4 | 0 | 0 | 0 | 0 | 0 | 1 | 16 | .263 | .326 | .449 |
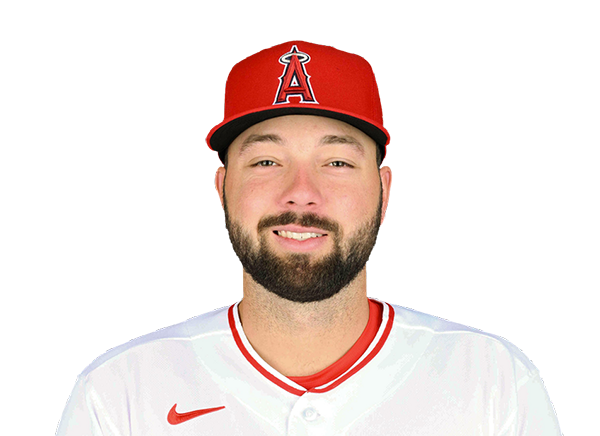 Nolan Schanuel | 0-4 | 4 | 0 | 0 | 0 | 0 | 0 | 0 | 14 | .250 | .302 | .366 |
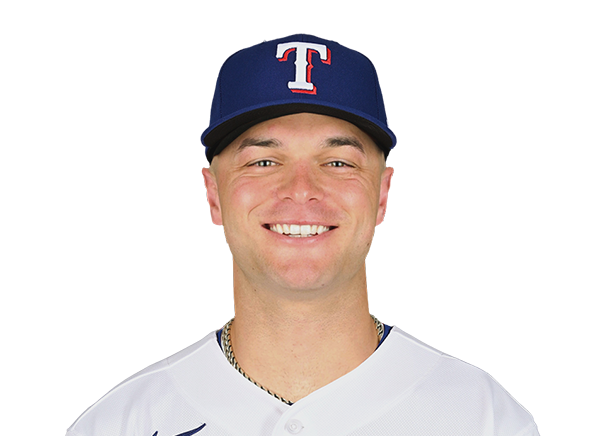 Logan O'Hoppe | 1-4 | 4 | 0 | 1 | 0 | 0 | 0 | 0 | 16 | .202 | .313 | .250 |
 Jose Siri | 1-2 | 2 | 0 | 1 | 0 | 0 | 0 | 0 | 5 | .500 | .500 | .500 |
 Josh Lowe | 1-2 | 2 | 0 | 1 | 0 | 0 | 0 | 1 | 5 | .173 | .220 | .291 |
Los Angeles Dodgers
| Player | IP | H | R | ER | BB | K | HR | PC-ST | ERA | PC |
|---|---|---|---|---|---|---|---|---|---|---|
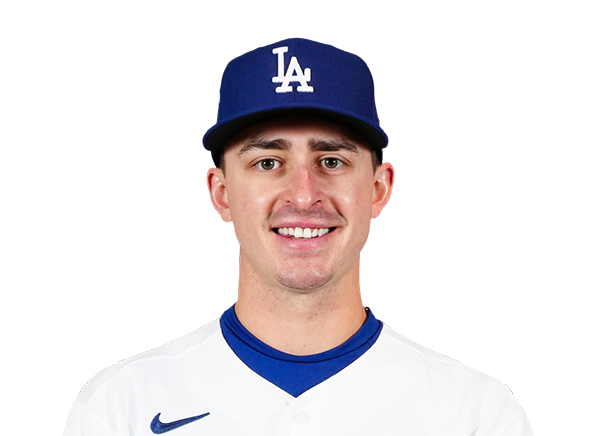 Justin Wrobleski | 6.0 | 7 | 2 | 2 | 1 | 5 | 0 | 103-67 | 2.49 | 103 |
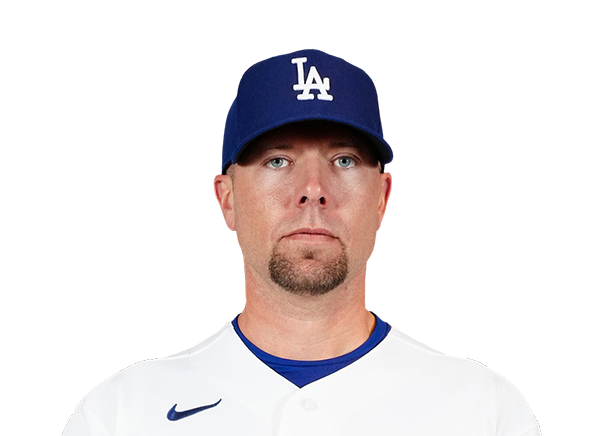 Blake Treinen | 1.0 | 0 | 0 | 0 | 1 | 1 | 0 | 17-11 | 3.68 | 17 |
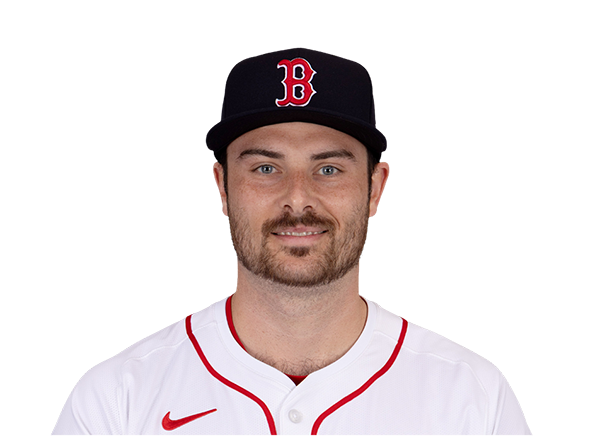 Wyatt Mills | 1.0 | 0 | 0 | 0 | 2 | 0 | 0 | 19-8 | 8.10 | 19 |
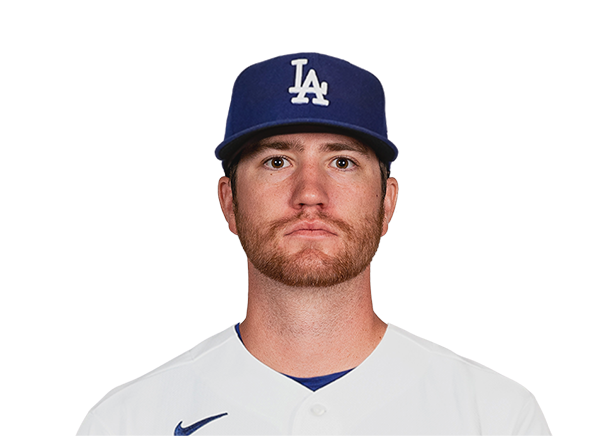 Charlie Barnes | 1.0 | 1 | 0 | 0 | 0 | 1 | 0 | 12-8 | 5.40 | 12 |
Los Angeles Angels
| Player | IP | H | R | ER | BB | K | HR | PC-ST | ERA | PC |
|---|---|---|---|---|---|---|---|---|---|---|
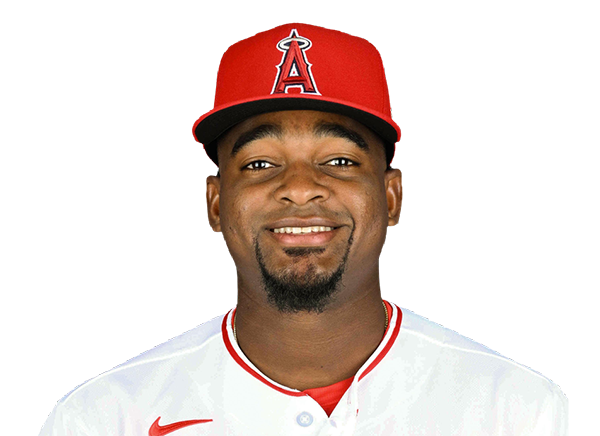 Jose Soriano | 5.1 | 1 | 6 | 6 | 6 | 6 | 0 | 92-48 | 2.41 | 92 |
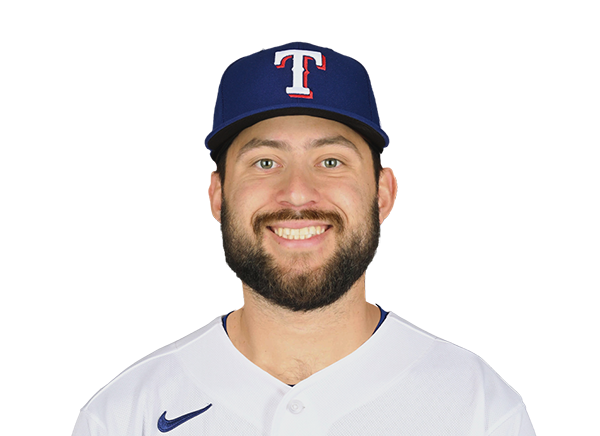 Chase Silseth | 0.2 | 1 | 0 | 0 | 0 | 0 | 0 | 15-9 | 2.40 | 15 |
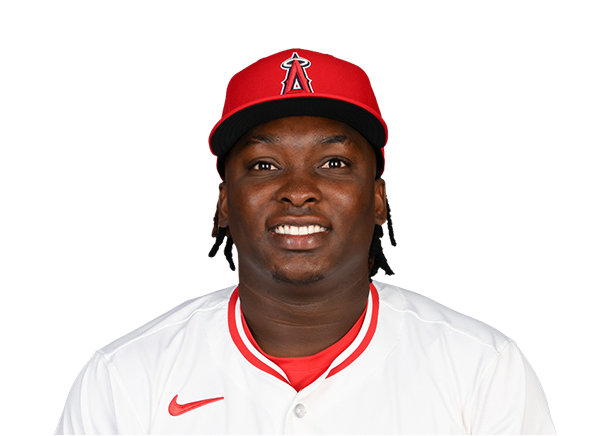 Jose Fermin | 1.0 | 1 | 0 | 0 | 0 | 1 | 0 | 23-16 | 4.15 | 23 |
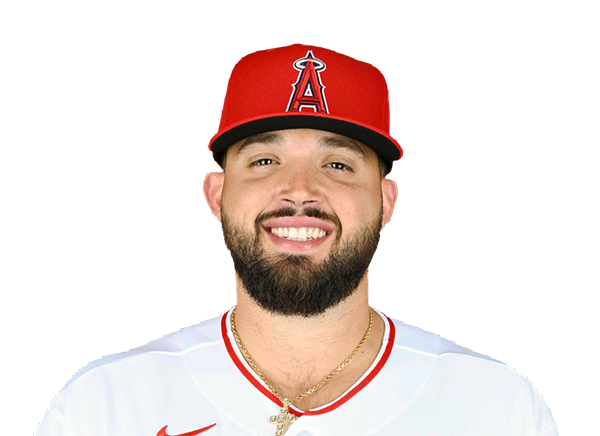 Alek Manoah | 1.1 | 6 | 9 | 8 | 3 | 2 | 1 | 59-33 | 9.82 | 59 |
 Adam Frazier | 0.2 | 1 | 0 | 0 | 0 | 0 | 0 | 5-3 | 18.00 | 5 |
H2H / Season Series
LAD5–13
LAA
LAD9–2
LAA
LAD1–0
LAA
LAA1–10
LAD
LAA2–15
LAD
LAA0–6
LAD
LAD0–3
LAA
LAD7–7
LAA
LAA5–13
LAD
LAD4–3
LAA
Last 5 Games
| Date | Opponent | Result |
|---|---|---|
| Aug 23 |  vs PIT | W4–0 |
| Aug 22 | vs PIT | W4–3 |
| Aug 21 | vs PIT | W5–4 |
| Aug 19 |  @ COL | W6–4 |
| Aug 18 | @ COL | W7–6 |
| Date | Opponent | Result |
|---|---|---|
| Aug 23 |  @ TEX | L3–5 |
| Aug 22 | @ TEX | W3–0 |
| Aug 21 | @ TEX | L1–2 |
| Aug 20 |  @ HOU | W18–3 |
| Aug 19 | @ HOU | L2–3 |
Standings
American League
| Team | W | L | PCT | GB | DIFF | STRK |
|---|---|---|---|---|---|---|
1 Rays | 77 | 53 | .592 | - | +44 | W1 |
2 White Sox | 68 | 62 | .523 | 9 | +43 | W1 |
| 3Astros | 65 | 66 | .496 | 12.5 | -44 | L2 |
4 Yankees | 74 | 56 | .569 | 3 | +100 | W1 |
5 Red Sox | 71 | 59 | .546 | 6 | +99 | W3 |
| 6Rangers | 65 | 66 | .496 | 12.5 | -46 | W1 |
7 Guardians | 65 | 66 | .496 | 12.5 | -9 | W4 |
8 Blue Jays | 64 | 68 | .485 | 14 | -55 | L1 |
9 Twins | 63 | 68 | .481 | 14.5 | -54 | L3 |
10 Orioles | 63 | 68 | .481 | 14.5 | -35 | L1 |
11 Mariners | 62 | 69 | .473 | 15.5 | -61 | L1 |
12 Tigers | 61 | 69 | .469 | 16 | +73 | L5 |
13 Royals | 58 | 74 | .439 | 20 | -91 | W8 |
| 14Angels | 52 | 79 | .397 | 25.5 | -70 | L1 |
15 Athletics | 51 | 80 | .389 | 26.5 | -187 | W2 |
National League
| Team | W | L | PCT | GB | DIFF | STRK |
|---|---|---|---|---|---|---|
1 Brewers | 81 | 49 | .623 | - | +163 | W3 |
| 2Dodgers | 80 | 51 | .611 | 1.5 | +151 | W6 |
3 Braves | 75 | 55 | .577 | 6 | +108 | L2 |
4 Cubs | 75 | 56 | .573 | 6.5 | +115 | W1 |
5 Phillies | 73 | 58 | .557 | 8.5 | +27 | W9 |
6 Padres | 71 | 60 | .542 | 10.5 | +16 | W3 |
7 Diamondbacks | 69 | 62 | .527 | 12.5 | +9 | W1 |
8 Marlins | 67 | 64 | .511 | 14.5 | +21 | W3 |
9 Cardinals | 66 | 66 | .500 | 16 | -2 | L3 |
| 10Pirates | 63 | 69 | .477 | 19 | +25 | L3 |
11 Reds | 62 | 69 | .473 | 19.5 | -94 | L1 |
12 Nationals | 61 | 71 | .462 | 21 | +10 | L4 |
13 Mets | 59 | 72 | .450 | 22.5 | -40 | L1 |
14 Giants | 52 | 78 | .400 | 29 | -80 | L4 |
| 15Rockies | 50 | 80 | .385 | 31 | -136 | L6 |
LAD
VS
LAA
Pitchers
Justin Wrobleski
Blake Treinen
Wyatt Mills
Charlie Barnes
Catchers
Will Smith
Infielders
Mookie Betts
Santiago Espinal
Freddie Freeman
Dalton Rushing
Max Muncy
Hyeseong Kim
Outfielders
Andy Pages
Teoscar Hernandez
Alex Call
Designated Hitters
Shohei Ohtani
Pitchers
Jose Soriano
Chase Silseth
Jose Fermin
Alek Manoah
Adam Frazier
Catchers
Logan O'Hoppe
Infielders
Vaughn Grissom
Zach Neto
Oswald Peraza
Nolan Schanuel
Outfielders
Mike Trout
Jo Adell
Jose Siri
Josh Lowe
Designated Hitters
Jorge Soler
Dodgers
VS
Angels
Batting
131
Team Games Played
131
4414
At Bats
4384
1140
Hits
1036
617
Runs Batted In
518
167
Home Runs
129
52
Stolen Bases
72
.258
Batting Average
.236
653
Runs
537
213
Doubles
200
14
Triples
12
1882
Total Bases
1647
485
Walks
407
1030
Strikeouts
1236
.335
On Base Percentage
.310
.426
Slugging Percentage
.376
.761
OBP Pct + SLG Pct
.686
131
Games Played
131
0
Games Started
0
46
Hit By Pitch
72
0.0
Wins Above Replacement
0.0
0.0
Offensive Wins Above Replacement
0.0
18
Caught Stealing
22
1
Is Qualified
1
632.9
Runs Created
514.2
4.9
Runs Created Per 27 Outs
4.0
.097
Walks Per Plate Appearance
.083
0.47
Walk To Strikeout Ratio
0.33
.168
Isolated Power
.139
.286
Secondary Average
.244
3.93
Pitches Per Plate Appearance
3.90
394
Extra Base Hits
341
5002
Plate Appearances
4910
26.4
At Bats Per Home Run
34.0
12
Sacrifice Hit
20
42
Sacrifice Flies
25
Pitching
131
Team Games Played
131
70
Quality Starts
41
80
Wins
52
51
Losses
79
37
Saves
21
86
Holds
70
936
Hits
1006
473
Earned runs
548
148
Home Runs
139
408
Walks
536
1193
Strikeouts
1176
9.3
Strikeouts Per 9 Innings
9.2
0.0
Pitches Per Start
0.0
1.16
Walks Plus Hits Per Inning Pitched
1.34
3.67
Earned Run Average
4.27
51
Losses
79
1160.2
Innings pitched
1154.0
.611
Win Percentage
.397
56
Save Opportunities
43
.217
Opponent Batting Average
.232
.292
Opponent's On-base pct.
.324
.369
Opponent's Slugging pct.
.378
.661
Opponent's OPB Pct + SLG Pct
.702
4310
At Bats
4331
189
Doubles
181
11
Triples
17
56
Batters Hit
68
77
Stolen Bases
89
131
Games Played
131
1
Complete Games
0
0
Shutouts
0
30
Wild Pitches
54
0
Runs Batted In
0
6
Balks
3
1160.2
Innings pitched
1154.0
9.3
Strikeouts Per 9 Innings
9.2
20
Caught Stealing
24
131
Games Started
131
0.0
Wins Above Replacement
0.0
1
Is Qualified
1
502
Runs
607
473
Earned Runs
543
1591
Total Bases
1638
Fielding
131
Team Games Played
131
1161
Full Innings
1154
4594
Total Chances
4613
3482
Putouts
3462
1060
Assists
1075
52
Errors
76
213
Double Plays
200
0.989
Fielding Percentage
0.984
35.2
Range Factor
35.4
0.0
Zone Rating
0.0
131
Games Played
131
0
Games Started
0
0.0
Defensive Wins Above Replacement
0.0
1
Qualified
1