

Dodgers vs Brewers Live Score (23 May, 2026)
Game Information
Stage
Standard
Season
2026
First Pitch
Sat, May 23, 7:15 pm
Venue
American Family Field
Location
Milwaukee, Wisconsin
Attendance
38,136
Live Situation
3Balls
3Strikes
0Outs
—Pitcher
—At Bat
Pitch Sequence
1
STRIKE LOOKING
Slider
87 MPH
2
STRIKE LOOKING
Slider
87 MPH
3
BALL
Slider
88 MPH
4
BALL
Slider
87 MPH
5
BALL
Sinker
96 MPH
6
STRIKE FOUL
Slider
86 MPH
7
STRIKE LOOKING
Sinker
96 MPH
Injury Report

Team Stats
 LAD
MIL


11
Runs
3
10
Hits
5
1
Errors
0
1
Home Runs
0
11
Walks
5
5
Strikeouts
11
Player Box Score
Los Angeles Dodgers
| Player | H-AB | AB | R | H | RBI | HR | BB | K | #P | AVG | OBP | SLG |
|---|---|---|---|---|---|---|---|---|---|---|---|---|
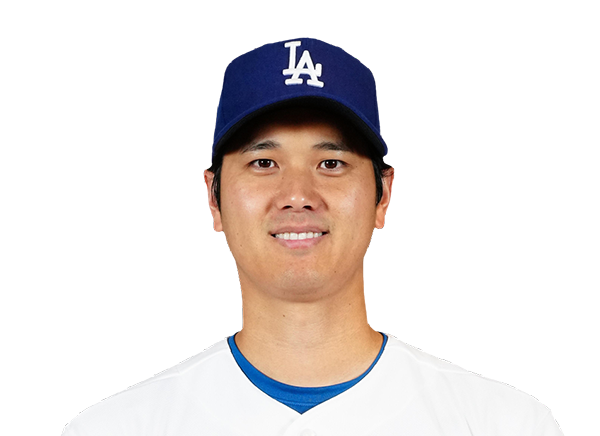 Shohei Ohtani | 2-5 | 5 | 0 | 2 | 1 | 0 | 1 | 2 | 26 | .276 | .402 | .481 |
 Mookie Betts | 0-6 | 6 | 0 | 0 | 0 | 0 | 0 | 1 | 27 | .169 | .244 | .366 |
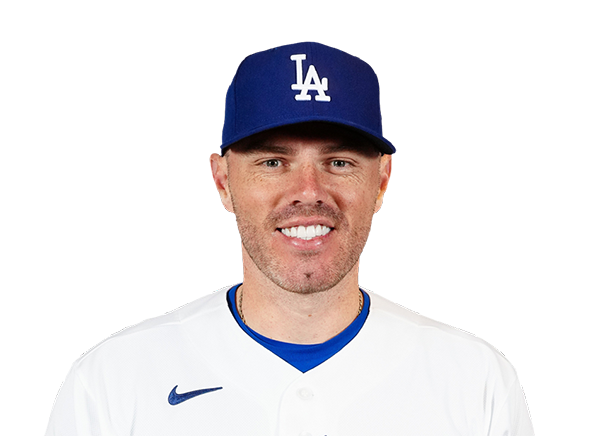 Freddie Freeman | 1-1 | 1 | 3 | 1 | 0 | 0 | 4 | 0 | 26 | .265 | .362 | .449 |
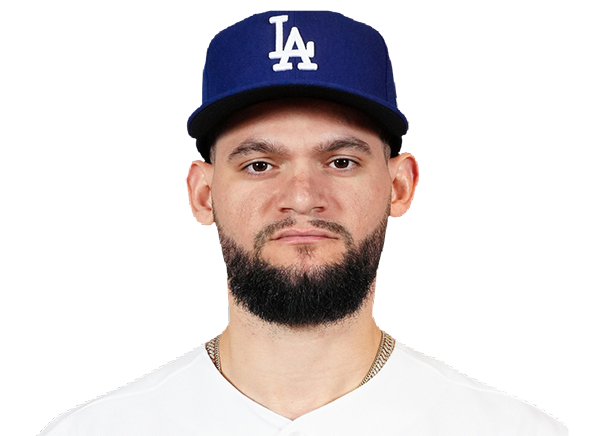 Andy Pages | 1-4 | 4 | 2 | 1 | 1 | 0 | 1 | 0 | 19 | .283 | .336 | .487 |
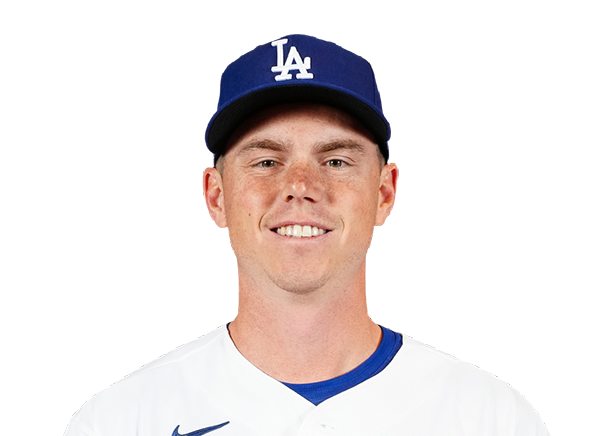 Will Smith | 1-4 | 4 | 1 | 1 | 1 | 0 | 1 | 0 | 23 | .247 | .319 | .349 |
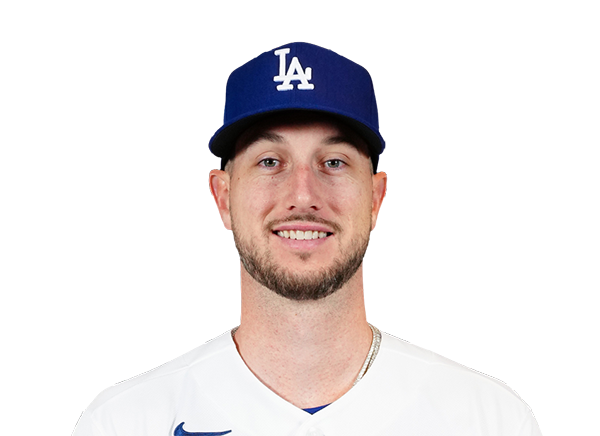 Kyle Tucker | 1-4 | 4 | 2 | 1 | 0 | 0 | 1 | 0 | 16 | .247 | .353 | .396 |
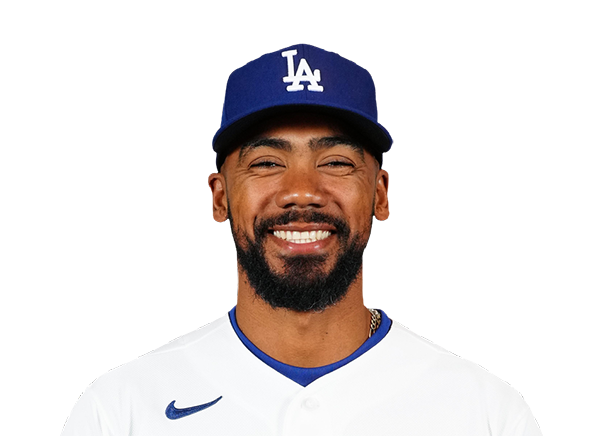 Teoscar Hernandez | 3-4 | 4 | 2 | 3 | 6 | 1 | 1 | 1 | 20 | .276 | .349 | .447 |
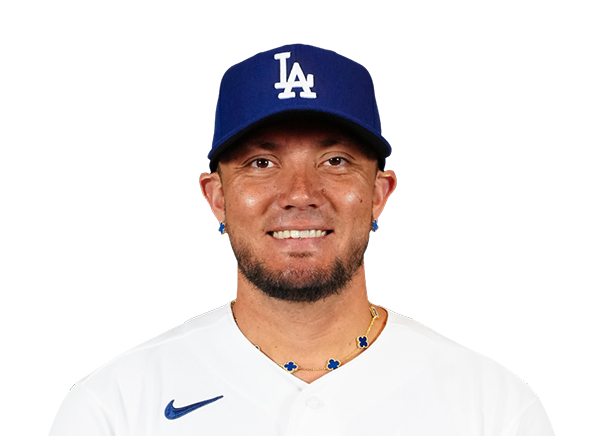 Miguel Rojas | 0-3 | 3 | 1 | 0 | 1 | 0 | 1 | 0 | 16 | .267 | .305 | .347 |
 Santiago Espinal | 1-4 | 4 | 0 | 1 | 1 | 0 | 1 | 1 | 20 | .220 | .238 | .366 |
Milwaukee Brewers
| Player | H-AB | AB | R | H | RBI | HR | BB | K | #P | AVG | OBP | SLG |
|---|---|---|---|---|---|---|---|---|---|---|---|---|
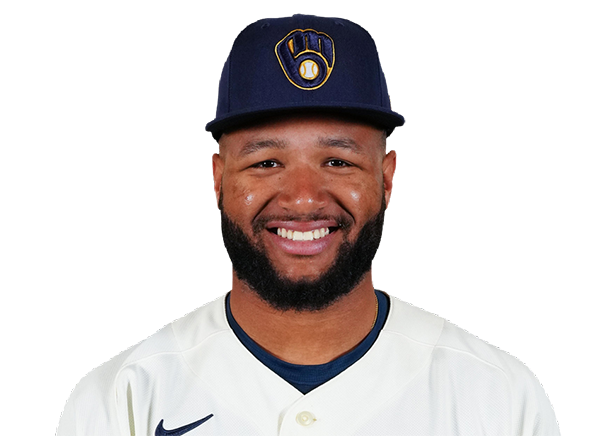 Jackson Chourio | 2-5 | 5 | 1 | 2 | 0 | 0 | 0 | 3 | 19 | .292 | .329 | .431 |
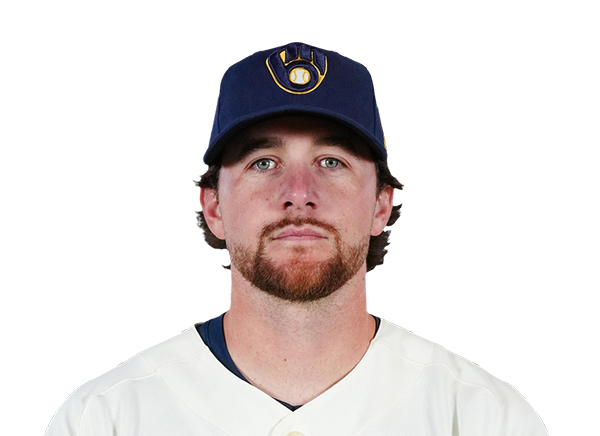 Brice Turang | 1-2 | 2 | 1 | 1 | 1 | 0 | 2 | 1 | 14 | .292 | .416 | .491 |
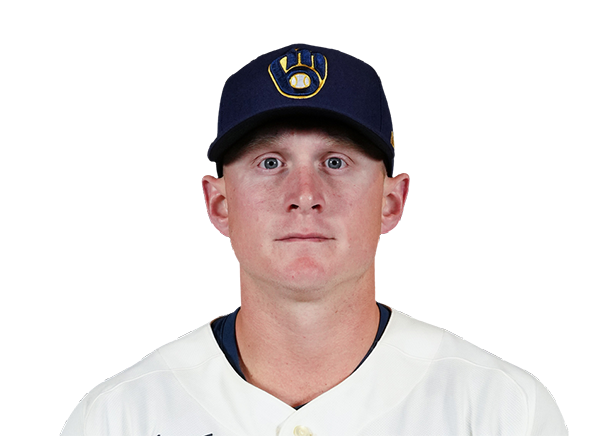 Andrew Vaughn | 0-4 | 4 | 0 | 0 | 0 | 0 | 0 | 0 | 15 | .302 | .412 | .465 |
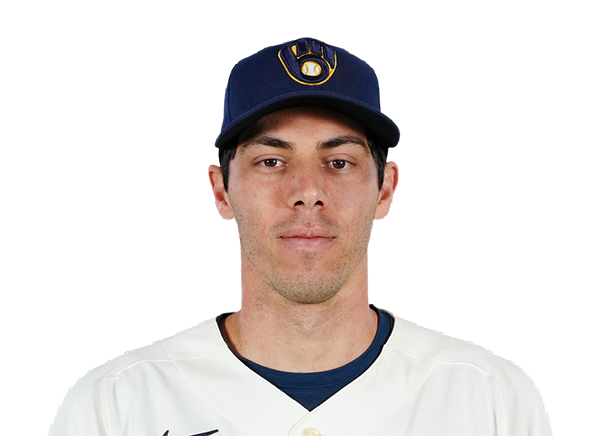 Christian Yelich | 0-3 | 3 | 1 | 0 | 0 | 0 | 1 | 2 | 22 | .250 | .318 | .438 |
 Gary Sanchez | 1-3 | 3 | 0 | 1 | 0 | 0 | 1 | 1 | 16 | .202 | .366 | .427 |
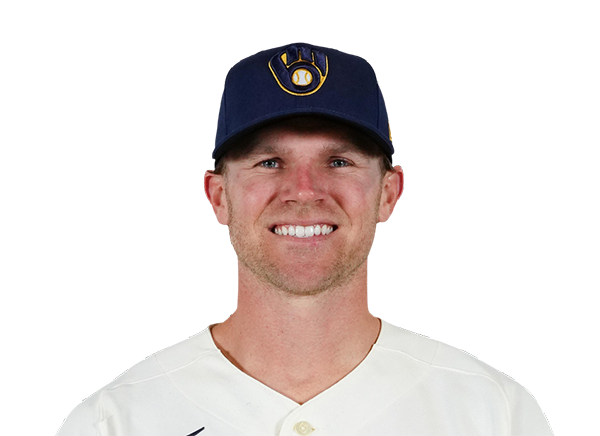 Jake Bauers | 0-4 | 4 | 0 | 0 | 0 | 0 | 0 | 3 | 21 | .282 | .349 | .481 |
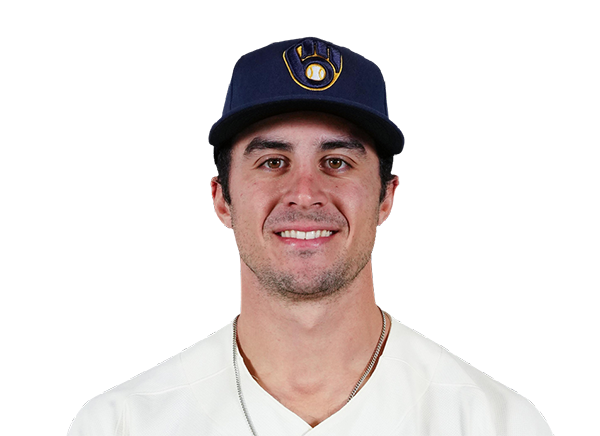 Sal Frelick | 1-3 | 3 | 0 | 1 | 1 | 0 | 0 | 0 | 18 | .222 | .292 | .304 |
 Blake Perkins | 0-1 | 1 | 0 | 0 | 0 | 0 | 0 | 1 | 5 | .103 | .200 | .155 |
 Joey Ortiz | 0-3 | 3 | 0 | 0 | 0 | 0 | 1 | 0 | 20 | .189 | .290 | .236 |
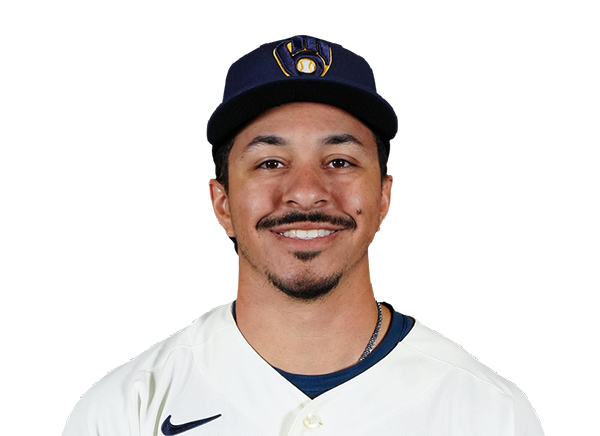 David Hamilton | 0-3 | 3 | 0 | 0 | 0 | 0 | 0 | 0 | 6 | .241 | .336 | .277 |
Los Angeles Dodgers
| Player | IP | H | R | ER | BB | K | HR | PC-ST | ERA | PC |
|---|---|---|---|---|---|---|---|---|---|---|
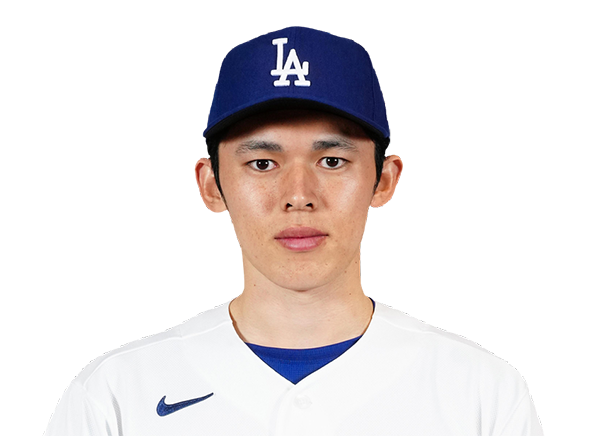 Roki Sasaki | 5.0 | 4 | 3 | 2 | 2 | 4 | 0 | 87-56 | 4.93 | 87 |
 Alex Vesia | 1.0 | 0 | 0 | 0 | 1 | 2 | 0 | 23-12 | 2.50 | 23 |
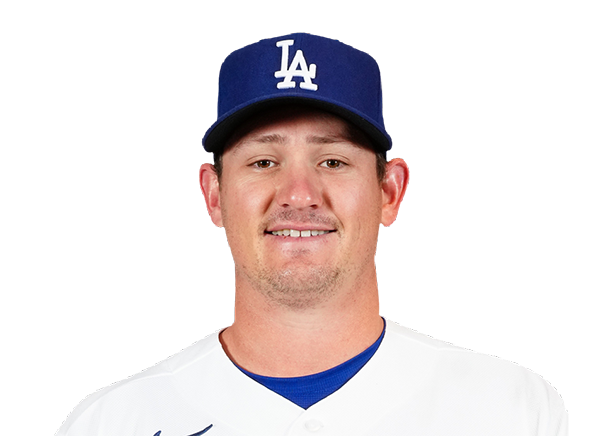 Kyle Hurt | 1.0 | 0 | 0 | 0 | 2 | 1 | 0 | 15-9 | 0.60 | 15 |
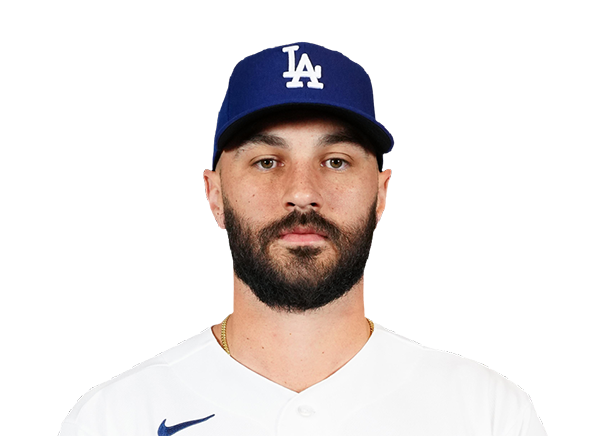 Tanner Scott | 1.0 | 1 | 0 | 0 | 0 | 3 | 0 | 17-11 | 1.31 | 17 |
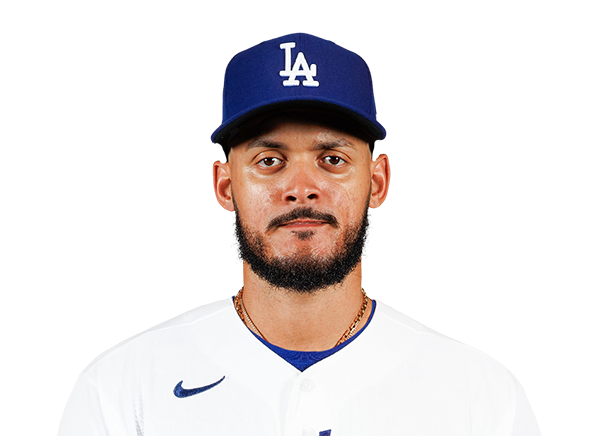 Jonathan Hernandez | 1.0 | 0 | 0 | 0 | 0 | 1 | 0 | 14-9 | 0.00 | 14 |
Milwaukee Brewers
| Player | IP | H | R | ER | BB | K | HR | PC-ST | ERA | PC |
|---|---|---|---|---|---|---|---|---|---|---|
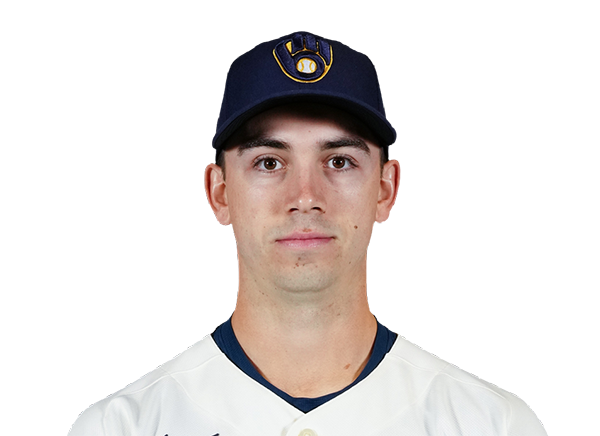 Robert Gasser | 4.1 | 4 | 4 | 4 | 4 | 4 | 1 | 89-53 | 6.48 | 89 |
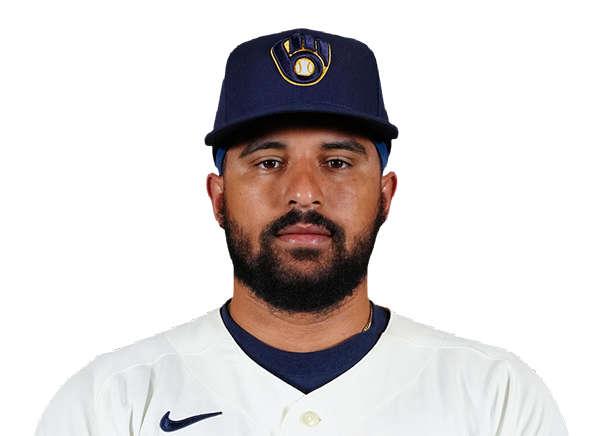 Grant Anderson | 1.2 | 0 | 0 | 0 | 1 | 0 | 0 | 26-12 | 2.95 | 26 |
 DL Hall | 1.1 | 2 | 3 | 3 | 2 | 0 | 0 | 29-15 | 2.55 | 29 |
 Jake Woodford | 1.2 | 4 | 4 | 4 | 4 | 1 | 0 | 49-26 | 6.16 | 49 |
H2H / Season Series
LAD2–6
MIL
LAD1–4
MIL
LAD3–1
MIL
LAD4–5
MIL
MIL1–5
LAD
MIL3–11
LAD
MIL5–1
LAD
LAD9–24
MIL
MIL3–4
LAD
Last 5 Games
| Date | Opponent | Result |
|---|---|---|
| Aug 21 |  vs PIT | W5–4 |
| Aug 19 |  @ COL | W6–4 |
| Aug 18 | @ COL | W7–6 |
| Aug 17 | @ COL | W11–5 |
| Aug 16 | vs MIL | L2–6 |
| Date | Opponent | Result |
|---|---|---|
| Aug 22 |  vs ATL | W4–1 |
| Aug 21 | vs ATL | W2–1 |
| Aug 20 |  vs SEA | W7–4 |
| Aug 19 | vs SEA | L5–7 |
| Aug 18 | vs SEA | W22–0 |
Standings
American League
| Team | W | L | PCT | GB | DIFF | STRK |
|---|---|---|---|---|---|---|
1 Rays | 76 | 52 | .594 | - | +43 | L2 |
2 White Sox | 67 | 61 | .523 | 9 | +47 | W1 |
3 Astros | 65 | 64 | .504 | 11.5 | -42 | W1 |
4 Yankees | 73 | 56 | .566 | 3.5 | +95 | L1 |
5 Red Sox | 69 | 59 | .539 | 7 | +97 | W1 |
6 Rangers | 64 | 65 | .496 | 12.5 | -45 | W2 |
7 Blue Jays | 64 | 67 | .489 | 13.5 | -50 | W1 |
8 Twins | 63 | 66 | .488 | 13.5 | -45 | L1 |
9 Guardians | 63 | 66 | .488 | 13.5 | -15 | W2 |
10 Orioles | 62 | 67 | .481 | 14.5 | -34 | W1 |
11 Tigers | 61 | 67 | .477 | 15 | +79 | L3 |
| 12Mariners | 61 | 68 | .473 | 15.5 | -45 | W1 |
13 Royals | 56 | 74 | .431 | 21 | -97 | W6 |
14 Angels | 51 | 78 | .395 | 25.5 | -71 | L1 |
15 Athletics | 49 | 80 | .380 | 27.5 | -189 | L5 |
National League
| Team | W | L | PCT | GB | DIFF | STRK |
|---|---|---|---|---|---|---|
| 1Brewers | 81 | 49 | .623 | - | +163 | W3 |
| 2Dodgers | 78 | 51 | .605 | 2.5 | +146 | W4 |
| 3Braves | 75 | 55 | .577 | 6 | +108 | L2 |
4 Cubs | 74 | 55 | .574 | 6.5 | +99 | L2 |
5 Phillies | 71 | 58 | .550 | 9.5 | +16 | W7 |
6 Padres | 69 | 60 | .535 | 11.5 | +7 | W1 |
7 Diamondbacks | 68 | 61 | .527 | 12.5 | +13 | W2 |
8 Marlins | 66 | 64 | .508 | 15 | +17 | W2 |
9 Cardinals | 66 | 64 | .508 | 15 | +9 | L1 |
| 10Pirates | 63 | 67 | .485 | 18 | +30 | L1 |
11 Reds | 61 | 68 | .473 | 19.5 | -98 | L2 |
12 Nationals | 61 | 70 | .466 | 20.5 | +14 | L3 |
13 Mets | 58 | 71 | .450 | 22.5 | -44 | L1 |
14 Giants | 52 | 76 | .406 | 28 | -78 | L2 |
| 15Rockies | 50 | 78 | .391 | 30 | -130 | L4 |
LAD
VS
MIL
Pitchers
Roki Sasaki
Alex Vesia
Kyle Hurt
Tanner Scott
Jonathan Hernandez
Catchers
Will Smith
Infielders
Mookie Betts
Freddie Freeman
Miguel Rojas
Santiago Espinal
Outfielders
Andy Pages
Kyle Tucker
Teoscar Hernandez
Designated Hitters
Shohei Ohtani
Pitchers
Robert Gasser
Grant Anderson
DL Hall
Jake Woodford
Catchers
Gary Sanchez
Infielders
Brice Turang
Andrew Vaughn
Joey Ortiz
David Hamilton
Outfielders
Jackson Chourio
Jake Bauers
Sal Frelick
Blake Perkins
Designated Hitters
Christian Yelich
Dodgers
VS
Brewers
Batting
129
Team Games Played
129
4354
At Bats
4361
1127
Hits
1104
610
Runs Batted In
605
167
Home Runs
119
50
Stolen Bases
129
.259
Batting Average
.253
645
Runs
644
211
Doubles
226
14
Triples
20
1867
Total Bases
1727
476
Walks
537
1014
Strikeouts
1084
.335
On Base Percentage
.337
.429
Slugging Percentage
.396
.764
OBP Pct + SLG Pct
.733
129
Games Played
129
129
Games Started
129
44
Hit By Pitch
32
0.0
Wins Above Replacement
0.0
0.0
Offensive Wins Above Replacement
0.0
18
Caught Stealing
41
1
Is Qualified
1
627.0
Runs Created
608.3
5.0
Runs Created Per 27 Outs
4.8
.097
Walks Per Plate Appearance
.107
0.47
Walk To Strikeout Ratio
0.50
.170
Isolated Power
.143
.287
Secondary Average
.286
3.93
Pitches Per Plate Appearance
4.00
392
Extra Base Hits
365
4931
Plate Appearances
5000
26.1
At Bats Per Home Run
36.6
12
Sacrifice Hit
29
42
Sacrifice Flies
34
Pitching
129
Team Games Played
129
68
Quality Starts
45
78
Wins
80
51
Losses
49
36
Saves
42
84
Holds
66
928
Hits
933
470
Earned runs
441
148
Home Runs
129
403
Walks
408
1168
Strikeouts
1253
9.2
Strikeouts Per 9 Innings
9.8
143.8
Pitches Per Start
145.2
1.16
Walks Plus Hits Per Inning Pitched
1.16
3.70
Earned Run Average
3.44
51
Losses
49
1142.2
Innings pitched
1153.1
.605
Win Percentage
.620
55
Save Opportunities
60
.218
Opponent Batting Average
.219
.293
Opponent's On-base pct.
.294
.372
Opponent's Slugging pct.
.357
.665
Opponent's OPB Pct + SLG Pct
.651
4249
At Bats
4257
188
Doubles
172
10
Triples
13
55
Batters Hit
52
76
Stolen Bases
55
129
Games Played
129
1
Complete Games
1
10
Shutouts
9
30
Wild Pitches
44
473
Runs Batted In
465
4
Balks
6
1142.2
Innings pitched
1153.1
9.2
Strikeouts Per 9 Innings
9.8
20
Caught Stealing
29
129
Games Started
129
0.0
Wins Above Replacement
0.0
1
Is Qualified
1
499
Runs
484
470
Earned Runs
441
1580
Total Bases
1518
Fielding
129
Team Games Played
129
1143
Full Innings
1153
4523
Total Chances
4522
3428
Putouts
3460
1043
Assists
1005
52
Errors
57
211
Double Plays
226
0.989
Fielding Percentage
0.987
35.2
Range Factor
34.8
0.0
Zone Rating
0.0
129
Games Played
129
0
Games Started
0
0.0
Defensive Wins Above Replacement
0.0
1
Qualified
1