

Dodgers vs Diamondbacks Live Score (9 Aug, 2026)
Game Information
Stage
Standard
Season
2026
First Pitch
Sun, Aug 9, 4:10 pm
Venue
Chase Field
Location
Phoenix, Arizona
Attendance
43,775
Home Runs
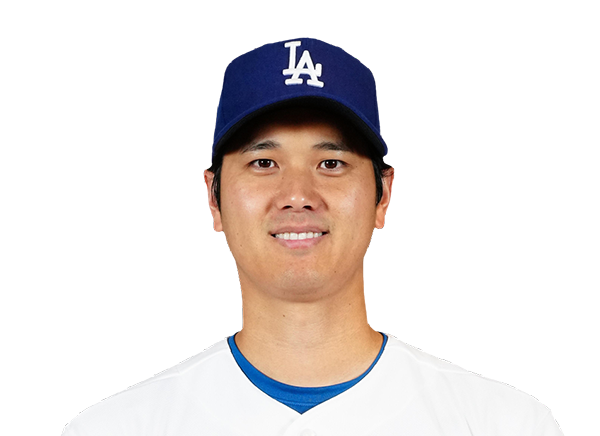
Shohei Ohtani
26 HR
.294 AVG
71 RBI
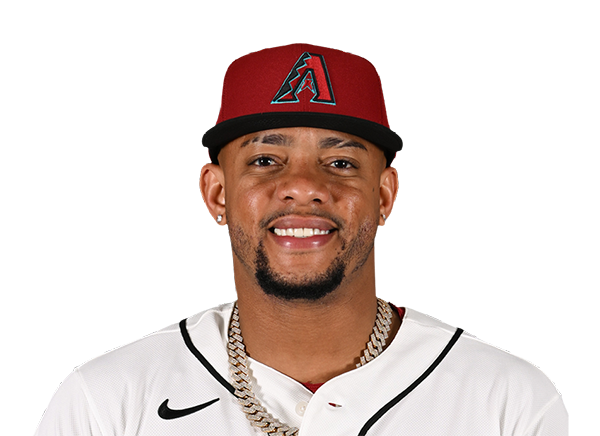
Ketel Marte
19 HR
.244 AVG
62 RBI
Batting Average
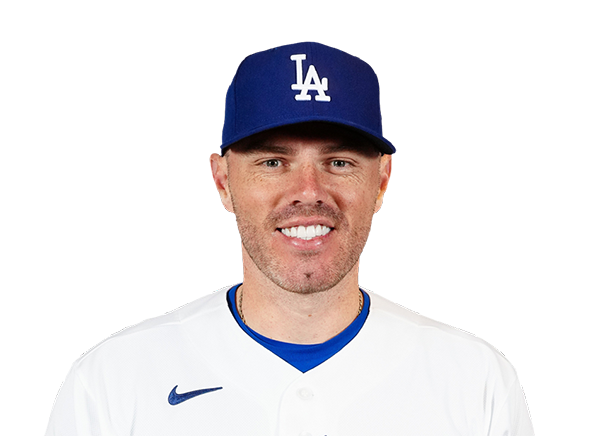
Freddie Freeman
.304 AVG
.378 OBP
.476 SLG
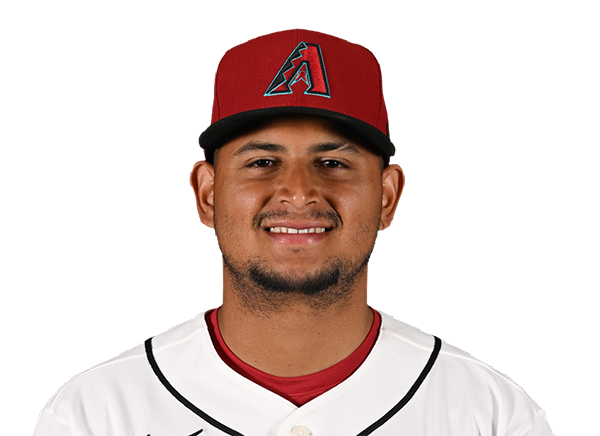
Gabriel Moreno
.303 AVG
.383 OBP
.443 SLG
Runs Batted In
Andy Pages
75 RBI
19 HR
.270 AVG

Ketel Marte
62 RBI
19 HR
.244 AVG
Earned Run Average
Yoshinobu Yamamoto
2.65 ERA
11 W
127 K
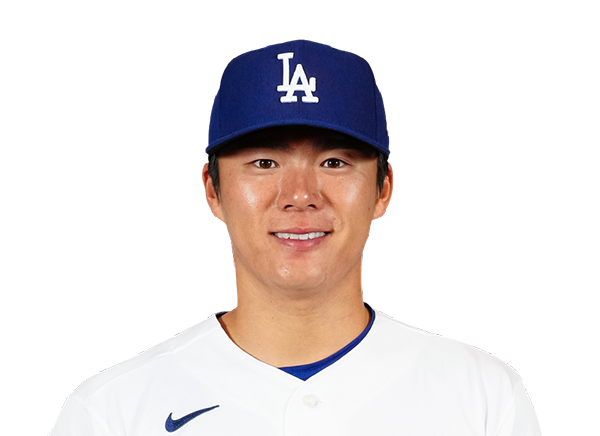
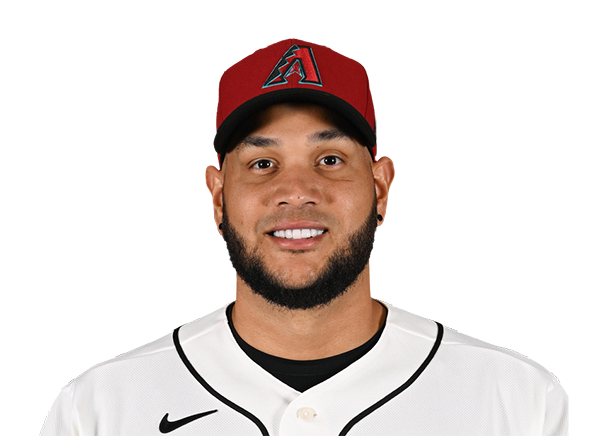
Eduardo Rodriguez
2.71 ERA
10 W
92 K
Wins
Yoshinobu Yamamoto
11 W
2.65 ERA
127 K
Eduardo Rodriguez
10 W
2.71 ERA
92 K
Strikeouts
Yoshinobu Yamamoto
127 K
11 W
2.65 ERA
Eduardo Rodriguez
92 K
10 W
2.71 ERA
Injury Report





Team Stats
 LAD
ARI


Array
Runs
Array
6
Hits
6
1
Errors
0
—
Home Runs
—
—
Walks
—
—
Strikeouts
—
Standings
American League
| Team | W | L | PCT | GB | DIFF | STRK |
|---|---|---|---|---|---|---|
1 Rays | 76 | 53 | .589 | - | +42 | L3 |
2 White Sox | 67 | 62 | .519 | 9 | +42 | L1 |
3 Astros | 65 | 65 | .500 | 11.5 | -43 | L1 |
4 Yankees | 73 | 56 | .566 | 3 | +95 | L1 |
5 Red Sox | 70 | 59 | .543 | 6 | +98 | W2 |
6 Rangers | 64 | 66 | .492 | 12.5 | -48 | L1 |
7 Guardians | 64 | 66 | .492 | 12.5 | -14 | W3 |
8 Blue Jays | 64 | 67 | .489 | 13 | -50 | W1 |
9 Twins | 63 | 67 | .485 | 13.5 | -47 | L2 |
10 Orioles | 63 | 67 | .485 | 13.5 | -33 | W2 |
11 Mariners | 62 | 68 | .477 | 14.5 | -44 | W2 |
12 Tigers | 61 | 68 | .473 | 15 | +77 | L4 |
13 Royals | 57 | 74 | .435 | 20 | -95 | W7 |
14 Angels | 52 | 78 | .400 | 24.5 | -68 | W1 |
15 Athletics | 50 | 80 | .385 | 26.5 | -188 | W1 |
National League
| Team | W | L | PCT | GB | DIFF | STRK |
|---|---|---|---|---|---|---|
1 Brewers | 81 | 49 | .623 | - | +163 | W3 |
| 2Dodgers | 79 | 51 | .608 | 2 | +147 | W5 |
3 Braves | 75 | 55 | .577 | 6 | +108 | L2 |
4 Cubs | 74 | 56 | .569 | 7 | +98 | L3 |
5 Phillies | 72 | 58 | .554 | 9 | +25 | W8 |
6 Padres | 70 | 60 | .538 | 11 | +9 | W2 |
| 7Diamondbacks | 68 | 62 | .523 | 13 | +7 | L1 |
8 Marlins | 66 | 64 | .508 | 15 | +17 | W2 |
9 Cardinals | 66 | 65 | .504 | 15.5 | 0 | L2 |
10 Pirates | 63 | 68 | .481 | 18.5 | +29 | L2 |
11 Reds | 62 | 68 | .477 | 19 | -92 | W1 |
12 Nationals | 61 | 70 | .466 | 20.5 | +14 | L3 |
13 Mets | 59 | 71 | .454 | 22 | -39 | W1 |
14 Giants | 52 | 77 | .403 | 28.5 | -79 | L3 |
15 Rockies | 50 | 79 | .388 | 30.5 | -131 | L5 |
LAD
VS
ARI
Pitchers
Justin Wrobleski
Catchers
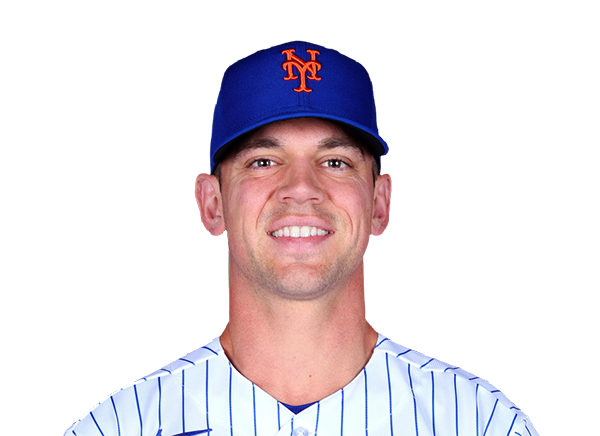
Ben Rortvedt
Infielders
Freddie Freeman

Tommy Edman

Mookie Betts

Enrique Hernandez
Outfielders
Andy Pages

Kyle Tucker
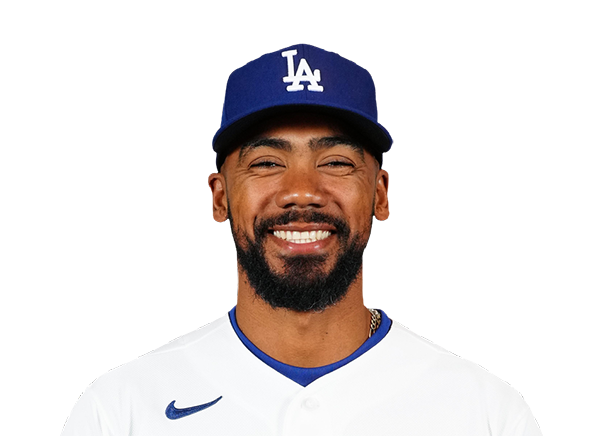
Teoscar Hernandez
Designated Hitters
Shohei Ohtani
Pitchers
Eduardo Rodriguez
Catchers
Gabriel Moreno
Infielders
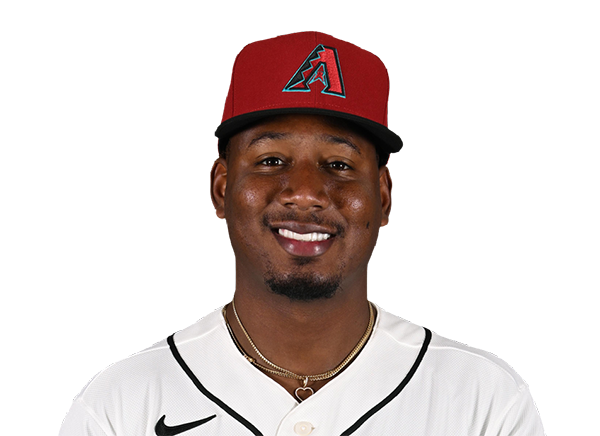
Geraldo Perdomo
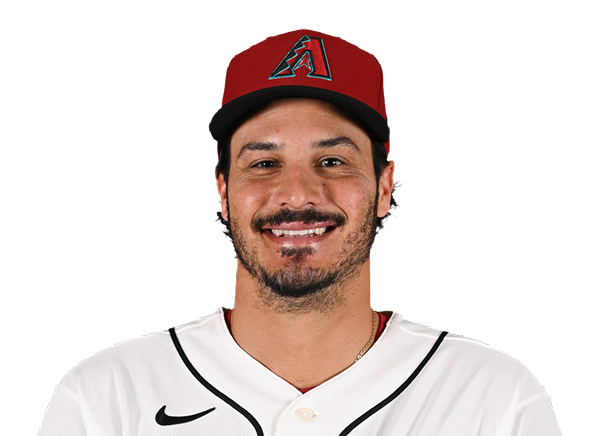
Nolan Arenado

Ildemaro Vargas

Tyler Locklear
Outfielders
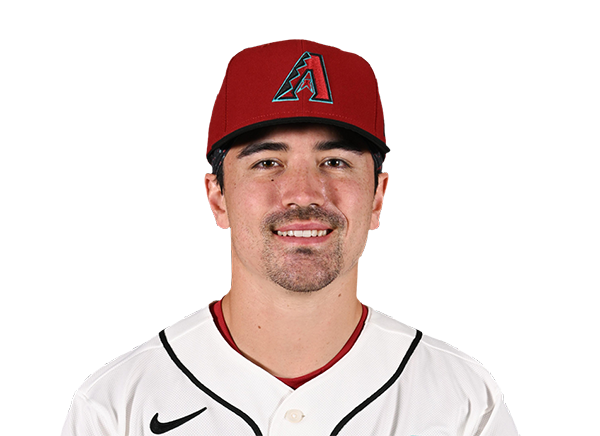
Corbin Carroll

Tim Tawa
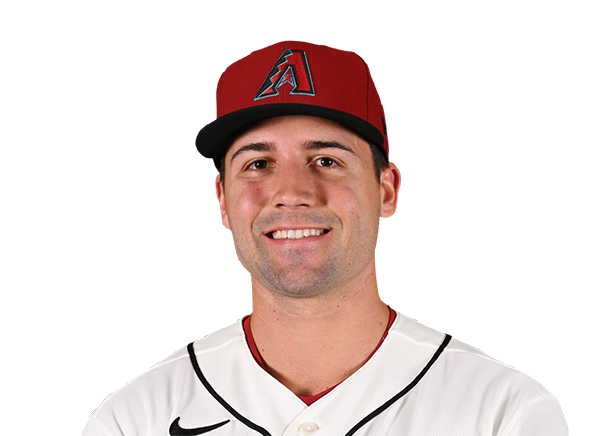
Ryan Waldschmidt
Designated Hitters
Ketel Marte
Dodgers
VS
Diamondbacks
Batting
118
Team Games Played
119
3977
At Bats
3987
1036
Hits
965
556
Runs Batted In
510
151
Home Runs
114
45
Stolen Bases
76
.260
Batting Average
.242
591
Runs
537
190
Doubles
204
12
Triples
29
1703
Total Bases
1569
443
Walks
396
926
Strikeouts
869
.338
On Base Percentage
.314
.428
Slugging Percentage
.394
.766
OBP Pct + SLG Pct
.708
118
Games Played
119
118
Games Started
119
41
Hit By Pitch
42
0.0
Wins Above Replacement
0.0
0.0
Offensive Wins Above Replacement
0.0
16
Caught Stealing
18
1
Is Qualified
1
576.6
Runs Created
509.6
5.0
Runs Created Per 27 Outs
4.3
.098
Walks Per Plate Appearance
.088
0.48
Walk To Strikeout Ratio
0.46
.168
Isolated Power
.151
.286
Secondary Average
.265
3.94
Pitches Per Plate Appearance
3.93
353
Extra Base Hits
347
4515
Plate Appearances
4493
26.3
At Bats Per Home Run
35.0
12
Sacrifice Hit
28
39
Sacrifice Flies
38
Pitching
118
Team Games Played
119
61
Quality Starts
44
70
Wins
63
48
Losses
56
31
Saves
30
73
Holds
70
846
Hits
1017
430
Earned runs
487
141
Home Runs
137
365
Walks
348
1050
Strikeouts
808
9.1
Strikeouts Per 9 Innings
6.9
142.5
Pitches Per Start
140.9
1.16
Walks Plus Hits Per Inning Pitched
1.29
3.72
Earned Run Average
4.15
48
Losses
56
1040.2
Innings pitched
1057.0
.593
Win Percentage
.529
45
Save Opportunities
45
.219
Opponent Batting Average
.252
.293
Opponent's On-base pct.
.317
.377
Opponent's Slugging pct.
.416
.670
Opponent's OPB Pct + SLG Pct
.733
3867
At Bats
4030
168
Doubles
200
10
Triples
24
48
Batters Hit
46
66
Stolen Bases
67
118
Games Played
119
1
Complete Games
1
10
Shutouts
5
27
Wild Pitches
23
431
Runs Batted In
518
4
Balks
5
1040.2
Innings pitched
1057.0
9.1
Strikeouts Per 9 Innings
6.9
17
Caught Stealing
17
118
Games Started
119
0.0
Wins Above Replacement
0.0
1
Is Qualified
1
453
Runs
532
430
Earned Runs
487
1457
Total Bases
1676
Fielding
118
Team Games Played
119
1041
Full Innings
1057
4131
Total Chances
4258
3122
Putouts
3171
964
Assists
1043
45
Errors
44
190
Double Plays
204
0.989
Fielding Percentage
0.990
35.3
Range Factor
35.9
0.0
Zone Rating
0.0
118
Games Played
119
0
Games Started
0
0.0
Defensive Wins Above Replacement
0.0
1
Qualified
1