

Dodgers vs Twins Live Score (22 Jun, 2026)
Game Information
Stage
Standard
Season
2026
First Pitch
Mon, Jun 22, 7:40 pm
Venue
Target Field
Location
Minneapolis, Minnesota
Attendance
35,244
Live Situation
3Balls
2Strikes
0Outs
—Pitcher
—At Bat
Pitch Sequence
1
STRIKE FOUL
Slider
89 MPH
2
STRIKE SWINGING
Slider
91 MPH
3
BALL
Slider
89 MPH
4
BALL
Slider
89 MPH
5
BALL
Four-seam FB
97 MPH
6
BALL IN PLAY
Slider
88 MPH
Injury Report
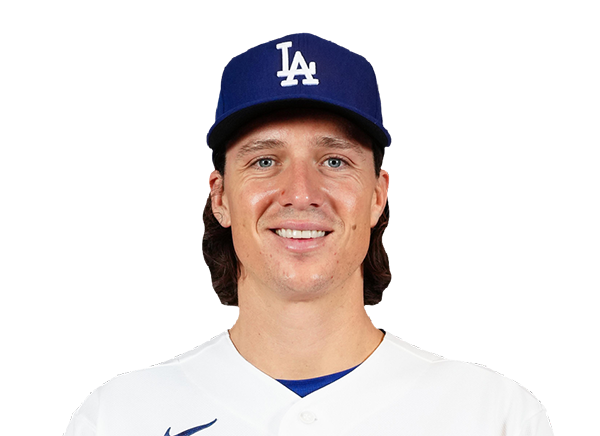
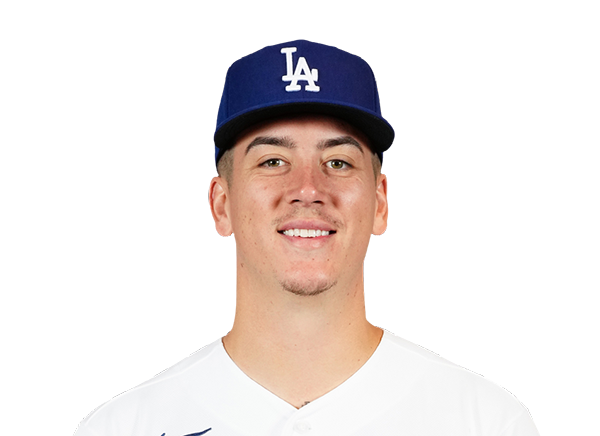
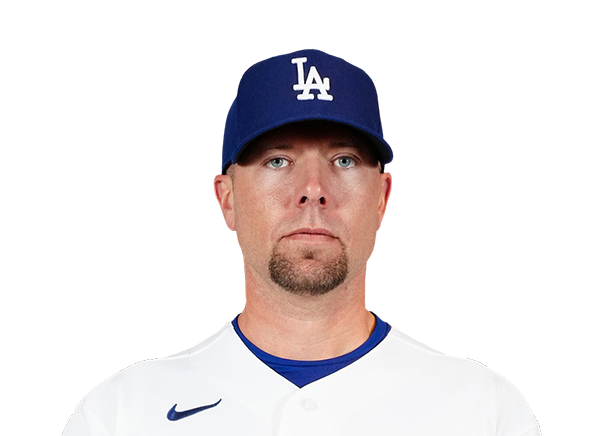
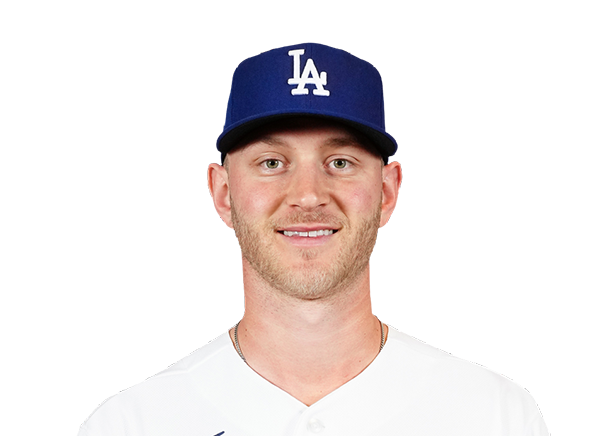
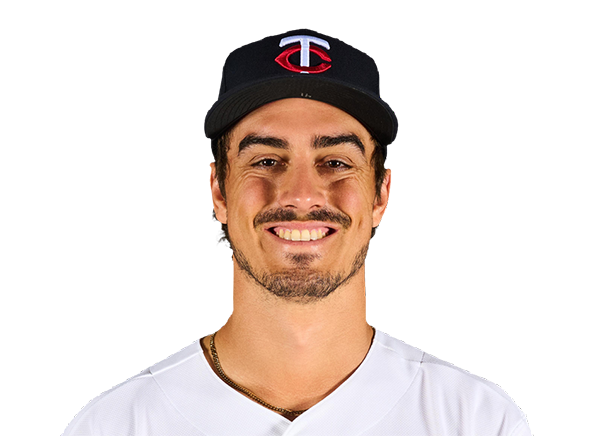
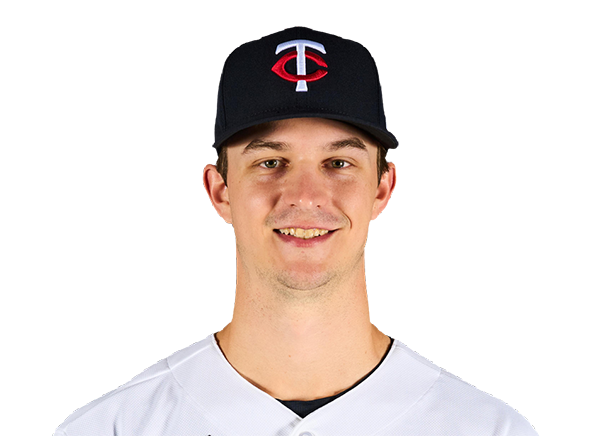
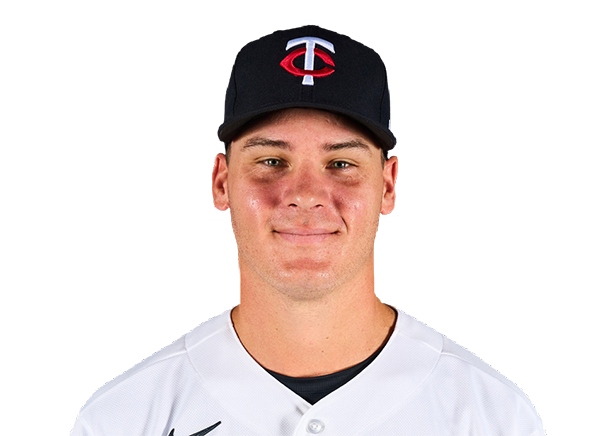
Team Stats
 LAD
MIN


2
Runs
1
9
Hits
3
0
Errors
0
2
Home Runs
1
3
Walks
4
8
Strikeouts
5
Player Box Score
Los Angeles Dodgers
| Player | H-AB | AB | R | H | RBI | HR | BB | K | #P | AVG | OBP | SLG |
|---|---|---|---|---|---|---|---|---|---|---|---|---|
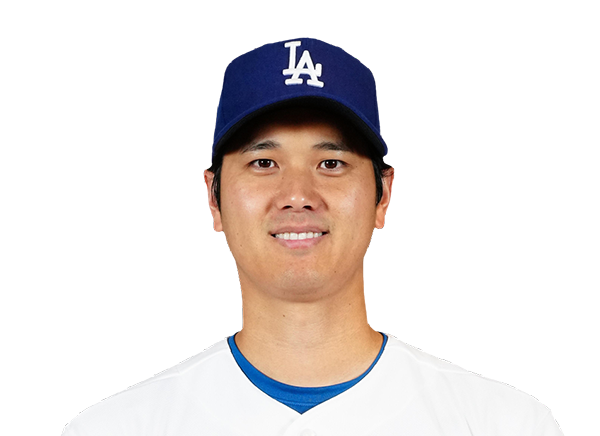 Shohei Ohtani | 1-4 | 4 | 1 | 1 | 1 | 1 | 1 | 0 | 23 | .296 | .418 | .558 |
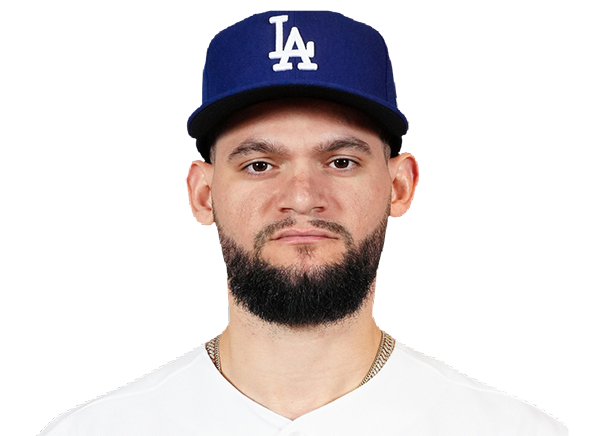 Andy Pages | 0-5 | 5 | 0 | 0 | 0 | 0 | 0 | 1 | 17 | .264 | .313 | .479 |
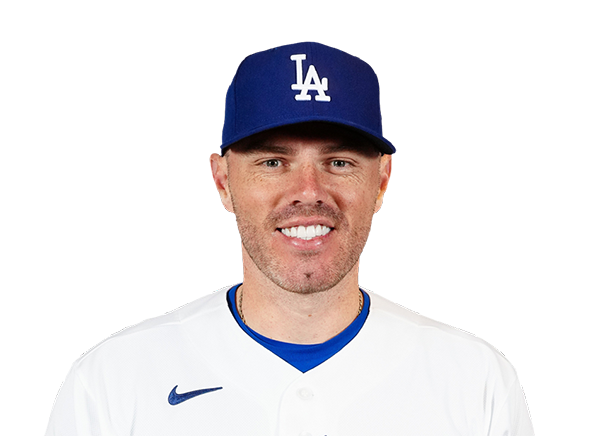 Freddie Freeman | 1-4 | 4 | 1 | 1 | 1 | 1 | 0 | 2 | 17 | .273 | .363 | .476 |
 Mookie Betts | 0-3 | 3 | 0 | 0 | 0 | 0 | 1 | 1 | 14 | .214 | .279 | .387 |
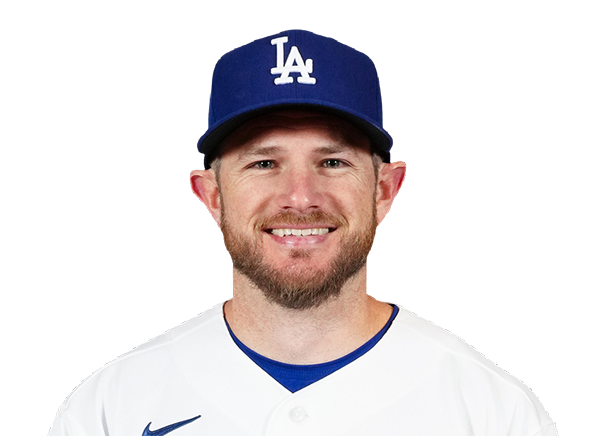 Max Muncy | 1-4 | 4 | 0 | 1 | 0 | 0 | 0 | 1 | 17 | .265 | .368 | .513 |
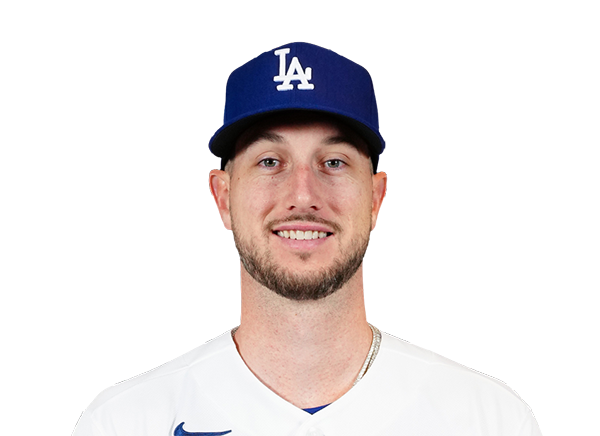 Kyle Tucker | 0-0 | 0 | 0 | 0 | 0 | 0 | 1 | 0 | 5 | .234 | .333 | .374 |
 Alex Call | 2-3 | 3 | 0 | 2 | 0 | 0 | 0 | 1 | 10 | .260 | .368 | .313 |
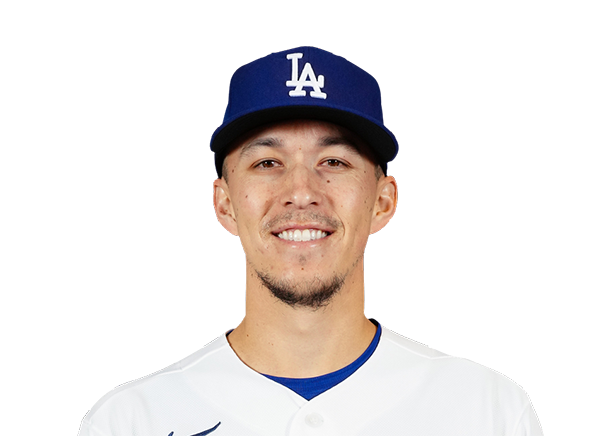 Tommy Edman | 2-4 | 4 | 0 | 2 | 0 | 0 | 0 | 0 | 17 | .412 | .444 | .471 |
 Dalton Rushing | 0-1 | 1 | 0 | 0 | 0 | 0 | 0 | 0 | 1 | .252 | .340 | .481 |
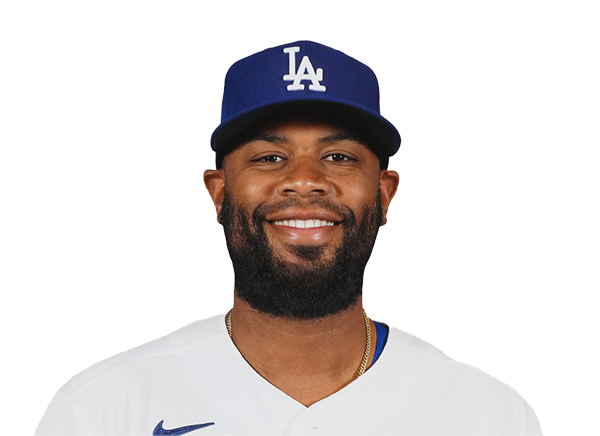 Chuckie Robinson | 0-3 | 3 | 0 | 0 | 0 | 0 | 0 | 2 | 14 | .000 | .000 | .000 |
 Ryan Ward | 0-2 | 2 | 0 | 0 | 0 | 0 | 0 | 0 | 8 | .220 | .291 | .480 |
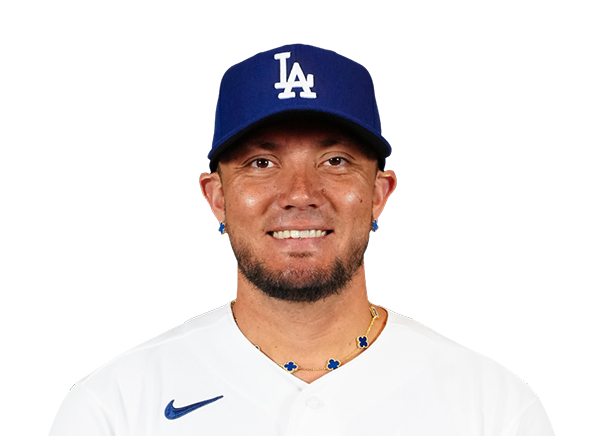 Miguel Rojas | 1-1 | 1 | 0 | 1 | 0 | 0 | 0 | 0 | 4 | .265 | .323 | .363 |
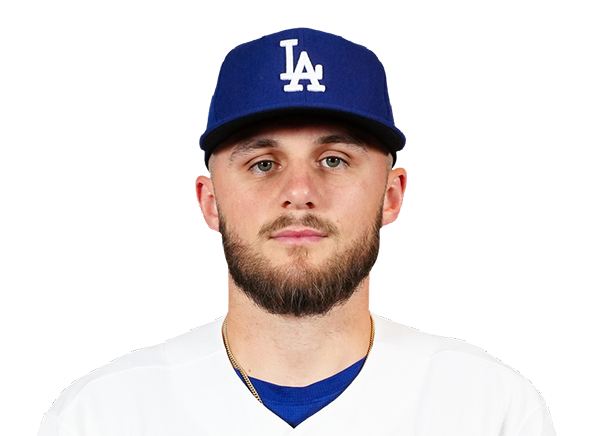 Alex Freeland | 1-1 | 1 | 0 | 1 | 0 | 0 | 0 | 0 | 4 | .234 | .318 | .331 |
Minnesota Twins
| Player | H-AB | AB | R | H | RBI | HR | BB | K | #P | AVG | OBP | SLG |
|---|---|---|---|---|---|---|---|---|---|---|---|---|
 Trevor Larnach | 0-1 | 1 | 0 | 0 | 0 | 0 | 0 | 1 | 10 | .280 | .377 | .425 |
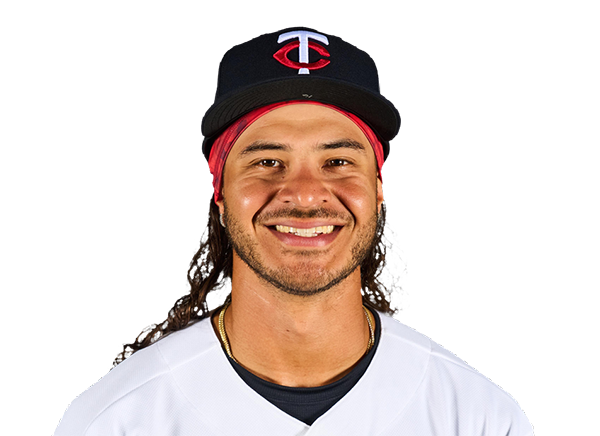 Austin Martin | 1-2 | 2 | 0 | 1 | 0 | 0 | 1 | 0 | 11 | .238 | .350 | .320 |
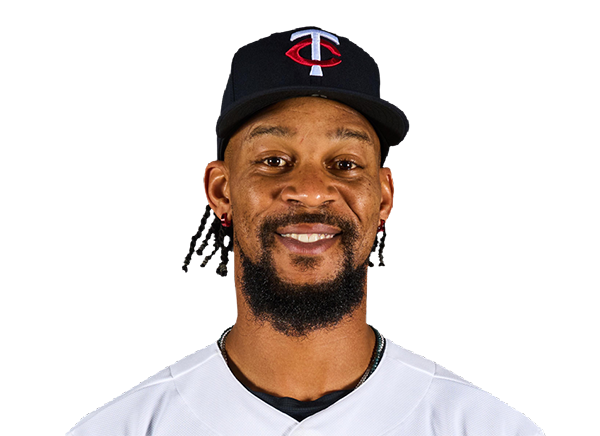 Byron Buxton | 1-4 | 4 | 1 | 1 | 1 | 1 | 0 | 1 | 19 | .275 | .333 | .596 |
 Kody Clemens | 0-3 | 3 | 0 | 0 | 0 | 0 | 1 | 1 | 15 | .244 | .308 | .466 |
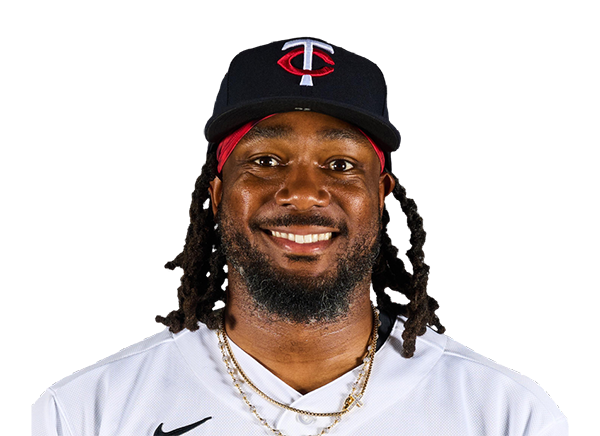 Josh Bell | 0-2 | 2 | 0 | 0 | 0 | 0 | 2 | 0 | 12 | .248 | .308 | .399 |
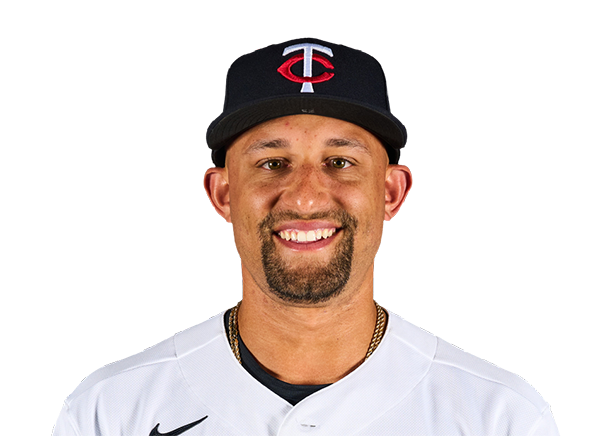 Royce Lewis | 1-4 | 4 | 0 | 1 | 0 | 0 | 0 | 0 | 16 | .204 | .288 | .370 |
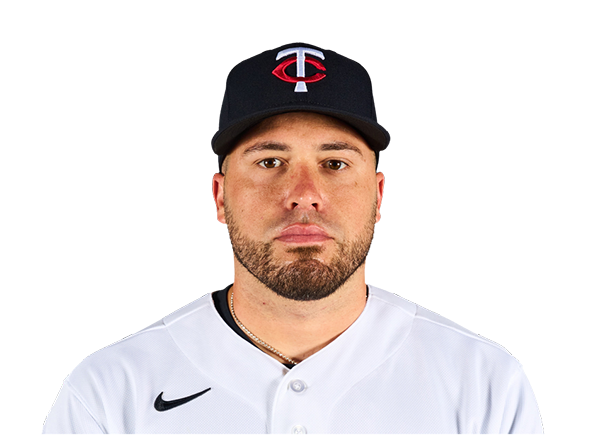 Victor Caratini | 0-4 | 4 | 0 | 0 | 0 | 0 | 0 | 1 | 12 | .236 | .332 | .354 |
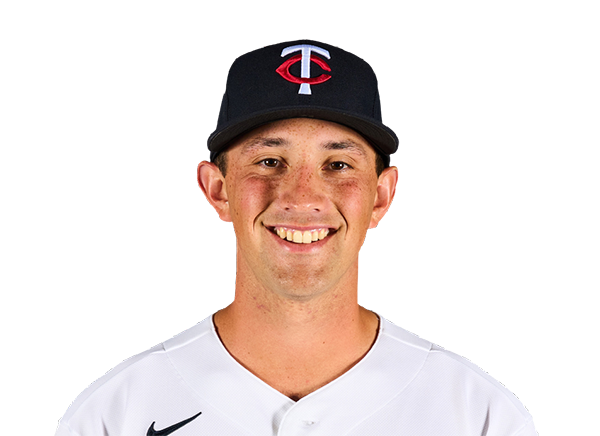 Brooks Lee | 0-4 | 4 | 0 | 0 | 0 | 0 | 0 | 0 | 15 | .238 | .293 | .422 |
 Luke Keaschall | 0-3 | 3 | 0 | 0 | 0 | 0 | 0 | 1 | 13 | .252 | .332 | .328 |
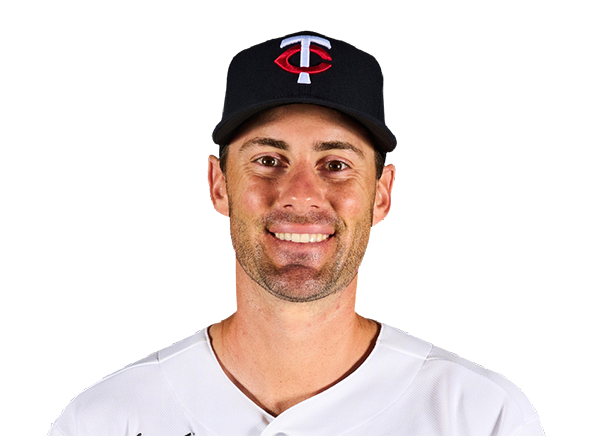 Ryan Kreidler | 0-3 | 3 | 0 | 0 | 0 | 0 | 0 | 0 | 15 | .284 | .370 | .519 |
Los Angeles Dodgers
| Player | IP | H | R | ER | BB | K | HR | PC-ST | ERA | PC |
|---|---|---|---|---|---|---|---|---|---|---|
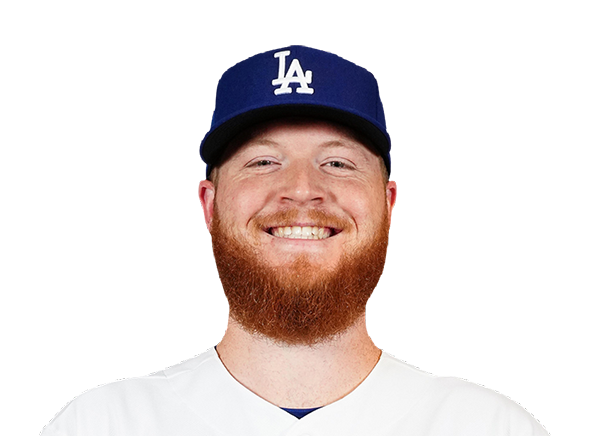 Will Klein | 1.0 | 2 | 1 | 1 | 1 | 2 | 1 | 32-19 | 2.59 | 32 |
 Eric Lauer | 6.0 | 0 | 0 | 0 | 3 | 2 | 0 | 84-52 | 4.87 | 84 |
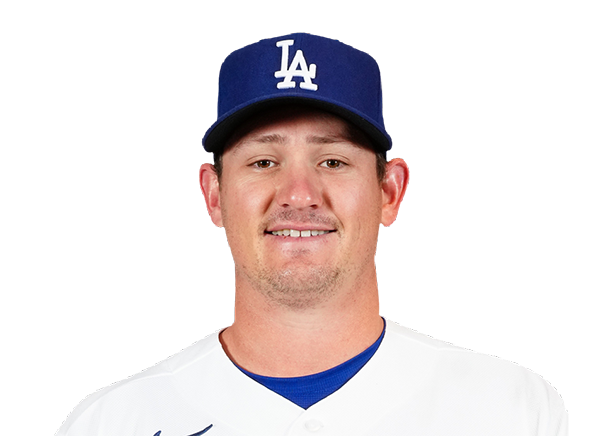 Kyle Hurt | 1.0 | 1 | 0 | 0 | 0 | 1 | 0 | 11-10 | 3.55 | 11 |
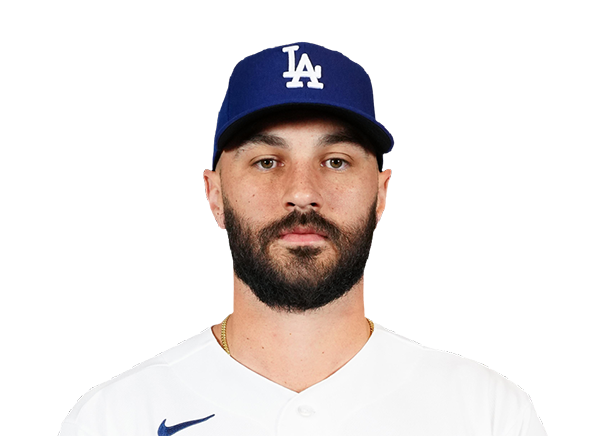 Tanner Scott | 1.0 | 0 | 0 | 0 | 0 | 0 | 0 | 11-7 | 2.25 | 11 |
Minnesota Twins
| Player | IP | H | R | ER | BB | K | HR | PC-ST | ERA | PC |
|---|---|---|---|---|---|---|---|---|---|---|
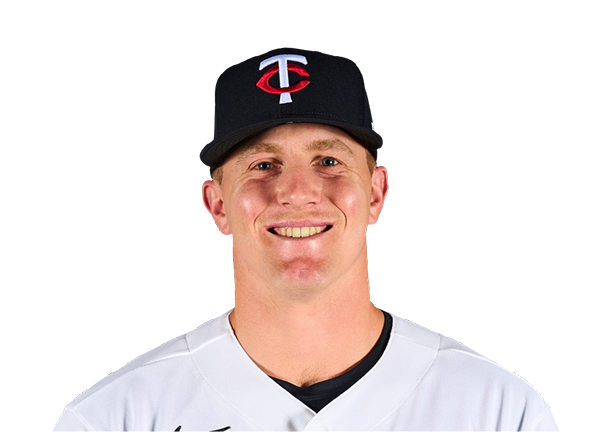 Zebby Matthews | 6.0 | 6 | 2 | 2 | 2 | 5 | 2 | 108-67 | 4.56 | 108 |
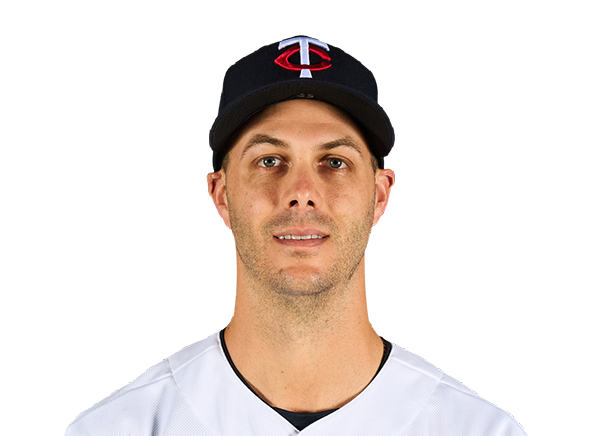 Taylor Rogers | 1.1 | 1 | 0 | 0 | 0 | 1 | 0 | 17-12 | 4.97 | 17 |
 Eric Orze | 0.2 | 1 | 0 | 0 | 0 | 1 | 0 | 11-8 | 4.66 | 11 |
|
Andrew Morris | 1.0 | 1 | 0 | 0 | 1 | 1 | 0 | 15-10 | 4.41 | 15 |
H2H / Season Series
MIN3–4
LAD
MIN3–12
LAD
MIN1–2
LAD
Last 5 Games
| Date | Opponent | Result |
|---|---|---|
| Aug 23 |  vs PIT | W4–0 |
| Aug 22 | vs PIT | W4–3 |
| Aug 21 | vs PIT | W5–4 |
| Aug 19 |  @ COL | W6–4 |
| Aug 18 | @ COL | W7–6 |
| Date | Opponent | Result |
|---|---|---|
| Aug 23 |  @ SD | L1–8 |
| Aug 22 | @ SD | L5–7 |
| Aug 21 | @ SD | L2–6 |
| Aug 19 |  vs ATL | W6–4 |
| Aug 18 | vs ATL | W4–1 |
Standings
American League
| Team | W | L | PCT | GB | DIFF | STRK |
|---|---|---|---|---|---|---|
1 Rays | 77 | 53 | .592 | - | +44 | W1 |
2 White Sox | 68 | 62 | .523 | 9 | +43 | W1 |
3 Astros | 65 | 66 | .496 | 12.5 | -44 | L2 |
4 Yankees | 74 | 56 | .569 | 3 | +100 | W1 |
5 Red Sox | 71 | 59 | .546 | 6 | +99 | W3 |
6 Rangers | 65 | 66 | .496 | 12.5 | -46 | W1 |
7 Guardians | 65 | 66 | .496 | 12.5 | -9 | W4 |
8 Blue Jays | 64 | 68 | .485 | 14 | -55 | L1 |
| 9Twins | 63 | 68 | .481 | 14.5 | -54 | L3 |
10 Orioles | 63 | 68 | .481 | 14.5 | -35 | L1 |
11 Mariners | 62 | 69 | .473 | 15.5 | -61 | L1 |
12 Tigers | 61 | 69 | .469 | 16 | +73 | L5 |
13 Royals | 58 | 74 | .439 | 20 | -91 | W8 |
14 Angels | 52 | 79 | .397 | 25.5 | -70 | L1 |
15 Athletics | 51 | 80 | .389 | 26.5 | -187 | W2 |
National League
| Team | W | L | PCT | GB | DIFF | STRK |
|---|---|---|---|---|---|---|
1 Brewers | 81 | 50 | .618 | - | +161 | L1 |
| 2Dodgers | 80 | 51 | .611 | 1 | +151 | W6 |
| 3Braves | 76 | 55 | .580 | 5 | +110 | W1 |
4 Cubs | 75 | 56 | .573 | 6 | +115 | W1 |
5 Phillies | 73 | 58 | .557 | 8 | +27 | W9 |
| 6Padres | 71 | 60 | .542 | 10 | +16 | W3 |
7 Diamondbacks | 69 | 62 | .527 | 12 | +9 | W1 |
8 Marlins | 67 | 64 | .511 | 14 | +21 | W3 |
9 Cardinals | 66 | 66 | .500 | 15.5 | -2 | L3 |
| 10Pirates | 63 | 69 | .477 | 18.5 | +25 | L3 |
11 Reds | 62 | 69 | .473 | 19 | -94 | L1 |
12 Nationals | 61 | 71 | .462 | 20.5 | +10 | L4 |
13 Mets | 59 | 72 | .450 | 22 | -40 | L1 |
14 Giants | 52 | 78 | .400 | 28.5 | -80 | L4 |
| 15Rockies | 50 | 80 | .385 | 30.5 | -136 | L6 |
LAD
VS
MIN
Pitchers
Will Klein
Eric Lauer
Kyle Hurt
Tanner Scott
Catchers
Dalton Rushing
Chuckie Robinson
Infielders
Freddie Freeman
Mookie Betts
Max Muncy
Miguel Rojas
Alex Freeland
Outfielders
Andy Pages
Kyle Tucker
Alex Call
Tommy Edman
Ryan Ward
Designated Hitters
Shohei Ohtani
Pitchers
Zebby Matthews
Taylor Rogers
Eric Orze
Andrew Morris
Catchers
Victor Caratini
Infielders
Royce Lewis
Brooks Lee
Luke Keaschall
Ryan Kreidler
Outfielders
Trevor Larnach
Austin Martin
Byron Buxton
Kody Clemens
Designated Hitters
Josh Bell
Dodgers
VS
Twins
Batting
131
Team Games Played
131
4414
At Bats
4409
1140
Hits
1080
617
Runs Batted In
572
167
Home Runs
151
52
Stolen Bases
74
.258
Batting Average
.245
653
Runs
600
213
Doubles
213
14
Triples
19
1882
Total Bases
1784
485
Walks
422
1030
Strikeouts
1051
.335
On Base Percentage
.319
.426
Slugging Percentage
.405
.761
OBP Pct + SLG Pct
.723
131
Games Played
131
131
Games Started
131
46
Hit By Pitch
71
0.0
Wins Above Replacement
0.0
0.0
Offensive Wins Above Replacement
0.0
18
Caught Stealing
31
1
Is Qualified
1
632.9
Runs Created
576.8
4.9
Runs Created Per 27 Outs
4.5
.097
Walks Per Plate Appearance
.085
0.47
Walk To Strikeout Ratio
0.40
.168
Isolated Power
.160
.286
Secondary Average
.265
3.93
Pitches Per Plate Appearance
3.86
394
Extra Base Hits
383
5002
Plate Appearances
4946
26.4
At Bats Per Home Run
29.2
12
Sacrifice Hit
7
42
Sacrifice Flies
36
Pitching
131
Team Games Played
131
70
Quality Starts
43
80
Wins
63
51
Losses
68
37
Saves
37
86
Holds
89
936
Hits
1119
473
Earned runs
598
148
Home Runs
152
408
Walks
481
1193
Strikeouts
1081
9.3
Strikeouts Per 9 Innings
8.4
143.7
Pitches Per Start
150.1
1.16
Walks Plus Hits Per Inning Pitched
1.39
3.67
Earned Run Average
4.66
51
Losses
68
1160.2
Innings pitched
1154.2
.611
Win Percentage
.481
56
Save Opportunities
52
.217
Opponent Batting Average
.252
.292
Opponent's On-base pct.
.330
.369
Opponent's Slugging pct.
.414
.661
Opponent's OPB Pct + SLG Pct
.744
4310
At Bats
4434
189
Doubles
228
11
Triples
16
56
Batters Hit
55
77
Stolen Bases
110
131
Games Played
131
1
Complete Games
1
11
Shutouts
3
30
Wild Pitches
35
476
Runs Batted In
625
4
Balks
6
1160.2
Innings pitched
1154.2
9.3
Strikeouts Per 9 Innings
8.4
20
Caught Stealing
20
131
Games Started
131
0.0
Wins Above Replacement
0.0
1
Is Qualified
1
502
Runs
654
473
Earned Runs
598
1591
Total Bases
1835
Fielding
131
Team Games Played
131
1161
Full Innings
1155
4594
Total Chances
4526
3482
Putouts
3464
1060
Assists
1000
52
Errors
62
213
Double Plays
213
0.989
Fielding Percentage
0.986
35.2
Range Factor
34.8
0.0
Zone Rating
0.0
131
Games Played
131
0
Games Started
0
0.0
Defensive Wins Above Replacement
0.0
1
Qualified
1