

Giants vs Athletics Live Score (17 May, 2026)
Game Information
Stage
Standard
Season
2026
First Pitch
Sun, May 17, 4:05 pm
Venue
Sutter Health Park
Location
Sacramento, California
Attendance
12,541
Live Situation
0Balls
2Strikes
0Outs
—Pitcher
—At Bat
Pitch Sequence
1
STRIKE SWINGING
Four-seam FB
100 MPH
2
STRIKE FOUL
Four-seam FB
101 MPH
3
BALL IN PLAY
Four-seam FB
100 MPH
Injury Report
Team Stats
 SF
ATH


10
Runs
1
12
Hits
5
0
Errors
3
2
Home Runs
0
4
Walks
5
4
Strikeouts
6
Player Box Score
San Francisco Giants
| Player | H-AB | AB | R | H | RBI | HR | BB | K | #P | AVG | OBP | SLG |
|---|---|---|---|---|---|---|---|---|---|---|---|---|
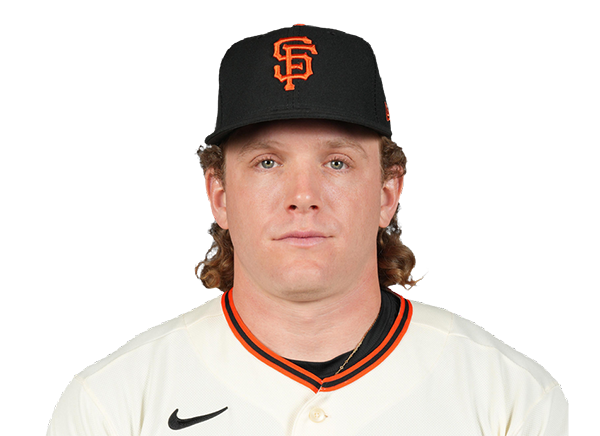 Harrison Bader | 1-4 | 4 | 2 | 1 | 4 | 1 | 1 | 0 | 23 | .153 | .184 | .347 |
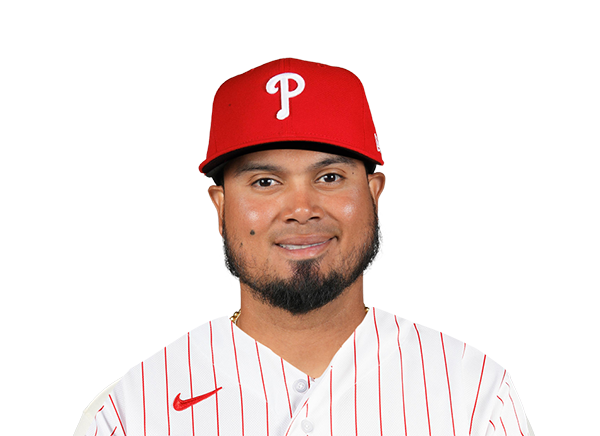 Luis Arraez | 3-4 | 4 | 2 | 3 | 1 | 1 | 1 | 0 | 16 | .328 | .370 | .437 |
 Casey Schmitt | 2-5 | 5 | 1 | 2 | 0 | 0 | 0 | 0 | 19 | .297 | .344 | .531 |
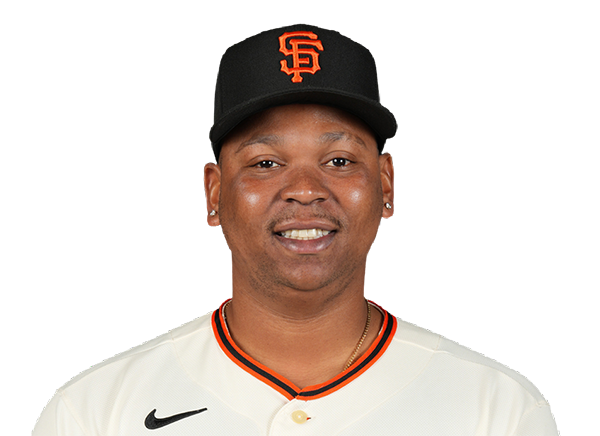 Rafael Devers | 1-5 | 5 | 1 | 1 | 1 | 0 | 0 | 0 | 12 | .246 | .294 | .385 |
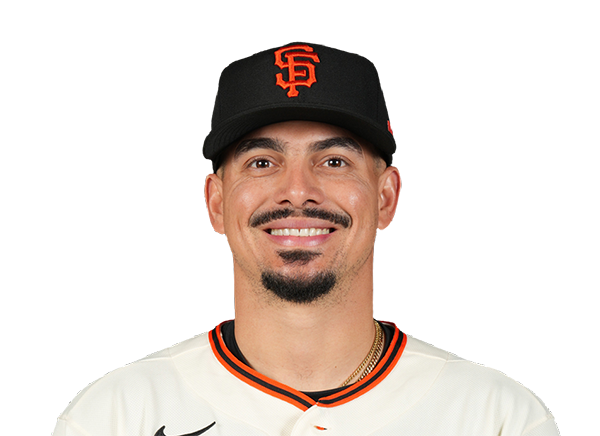 Willy Adames | 1-5 | 5 | 2 | 1 | 0 | 0 | 0 | 0 | 15 | .234 | .265 | .356 |
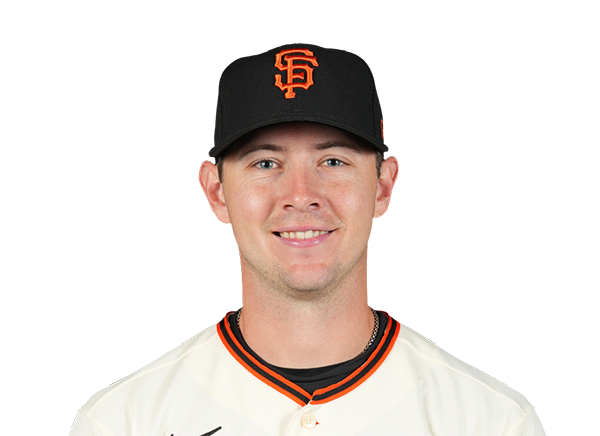 Daniel Susac | 1-4 | 4 | 0 | 1 | 1 | 0 | 1 | 1 | 27 | .387 | .424 | .516 |
 Matt Chapman | 2-4 | 4 | 1 | 2 | 1 | 0 | 1 | 1 | 17 | .223 | .299 | .314 |
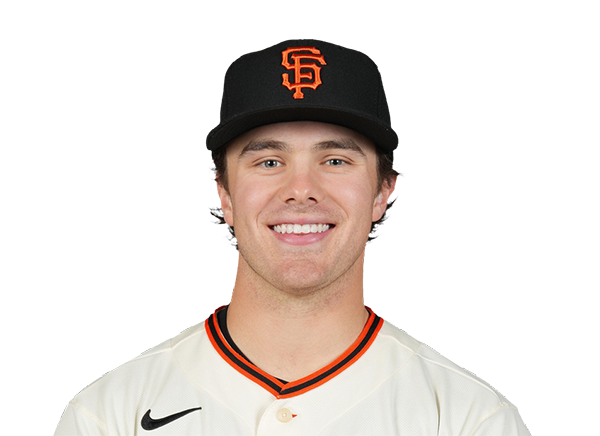 Drew Gilbert | 0-5 | 5 | 0 | 0 | 0 | 0 | 0 | 1 | 26 | .220 | .281 | .341 |
 Eric Haase | 0-2 | 2 | 0 | 0 | 0 | 0 | 0 | 1 | 7 | .273 | .304 | .636 |
 Jung Hoo Lee | 1-2 | 2 | 1 | 1 | 1 | 0 | 0 | 0 | 12 | .266 | .309 | .384 |
Athletics
| Player | H-AB | AB | R | H | RBI | HR | BB | K | #P | AVG | OBP | SLG |
|---|---|---|---|---|---|---|---|---|---|---|---|---|
 Nick Kurtz | 0-1 | 1 | 0 | 0 | 0 | 0 | 3 | 1 | 19 | .269 | .432 | .481 |
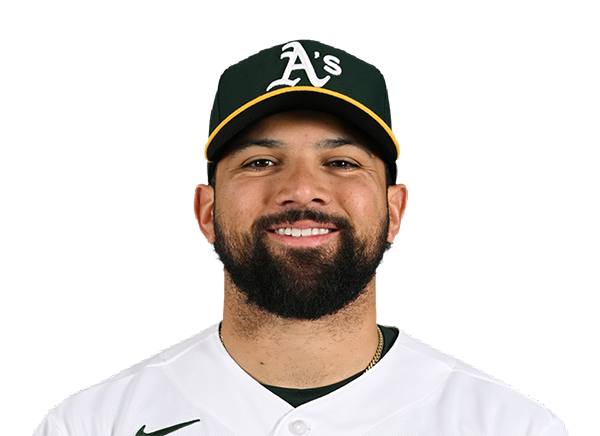 Carlos Cortes | 2-4 | 4 | 0 | 2 | 1 | 0 | 0 | 1 | 16 | .346 | .400 | .558 |
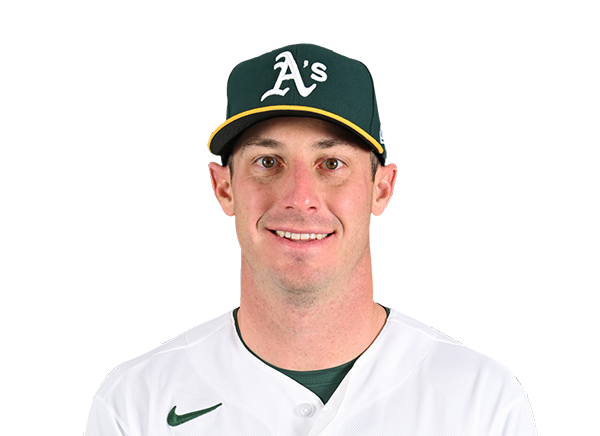 Brent Rooker | 0-4 | 4 | 0 | 0 | 0 | 0 | 0 | 1 | 11 | .196 | .281 | .375 |
 Colby Thomas | 0-0 | 0 | 0 | 0 | 0 | 0 | 0 | 0 | 0 | .345 | .387 | .483 |
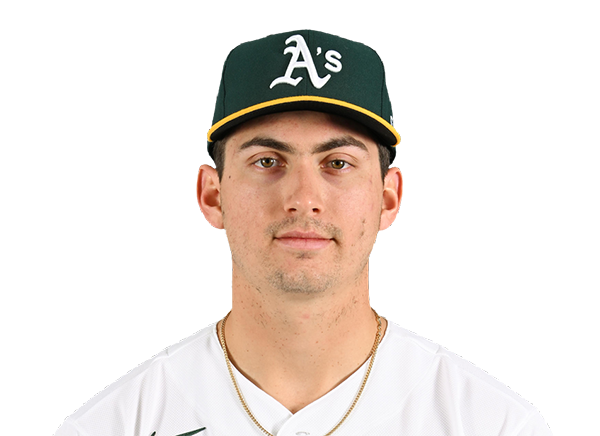 Tyler Soderstrom | 0-3 | 3 | 0 | 0 | 0 | 0 | 1 | 0 | 15 | .195 | .281 | .384 |
 Jeff McNeil | 0-2 | 2 | 0 | 0 | 0 | 0 | 1 | 0 | 9 | .274 | .342 | .363 |
 Alika Williams | 0-1 | 1 | 0 | 0 | 0 | 0 | 0 | 0 | 3 | .000 | .000 | .000 |
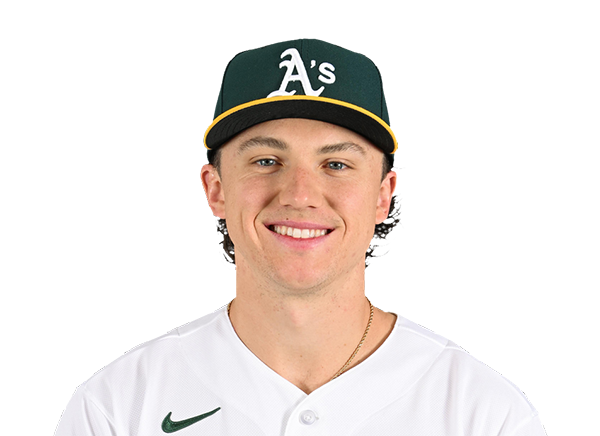 Zack Gelof | 1-4 | 4 | 0 | 1 | 0 | 0 | 0 | 0 | 14 | .247 | .297 | .471 |
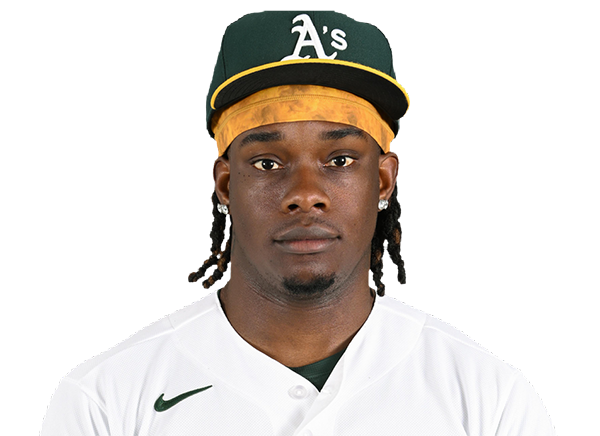 Lawrence Butler | 0-4 | 4 | 0 | 0 | 0 | 0 | 0 | 2 | 21 | .171 | .272 | .264 |
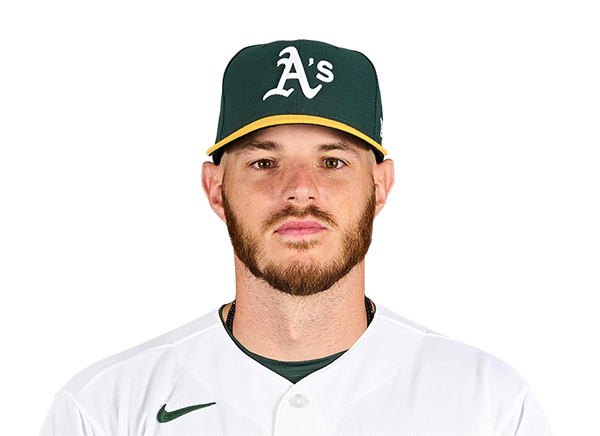 Jonah Heim | 1-4 | 4 | 0 | 1 | 0 | 0 | 0 | 1 | 20 | .067 | .067 | .067 |
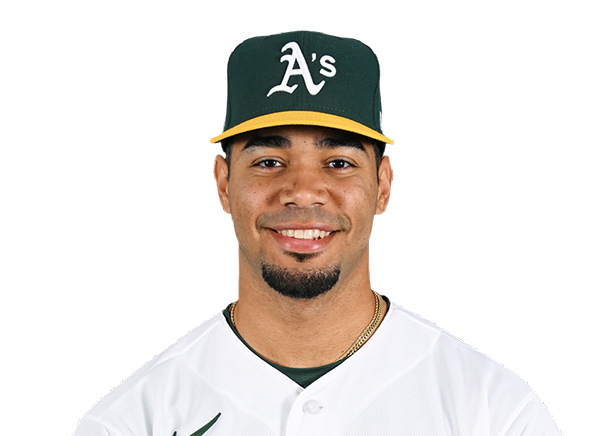 Darell Hernaiz | 1-3 | 3 | 1 | 1 | 0 | 0 | 0 | 0 | 5 | .268 | .342 | .324 |
San Francisco Giants
| Player | IP | H | R | ER | BB | K | HR | PC-ST | ERA | PC |
|---|---|---|---|---|---|---|---|---|---|---|
 Adrian Houser | 6.0 | 4 | 1 | 1 | 5 | 3 | 0 | 93-53 | 5.25 | 93 |
 Sam Hentges | 1.0 | 0 | 0 | 0 | 0 | 2 | 0 | 10-7 | 0.00 | 10 |
 Keaton Winn | 1.0 | 1 | 0 | 0 | 0 | 1 | 0 | 18-11 | 2.33 | 18 |
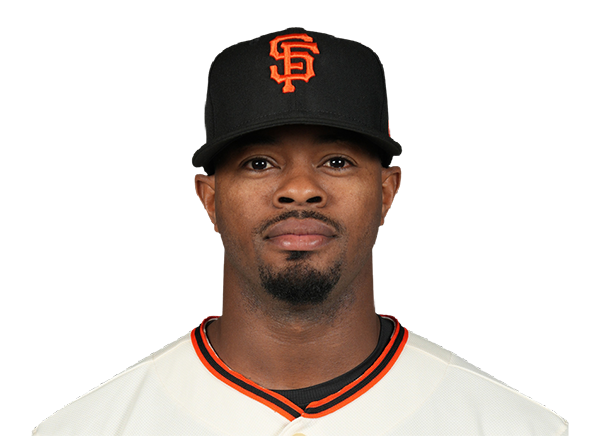 Joel Peguero | 1.0 | 0 | 0 | 0 | 0 | 0 | 0 | 12-9 | 1.42 | 12 |
Athletics
| Player | IP | H | R | ER | BB | K | HR | PC-ST | ERA | PC |
|---|---|---|---|---|---|---|---|---|---|---|
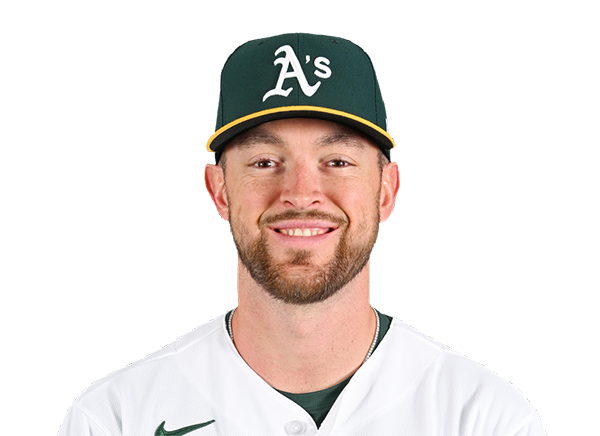 Jeffrey Springs | 6.0 | 5 | 2 | 1 | 1 | 3 | 1 | 92-62 | 3.93 | 92 |
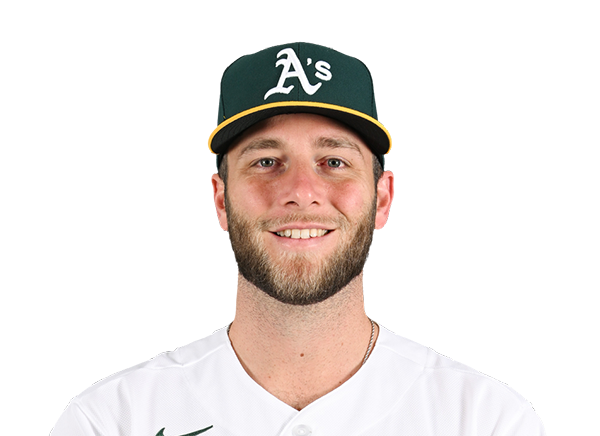 Justin Sterner | 1.0 | 0 | 0 | 0 | 0 | 0 | 0 | 23-16 | 4.03 | 23 |
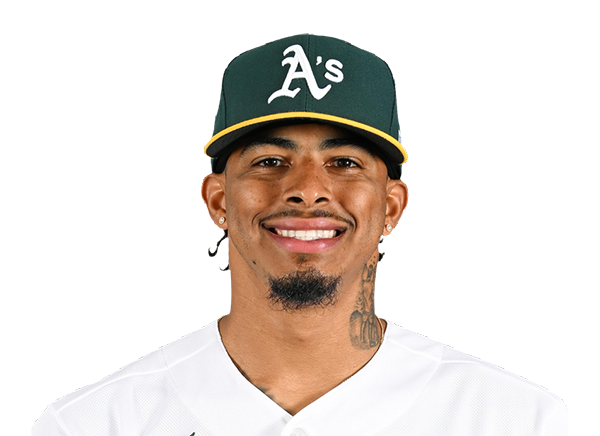 Luis Medina | 0.0 | 3 | 5 | 2 | 1 | 0 | 0 | 20-10 | 2.70 | 20 |
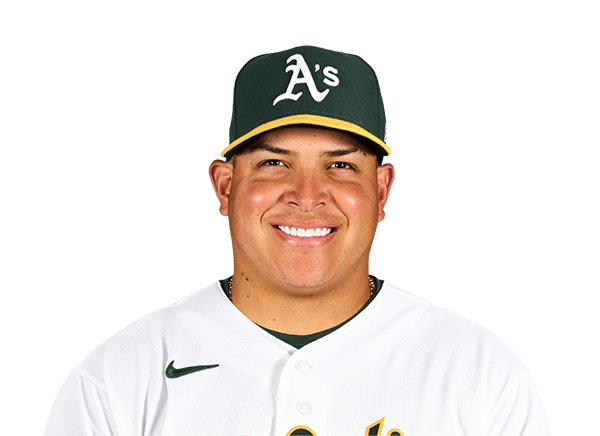 Jose Suarez | 1.0 | 3 | 3 | 3 | 1 | 1 | 1 | 21-15 | 7.08 | 21 |
|
Carlos Cortes | 1.0 | 1 | 0 | 0 | 1 | 0 | 0 | 18-13 | 0.00 | 18 |
H2H / Season Series
SF6–9
ATH
SF2–1
ATH
SF3–1
ATH
ATH1–10
SF
ATH4–6
SF
ATH5–2
SF
ATH2–8
SF
SF6–2
ATH
Last 5 Games
| Date | Opponent | Result |
|---|---|---|
| Aug 23 |  @ BOS | L4–5 |
| Aug 22 | @ BOS | L2–3 |
| Aug 21 | @ BOS | L4–6 |
| Aug 20 |  @ CLE | L2–5 |
| Aug 19 | @ CLE | W1–0 |
| Date | Opponent | Result |
|---|---|---|
| Aug 23 |  @ HOU | W7–6 |
| Aug 22 | @ HOU | W4–3 |
| Aug 21 | @ HOU | L0–4 |
| Aug 20 |  @ KC | L2–6 |
| Aug 19 | @ KC | L7–9 |
Standings
American League
| Team | W | L | PCT | GB | DIFF | STRK |
|---|---|---|---|---|---|---|
1 Rays | 77 | 53 | .592 | - | +44 | W1 |
2 White Sox | 68 | 62 | .523 | 9 | +43 | W1 |
| 3Astros | 65 | 66 | .496 | 12.5 | -44 | L2 |
4 Yankees | 74 | 56 | .569 | 3 | +100 | W1 |
| 5Red Sox | 71 | 59 | .546 | 6 | +99 | W3 |
6 Rangers | 65 | 66 | .496 | 12.5 | -46 | W1 |
| 7Guardians | 65 | 66 | .496 | 12.5 | -9 | W4 |
8 Blue Jays | 64 | 68 | .485 | 14 | -55 | L1 |
9 Twins | 63 | 68 | .481 | 14.5 | -54 | L3 |
10 Orioles | 63 | 68 | .481 | 14.5 | -35 | L1 |
11 Mariners | 62 | 69 | .473 | 15.5 | -61 | L1 |
12 Tigers | 61 | 69 | .469 | 16 | +73 | L5 |
| 13Royals | 58 | 74 | .439 | 20 | -91 | W8 |
14 Angels | 52 | 79 | .397 | 25.5 | -70 | L1 |
| 15Athletics | 51 | 80 | .389 | 26.5 | -187 | W2 |
National League
| Team | W | L | PCT | GB | DIFF | STRK |
|---|---|---|---|---|---|---|
1 Brewers | 81 | 50 | .618 | - | +161 | L1 |
2 Dodgers | 80 | 51 | .611 | 1 | +151 | W6 |
3 Braves | 76 | 55 | .580 | 5 | +110 | W1 |
4 Cubs | 75 | 56 | .573 | 6 | +115 | W1 |
5 Phillies | 73 | 58 | .557 | 8 | +27 | W9 |
6 Padres | 71 | 60 | .542 | 10 | +16 | W3 |
7 Diamondbacks | 69 | 62 | .527 | 12 | +9 | W1 |
8 Marlins | 67 | 64 | .511 | 14 | +21 | W3 |
9 Cardinals | 66 | 66 | .500 | 15.5 | -2 | L3 |
10 Pirates | 63 | 69 | .477 | 18.5 | +25 | L3 |
11 Reds | 62 | 69 | .473 | 19 | -94 | L1 |
12 Nationals | 61 | 71 | .462 | 20.5 | +10 | L4 |
13 Mets | 59 | 72 | .450 | 22 | -40 | L1 |
| 14Giants | 52 | 78 | .400 | 28.5 | -80 | L4 |
15 Rockies | 50 | 80 | .385 | 30.5 | -136 | L6 |
SF
VS
ATH
Pitchers
Adrian Houser
Sam Hentges
Keaton Winn
Joel Peguero
Catchers
Daniel Susac
Infielders
Luis Arraez
Rafael Devers
Willy Adames
Matt Chapman
Outfielders
Harrison Bader
Drew Gilbert
Eric Haase
Jung Hoo Lee
Designated Hitters
Casey Schmitt
Pitchers
Carlos Cortes
Jeffrey Springs
Justin Sterner
Luis Medina
Jose Suarez
Catchers
Jonah Heim
Infielders
Nick Kurtz
Jeff McNeil
Alika Williams
Zack Gelof
Darell Hernaiz
Outfielders
Colby Thomas
Tyler Soderstrom
Lawrence Butler
Designated Hitters
Brent Rooker
Giants
VS
Athletics
Batting
130
Team Games Played
131
4415
At Bats
4441
1090
Hits
1084
502
Runs Batted In
543
144
Home Runs
156
57
Stolen Bases
68
.247
Batting Average
.244
523
Runs
568
214
Doubles
202
24
Triples
11
1784
Total Bases
1776
344
Walks
437
1036
Strikeouts
1120
.305
On Base Percentage
.318
.404
Slugging Percentage
.400
.709
OBP Pct + SLG Pct
.718
130
Games Played
131
130
Games Started
131
41
Hit By Pitch
58
0.0
Wins Above Replacement
0.0
0.0
Offensive Wins Above Replacement
0.0
18
Caught Stealing
27
1
Is Qualified
1
547.6
Runs Created
563.5
4.3
Runs Created Per 27 Outs
4.3
.071
Walks Per Plate Appearance
.088
0.33
Walk To Strikeout Ratio
0.39
.157
Isolated Power
.156
.244
Secondary Average
.263
3.85
Pitches Per Plate Appearance
3.82
382
Extra Base Hits
369
4858
Plate Appearances
4978
30.7
At Bats Per Home Run
28.5
22
Sacrifice Hit
18
36
Sacrifice Flies
22
Pitching
130
Team Games Played
131
45
Quality Starts
27
52
Wins
51
78
Losses
80
24
Saves
32
63
Holds
73
1072
Hits
1222
554
Earned runs
704
119
Home Runs
200
487
Walks
522
976
Strikeouts
1101
7.7
Strikeouts Per 9 Innings
8.6
147.6
Pitches Per Start
153.8
1.36
Walks Plus Hits Per Inning Pitched
1.51
4.36
Earned Run Average
5.47
78
Losses
80
1144.1
Innings pitched
1158.0
.400
Win Percentage
.389
44
Save Opportunities
58
.248
Opponent Batting Average
.270
.329
Opponent's On-base pct.
.350
.388
Opponent's Slugging pct.
.466
.717
Opponent's OPB Pct + SLG Pct
.816
4324
At Bats
4521
192
Doubles
243
29
Triples
21
57
Batters Hit
63
105
Stolen Bases
86
130
Games Played
131
1
Complete Games
1
9
Shutouts
6
48
Wild Pitches
39
567
Runs Batted In
733
4
Balks
8
1144.1
Innings pitched
1158.0
7.7
Strikeouts Per 9 Innings
8.6
34
Caught Stealing
34
130
Games Started
131
0.0
Wins Above Replacement
0.0
1
Is Qualified
1
603
Runs
755
554
Earned Runs
704
1679
Total Bases
2107
Fielding
130
Team Games Played
131
1144
Full Innings
1158
4738
Total Chances
4520
3433
Putouts
3474
1221
Assists
982
84
Errors
64
214
Double Plays
202
0.982
Fielding Percentage
0.986
36.6
Range Factor
34.6
0.0
Zone Rating
0.0
130
Games Played
131
0
Games Started
0
0.0
Defensive Wins Above Replacement
0.0
1
Qualified
1