

Giants vs Cardinals Live Score (15 Sep, 2026)
Game Information
Stage
STD
Season
2026
First Pitch
Tue, Sep 15, 7:45 pm
Venue
Busch Stadium
Location
St. Louis, Missouri
Venue Type
Outdoor
Broadcast
MLB.TV
Attendance
26,666
Live Situation
0Balls
0Strikes
0Outs
—Pitcher
—At Bat
Pitch Sequence
1
BALL IN PLAY
Four-seam FB
94 MPH
Injury Report




Team Stats
 SF
STL


10
Runs
3
12
Hits
5
0
Errors
2
2
Home Runs
1
5
Walks
2
11
Strikeouts
5
Player Box Score
San Francisco Giants
| Player | H-AB | AB | R | H | RBI | HR | BB | K | #P | AVG | OBP | SLG |
|---|---|---|---|---|---|---|---|---|---|---|---|---|
 Drew Gilbert | 0-4 | 4 | 1 | 0 | 0 | 0 | 0 | 1 | 14 | .231 | .320 | .375 |
 Brett Harris | 1-2 | 2 | 1 | 1 | 0 | 0 | 0 | 1 | 11 | .077 | .294 | .154 |
 Bryce Eldridge | 2-4 | 4 | 2 | 2 | 3 | 1 | 1 | 1 | 19 | .272 | .363 | .465 |
 Jonah Cox | 1-4 | 4 | 2 | 1 | 0 | 0 | 0 | 2 | 18 | .278 | .314 | .435 |
 Jung Hoo Lee | 1-5 | 5 | 1 | 1 | 0 | 0 | 0 | 1 | 13 | .276 | .318 | .400 |
 Osleivis Basabe | 1-3 | 3 | 0 | 1 | 1 | 0 | 1 | 0 | 10 | .202 | .262 | .353 |
|
Scott Bandura | 0-1 | 1 | 0 | 0 | 0 | 0 | 0 | 1 | 7 | .167 | .286 | .167 |
|
Turner Hill | 2-4 | 4 | 1 | 2 | 3 | 1 | 1 | 0 | 19 | .250 | .351 | .363 |
|
Drew Cavanaugh | 0-4 | 4 | 1 | 0 | 0 | 0 | 1 | 3 | 25 | .235 | .327 | .280 |
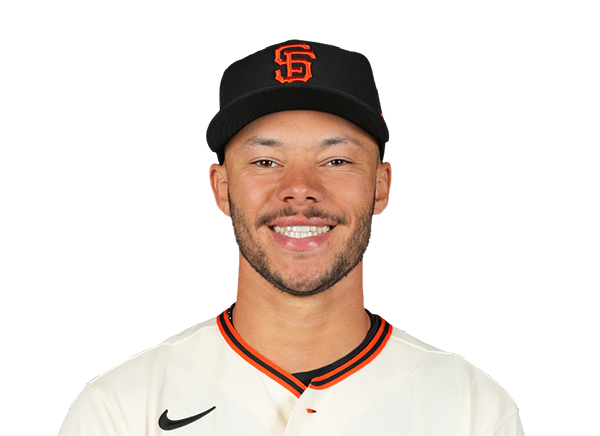 Grant McCray | 1-3 | 3 | 1 | 1 | 1 | 0 | 0 | 0 | 10 | .155 | .259 | .296 |
 Shay Whitcomb | 0-1 | 1 | 0 | 0 | 0 | 0 | 0 | 1 | 5 | .182 | .209 | .352 |
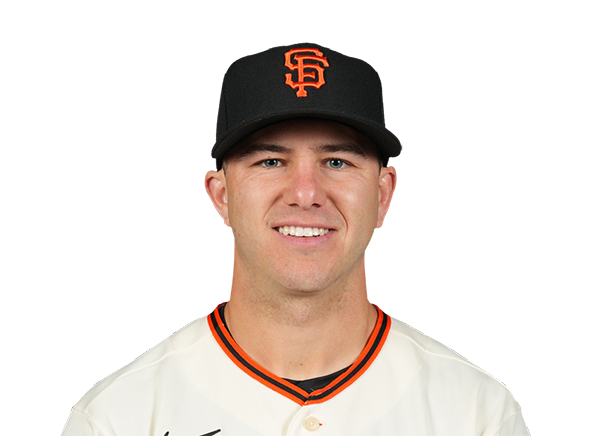 Nate Furman | 0-0 | 0 | 0 | 0 | 0 | 0 | 1 | 0 | 8 | .125 | .243 | .125 |
 Christian Koss | 3-5 | 5 | 0 | 3 | 2 | 0 | 0 | 0 | 21 | .240 | .286 | .339 |
St. Louis Cardinals
| Player | H-AB | AB | R | H | RBI | HR | BB | K | #P | AVG | OBP | SLG |
|---|---|---|---|---|---|---|---|---|---|---|---|---|
 Bryan Torres | 0-3 | 3 | 0 | 0 | 0 | 0 | 1 | 0 | 22 | .250 | .322 | .362 |
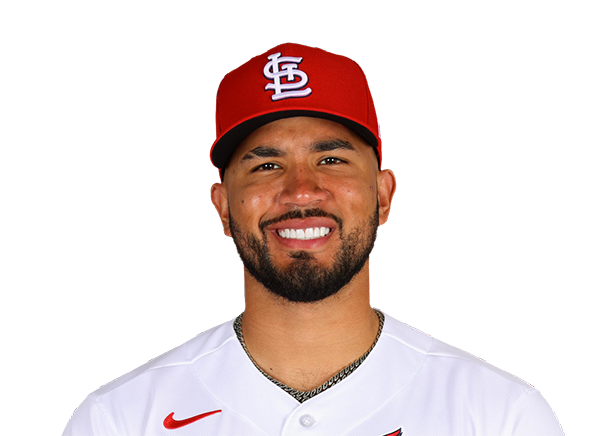 Ivan Herrera | 0-2 | 2 | 0 | 0 | 1 | 0 | 0 | 1 | 12 | .242 | .355 | .374 |
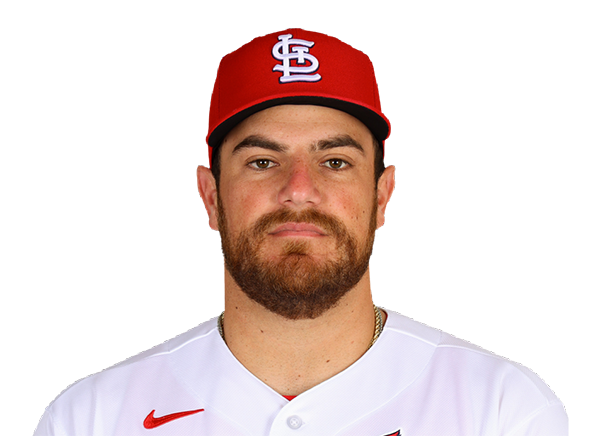 Pedro Pages | 0-1 | 1 | 0 | 0 | 0 | 0 | 0 | 1 | 6 | .211 | .262 | .311 |
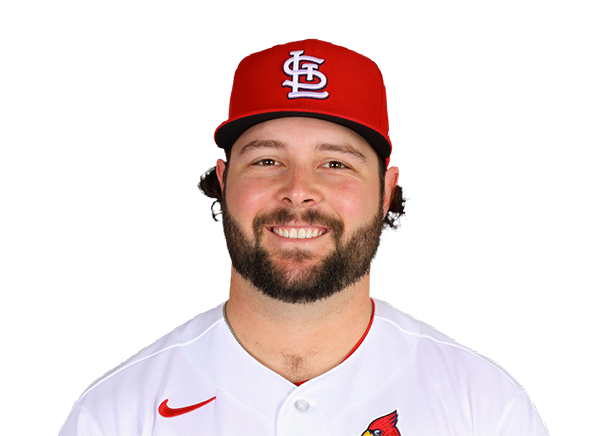 Alec Burleson | 1-3 | 3 | 1 | 1 | 1 | 1 | 0 | 2 | 9 | .285 | .352 | .472 |
 Nolan Gorman | 1-1 | 1 | 0 | 1 | 1 | 0 | 0 | 0 | 6 | .188 | .266 | .318 |
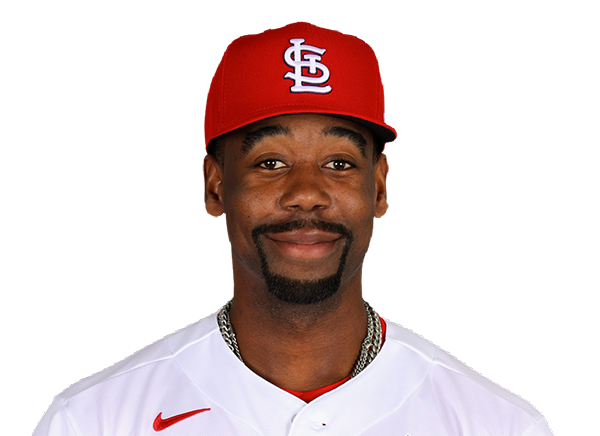 Jordan Walker | 0-3 | 3 | 0 | 0 | 0 | 0 | 0 | 1 | 11 | .280 | .335 | .484 |
 Ramon Urias | 0-1 | 1 | 0 | 0 | 0 | 0 | 0 | 0 | 2 | .151 | .260 | .326 |
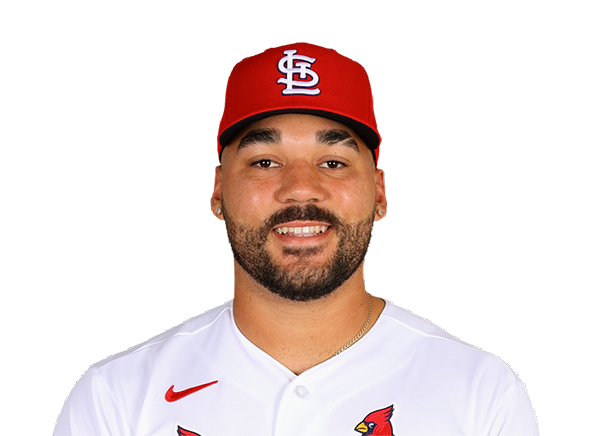 Leo Bernal | 0-4 | 4 | 0 | 0 | 0 | 0 | 0 | 0 | 16 | .304 | .350 | .518 |
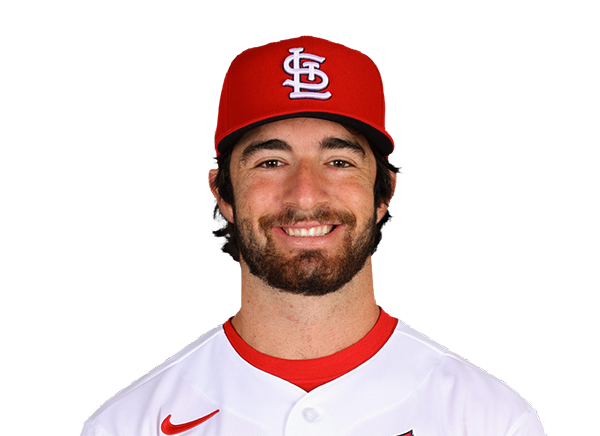 Thomas Saggese | 1-4 | 4 | 0 | 1 | 0 | 0 | 0 | 0 | 14 | .267 | .319 | .412 |
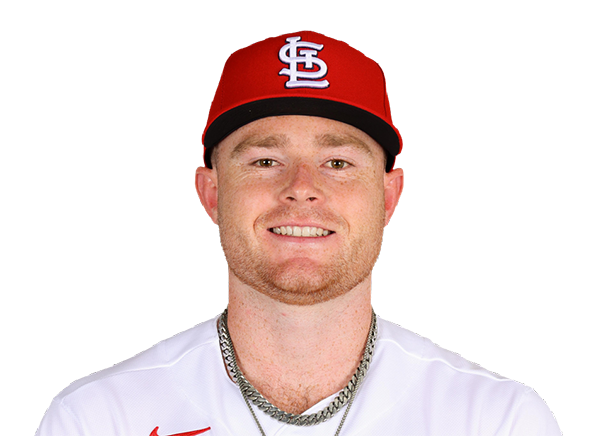 Nathan Church | 0-3 | 3 | 0 | 0 | 0 | 0 | 1 | 0 | 18 | .250 | .297 | .370 |
 Masyn Winn | 1-3 | 3 | 1 | 1 | 0 | 0 | 0 | 0 | 17 | .237 | .311 | .323 |
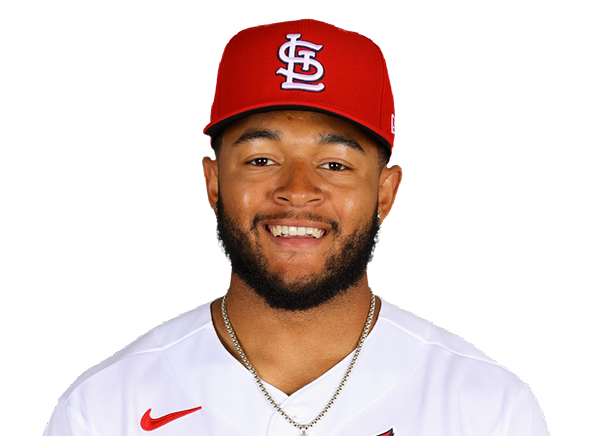 Victor Scott II | 0-1 | 1 | 0 | 0 | 0 | 0 | 0 | 0 | 1 | .195 | .275 | .258 |
 Jose Fermin | 1-2 | 2 | 1 | 1 | 0 | 0 | 0 | 0 | 6 | .242 | .306 | .353 |
San Francisco Giants
| Player | IP | H | R | ER | BB | K | HR | PC-ST | ERA | PC |
|---|---|---|---|---|---|---|---|---|---|---|
 Blade Tidwell | 6.2 | 3 | 2 | 2 | 1 | 4 | 1 | 95-62 | 4.56 | 95 |
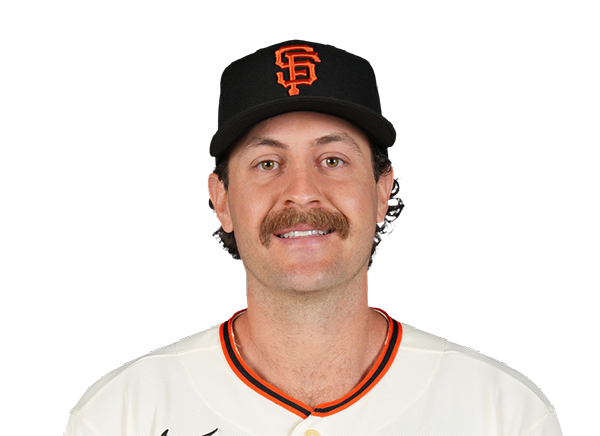 Jason Foley | 1.1 | 2 | 1 | 1 | 0 | 1 | 0 | 31-18 | 4.15 | 31 |
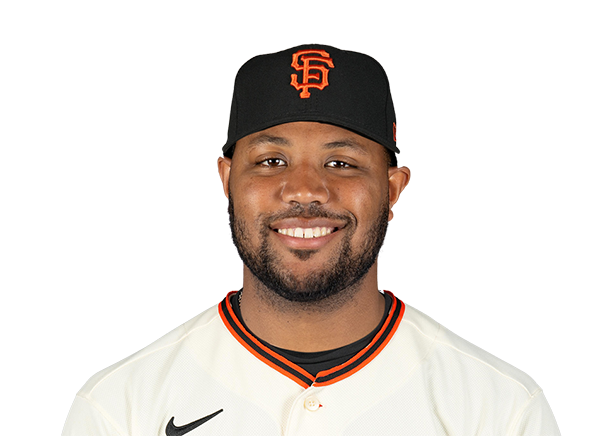 Dylan Smith | 1.0 | 0 | 0 | 0 | 1 | 0 | 0 | 14-6 | 3.06 | 14 |
St. Louis Cardinals
| Player | IP | H | R | ER | BB | K | HR | PC-ST | ERA | PC |
|---|---|---|---|---|---|---|---|---|---|---|
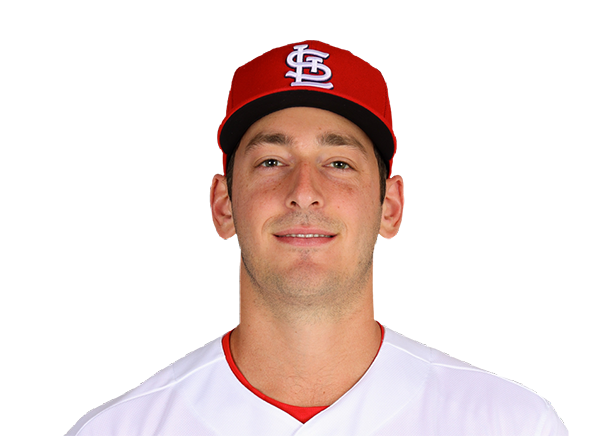 Andre Pallante | 5.0 | 8 | 8 | 6 | 2 | 2 | 1 | 99-60 | 3.70 | 99 |
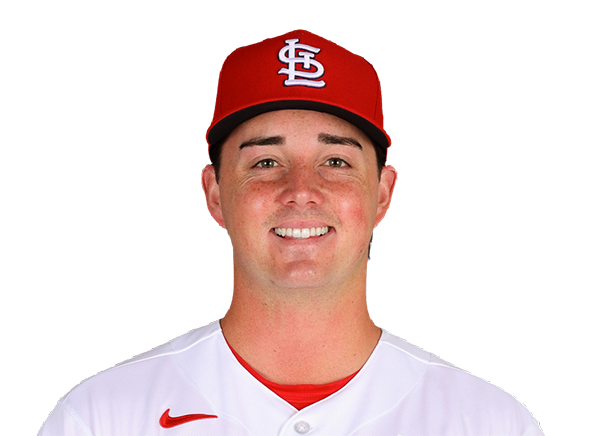 Brycen Mautz | 2.1 | 2 | 1 | 1 | 2 | 4 | 0 | 40-22 | 7.94 | 40 |
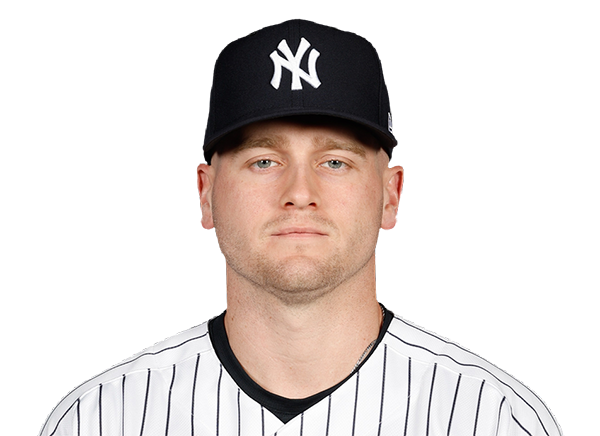 Cade Winquest | 1.2 | 2 | 1 | 1 | 1 | 5 | 1 | 41-25 | 6.48 | 41 |
H2H / Season Series
STL3–10
SF
STL2–1
SF
SF7–6
STL
SF2–1
STL
SF5–4
STL
Last 5 Games
| Date | Opponent | Result |
|---|---|---|
| Sep 15 | @ STL | W10–3 |
| Sep 14 | @ STL | L1–2 |
| Sep 13 |  vs SD | L4–6 |
| Sep 12 | vs SD | L6–7 |
| Sep 11 | vs SD | L5–7 |
| Date | Opponent | Result |
|---|---|---|
| Sep 15 | vs SF | L3–10 |
| Sep 14 | vs SF | W2–1 |
| Sep 13 |  vs CHW | W3–1 |
| Sep 12 | vs CHW | L5–6 |
| Sep 11 | vs CHW | W7–3 |
Standings
American League
| Team | W | L | PCT | GB | DIFF | STRK |
|---|---|---|---|---|---|---|
1 Rays | 91 | 59 | .607 | - | +70 | W4 |
| 2White Sox | 77 | 74 | .510 | 14.5 | +37 | L1 |
3 Astros | 76 | 75 | .503 | 15.5 | -51 | W1 |
4 Yankees | 88 | 63 | .583 | 3.5 | +137 | W3 |
5 Red Sox | 82 | 69 | .543 | 9.5 | +86 | L1 |
6 Guardians | 77 | 75 | .507 | 15 | -10 | W1 |
7 Rangers | 75 | 76 | .497 | 16.5 | -42 | W3 |
8 Blue Jays | 75 | 77 | .493 | 17 | -41 | L2 |
9 Orioles | 74 | 78 | .487 | 18 | -32 | W2 |
10 Tigers | 72 | 79 | .477 | 19.5 | +80 | W6 |
11 Twins | 70 | 81 | .464 | 21.5 | -74 | L3 |
12 Mariners | 70 | 82 | .461 | 22 | -61 | L3 |
13 Royals | 66 | 85 | .437 | 25.5 | -96 | L3 |
14 Athletics | 61 | 90 | .404 | 30.5 | -204 | L1 |
15 Angels | 58 | 93 | .384 | 33.5 | -73 | W2 |
National League
| Team | W | L | PCT | GB | DIFF | STRK |
|---|---|---|---|---|---|---|
1 Brewers | 94 | 57 | .623 | - | +199 | W1 |
2 Dodgers | 92 | 59 | .609 | 2 | +177 | W2 |
3 Braves | 89 | 63 | .586 | 5.5 | +115 | W1 |
4 Cubs | 84 | 68 | .553 | 10.5 | +139 | L1 |
5 Phillies | 83 | 68 | .550 | 11 | +28 | L1 |
| 6Padres | 82 | 69 | .543 | 12 | +17 | L1 |
7 Diamondbacks | 80 | 72 | .526 | 14.5 | +1 | L1 |
8 Pirates | 75 | 76 | .497 | 19 | +22 | L1 |
9 Marlins | 75 | 77 | .493 | 19.5 | +7 | W1 |
| 10Cardinals | 75 | 77 | .493 | 19.5 | -13 | L1 |
11 Nationals | 71 | 81 | .467 | 23.5 | +6 | W4 |
12 Reds | 70 | 81 | .464 | 24 | -152 | L2 |
13 Mets | 69 | 82 | .457 | 25 | -37 | L3 |
| 14Giants | 63 | 89 | .414 | 31.5 | -71 | W1 |
15 Rockies | 56 | 95 | .371 | 38 | -164 | W1 |
SF
VS
STL
Pitchers
Blade Tidwell
Catchers
Drew Cavanaugh
Infielders
Bryce Eldridge
Jonah Cox
Osleivis Basabe
Christian Koss
Outfielders
Drew Gilbert
Turner Hill
Grant McCray
Designated Hitters
Jung Hoo Lee
Pitchers
Andre Pallante
Catchers
Leo Bernal
Infielders
Alec Burleson
Thomas Saggese
Masyn Winn
Jose Fermin
Outfielders
Bryan Torres
Jordan Walker
Nathan Church
Designated Hitters
Ivan Herrera
Giants
VS
Cardinals
Batting
152
Team Games Played
152
5152
At Bats
5127
1275
Hits
1245
622
Runs Batted In
668
174
Home Runs
158
75
Stolen Bases
96
.247
Batting Average
.243
643
Runs
688
251
Doubles
220
25
Triples
14
2098
Total Bases
1967
425
Walks
484
1228
Strikeouts
1194
.309
On Base Percentage
.316
.407
Slugging Percentage
.384
.716
OBP Pct + SLG Pct
.700
152
Games Played
152
152
Games Started
152
51
Hit By Pitch
91
0.0
Wins Above Replacement
0.0
0.0
Offensive Wins Above Replacement
0.0
23
Caught Stealing
25
1
Is Qualified
1
655.8
Runs Created
636.0
4.4
Runs Created Per 27 Outs
4.2
.074
Walks Per Plate Appearance
.084
0.35
Walk To Strikeout Ratio
0.41
.160
Isolated Power
.141
.252
Secondary Average
.249
3.86
Pitches Per Plate Appearance
3.86
450
Extra Base Hits
392
5705
Plate Appearances
5776
29.6
At Bats Per Home Run
32.4
35
Sacrifice Hit
19
41
Sacrifice Flies
53
Pitching
152
Team Games Played
152
51
Quality Starts
51
63
Wins
75
89
Losses
77
28
Saves
45
81
Holds
95
1260
Hits
1306
650
Earned runs
646
144
Home Runs
151
564
Walks
528
1132
Strikeouts
1211
7.6
Strikeouts Per 9 Innings
8.0
148.0
Pitches Per Start
149.9
1.36
Walks Plus Hits Per Inning Pitched
1.35
4.36
Earned Run Average
4.29
89
Losses
77
1341.0
Innings pitched
1354.2
.414
Win Percentage
.493
52
Save Opportunities
75
.248
Opponent Batting Average
.254
.328
Opponent's On-base pct.
.329
.389
Opponent's Slugging pct.
.399
.717
Opponent's OPB Pct + SLG Pct
.728
5079
At Bats
5151
218
Doubles
267
32
Triples
14
65
Batters Hit
73
130
Stolen Bases
108
152
Games Played
152
1
Complete Games
1
10
Shutouts
9
53
Wild Pitches
60
673
Runs Batted In
667
5
Balks
3
1341.0
Innings pitched
1354.2
7.6
Strikeouts Per 9 Innings
8.0
36
Caught Stealing
25
152
Games Started
152
0.0
Wins Above Replacement
0.0
1
Is Qualified
1
714
Runs
701
650
Earned Runs
646
1974
Total Bases
2054
Fielding
152
Team Games Played
152
1341
Full Innings
1355
5553
Total Chances
5547
4023
Putouts
4064
1430
Assists
1417
100
Errors
66
251
Double Plays
220
0.982
Fielding Percentage
0.988
36.6
Range Factor
36.4
0.0
Zone Rating
0.0
152
Games Played
152
0
Games Started
0
0.0
Defensive Wins Above Replacement
0.0
1
Qualified
1