

Giants vs Cardinals Live Score (16 Sep, 2026)
Game Information
Stage
STD
Season
2026
First Pitch
Wed, Sep 16, 1:15 pm
Venue
Busch Stadium
Location
St. Louis, Missouri
Venue Type
Outdoor
Broadcast
MLB.TV
Attendance
24,960
Live Situation
1Balls
0Strikes
0Outs
—Pitcher
—At Bat
Pitch Sequence
1
BALL
Sinker
93 MPH
2
BALL IN PLAY
Sinker
94 MPH
Injury Report




Team Stats
 SF
STL


6
Runs
5
13
Hits
5
2
Errors
2
1
Home Runs
0
4
Walks
7
5
Strikeouts
10
Player Box Score
San Francisco Giants
| Player | H-AB | AB | R | H | RBI | HR | BB | K | #P | AVG | OBP | SLG |
|---|---|---|---|---|---|---|---|---|---|---|---|---|
 Jonah Cox | 3-4 | 4 | 1 | 3 | 1 | 0 | 1 | 1 | 18 | .294 | .333 | .445 |
 Bryce Eldridge | 0-3 | 3 | 0 | 0 | 0 | 0 | 2 | 1 | 20 | .269 | .364 | .461 |
 Grant McCray | 0-0 | 0 | 1 | 0 | 0 | 0 | 0 | 0 | 0 | .155 | .259 | .296 |
 Brett Harris | 1-4 | 4 | 0 | 1 | 0 | 0 | 0 | 1 | 11 | .118 | .286 | .176 |
 Drew Gilbert | 1-1 | 1 | 1 | 1 | 2 | 1 | 0 | 0 | 1 | .233 | .322 | .387 |
 Jung Hoo Lee | 0-4 | 4 | 0 | 0 | 0 | 0 | 1 | 1 | 20 | .274 | .317 | .397 |
 Shay Whitcomb | 2-5 | 5 | 1 | 2 | 0 | 0 | 0 | 0 | 16 | .194 | .219 | .355 |
|
Turner Hill | 1-5 | 5 | 0 | 1 | 0 | 0 | 0 | 0 | 15 | .247 | .343 | .353 |
 Andrew Knizner | 3-4 | 4 | 1 | 3 | 1 | 0 | 0 | 0 | 14 | .212 | .293 | .385 |
|
Scott Bandura | 1-4 | 4 | 0 | 1 | 0 | 0 | 0 | 0 | 10 | .200 | .273 | .300 |
 Osleivis Basabe | 0-0 | 0 | 0 | 0 | 0 | 0 | 0 | 0 | 0 | .202 | .262 | .353 |
 Christian Koss | 1-4 | 4 | 1 | 1 | 0 | 0 | 0 | 1 | 13 | .240 | .285 | .337 |
St. Louis Cardinals
| Player | H-AB | AB | R | H | RBI | HR | BB | K | #P | AVG | OBP | SLG |
|---|---|---|---|---|---|---|---|---|---|---|---|---|
 JJ Wetherholt | 0-3 | 3 | 0 | 0 | 0 | 0 | 0 | 1 | 9 | .240 | .341 | .368 |
 Jose Fermin | 0-1 | 1 | 0 | 0 | 1 | 0 | 0 | 0 | 6 | .241 | .304 | .352 |
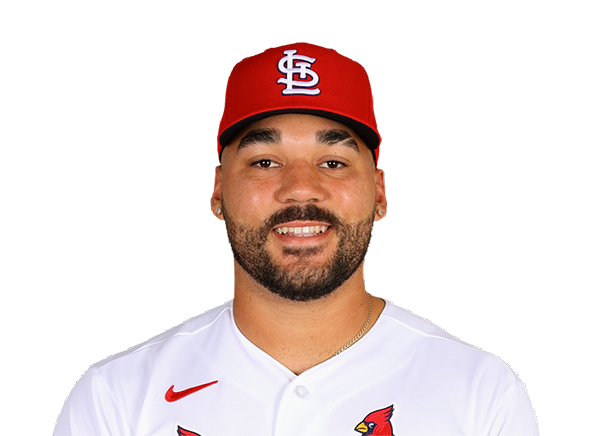 Leo Bernal | 1-5 | 5 | 0 | 1 | 1 | 0 | 0 | 2 | 24 | .295 | .338 | .492 |
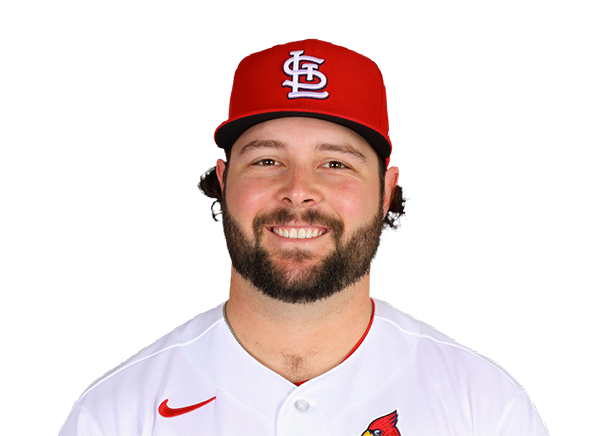 Alec Burleson | 1-5 | 5 | 1 | 1 | 0 | 0 | 0 | 2 | 17 | .284 | .350 | .471 |
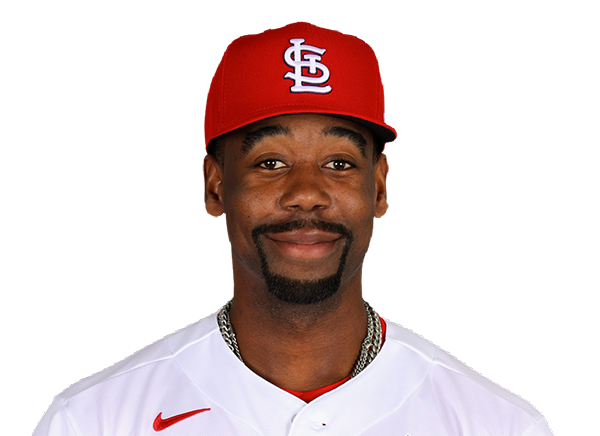 Jordan Walker | 0-3 | 3 | 1 | 0 | 0 | 0 | 2 | 2 | 18 | .278 | .336 | .482 |
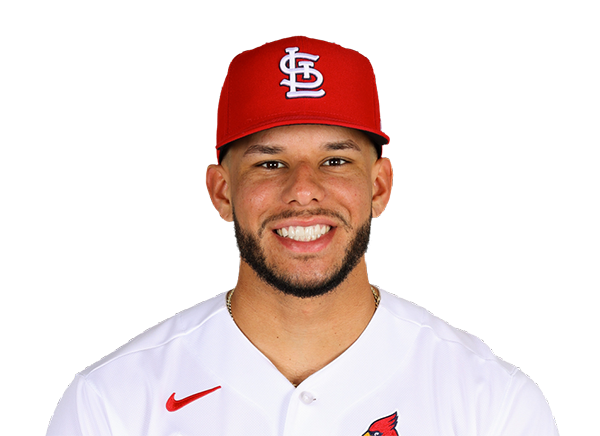 Joshua Baez | 0-4 | 4 | 0 | 0 | 0 | 0 | 0 | 0 | 16 | .230 | .278 | .510 |
 Riley O'Brien | 0-0 | 0 | 0 | 0 | 0 | 0 | 0 | 0 | 0 | .000 | .000 | .000 |
 Bryan Torres | 0-0 | 0 | 0 | 0 | 0 | 0 | 1 | 0 | 6 | .250 | .326 | .362 |
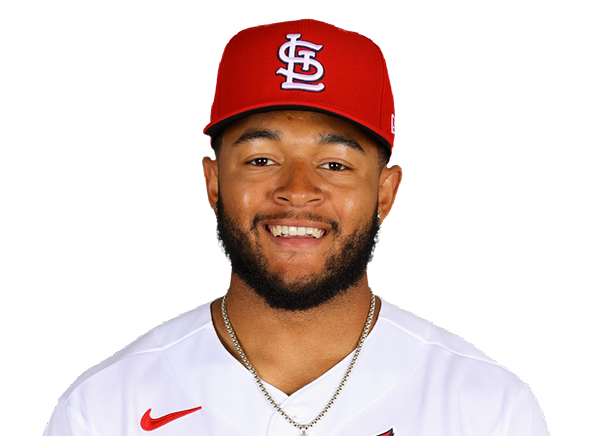 Victor Scott II | 0-0 | 0 | 0 | 0 | 0 | 0 | 0 | 0 | 0 | .195 | .275 | .258 |
 Nolan Gorman | 0-3 | 3 | 1 | 0 | 0 | 0 | 2 | 0 | 22 | .186 | .268 | .314 |
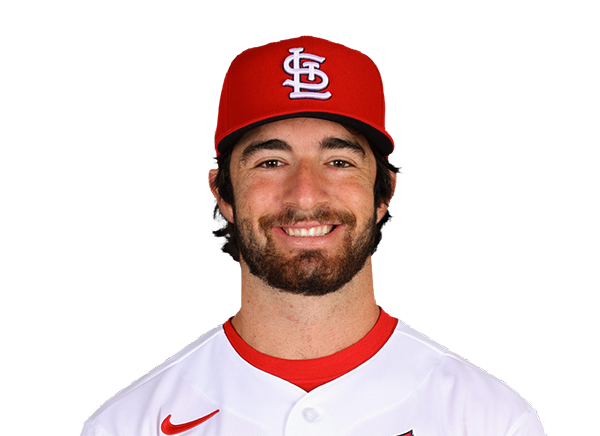 Thomas Saggese | 1-4 | 4 | 2 | 1 | 1 | 0 | 0 | 1 | 19 | .267 | .315 | .407 |
 Nathan Church | 2-5 | 5 | 0 | 2 | 0 | 0 | 0 | 1 | 22 | .252 | .298 | .370 |
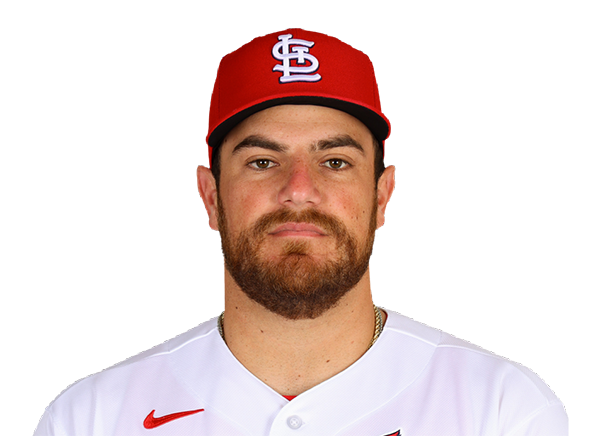 Pedro Pages | 0-2 | 2 | 0 | 0 | 0 | 0 | 1 | 1 | 10 | .209 | .263 | .308 |
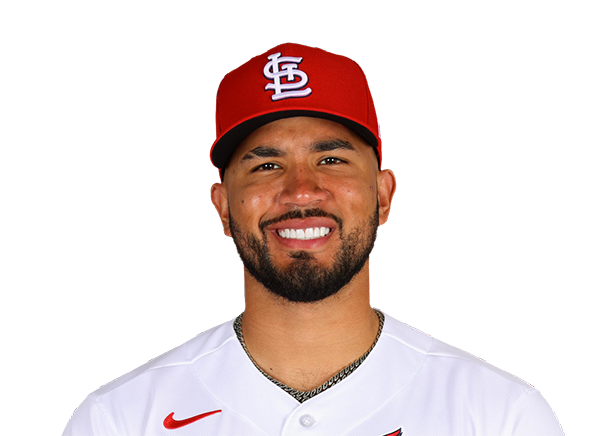 Ivan Herrera | 0-0 | 0 | 0 | 0 | 0 | 0 | 1 | 0 | 6 | .242 | .355 | .374 |
 Masyn Winn | 0-0 | 0 | 0 | 0 | 0 | 0 | 0 | 0 | 0 | .237 | .311 | .323 |
San Francisco Giants
| Player | IP | H | R | ER | BB | K | HR | PC-ST | ERA | PC |
|---|---|---|---|---|---|---|---|---|---|---|
 Anthony Molina | 5.2 | 2 | 0 | 0 | 1 | 6 | 0 | 82-57 | 4.18 | 82 |
 Philip Abner | 0.1 | 0 | 0 | 0 | 0 | 1 | 0 | 4-3 | 5.09 | 4 |
 Carson Seymour | 0.2 | 0 | 2 | 0 | 2 | 0 | 0 | 29-17 | 5.06 | 29 |
 Trent Harris | 1.1 | 1 | 0 | 0 | 0 | 2 | 0 | 14-10 | 2.33 | 14 |
 Dylan Smith | 0.2 | 2 | 2 | 2 | 2 | 1 | 0 | 28-15 | 3.50 | 28 |
 Reiver Sanmartin | 0.1 | 0 | 0 | 0 | 0 | 0 | 0 | 1-1 | 4.22 | 1 |
 Joel Kuhnel | 1.0 | 0 | 1 | 0 | 2 | 0 | 0 | 17-7 | 4.54 | 17 |
St. Louis Cardinals
| Player | IP | H | R | ER | BB | K | HR | PC-ST | ERA | PC |
|---|---|---|---|---|---|---|---|---|---|---|
 Matthew Liberatore | 6.0 | 6 | 1 | 1 | 3 | 2 | 0 | 81-51 | 5.36 | 81 |
 Luis Gastelum | 1.0 | 2 | 2 | 1 | 0 | 2 | 0 | 17-12 | 4.64 | 17 |
 Justin Bruihl | 0.2 | 1 | 1 | 0 | 0 | 0 | 0 | 10-7 | 3.54 | 10 |
 Gordon Graceffo | 1.1 | 2 | 0 | 0 | 0 | 1 | 0 | 14-10 | 2.56 | 14 |
|
Riley O'Brien | 1.0 | 2 | 2 | 1 | 1 | 0 | 1 | 16-9 | 4.21 | 16 |
H2H / Season Series
STL5–6
SF
STL3–10
SF
STL2–1
SF
SF7–6
STL
SF2–1
STL
SF5–4
STL
Last 5 Games
| Date | Opponent | Result |
|---|---|---|
| Sep 16 | @ STL | W6–5 |
| Sep 15 | @ STL | W10–3 |
| Sep 14 | @ STL | L1–2 |
| Sep 13 |  vs SD | L4–6 |
| Sep 12 | vs SD | L6–7 |
| Date | Opponent | Result |
|---|---|---|
| Sep 16 | vs SF | L5–6 |
| Sep 15 | vs SF | L3–10 |
| Sep 14 | vs SF | W2–1 |
| Sep 13 |  vs CHW | W3–1 |
| Sep 12 | vs CHW | L5–6 |
Standings
American League
| Team | W | L | PCT | GB | DIFF | STRK |
|---|---|---|---|---|---|---|
1 Rays | 92 | 59 | .609 | - | +71 | W5 |
2 Guardians | 78 | 75 | .510 | 15 | -7 | W2 |
3 Astros | 76 | 76 | .500 | 16.5 | -54 | L1 |
4 Yankees | 88 | 64 | .579 | 4.5 | +136 | L1 |
5 Red Sox | 82 | 70 | .539 | 10.5 | +82 | L2 |
| 6White Sox | 77 | 75 | .507 | 15.5 | +34 | L2 |
7 Rangers | 76 | 76 | .500 | 16.5 | -38 | W4 |
8 Blue Jays | 76 | 77 | .497 | 17 | -37 | W1 |
9 Orioles | 75 | 78 | .490 | 18 | -26 | W3 |
10 Tigers | 72 | 80 | .474 | 20.5 | +76 | L1 |
11 Twins | 71 | 81 | .467 | 21.5 | -73 | W1 |
12 Mariners | 70 | 82 | .461 | 22.5 | -61 | L3 |
13 Royals | 67 | 85 | .441 | 25.5 | -93 | W1 |
14 Athletics | 61 | 91 | .401 | 31.5 | -205 | L2 |
15 Angels | 58 | 93 | .384 | 34 | -73 | W2 |
National League
| Team | W | L | PCT | GB | DIFF | STRK |
|---|---|---|---|---|---|---|
1 Brewers | 95 | 57 | .625 | - | +200 | W2 |
2 Dodgers | 92 | 60 | .605 | 3 | +173 | L1 |
3 Braves | 89 | 64 | .582 | 6.5 | +111 | L1 |
4 Cubs | 85 | 68 | .556 | 10.5 | +143 | W1 |
5 Phillies | 84 | 68 | .553 | 11 | +31 | W1 |
| 6Padres | 83 | 69 | .546 | 12 | +23 | W1 |
7 Diamondbacks | 80 | 72 | .526 | 15 | +1 | L1 |
8 Marlins | 75 | 77 | .493 | 20 | +7 | W1 |
9 Pirates | 75 | 77 | .493 | 20 | +21 | L2 |
| 10Cardinals | 75 | 78 | .490 | 20.5 | -14 | L2 |
11 Reds | 71 | 81 | .467 | 24 | -148 | W1 |
12 Nationals | 71 | 82 | .464 | 24.5 | +3 | L1 |
13 Mets | 69 | 83 | .454 | 26 | -43 | L4 |
| 14Giants | 64 | 89 | .418 | 31.5 | -70 | W2 |
15 Rockies | 56 | 96 | .368 | 39 | -170 | L1 |
SF
VS
STL
Pitchers
Anthony Molina
Catchers
Andrew Knizner
Infielders
Bryce Eldridge
Brett Harris
Shay Whitcomb
Christian Koss
Outfielders
Jonah Cox
Turner Hill
Scott Bandura
Designated Hitters
Jung Hoo Lee
Pitchers
Matthew Liberatore
Catchers
Pedro Pages
Infielders
JJ Wetherholt
Alec Burleson
Nolan Gorman
Thomas Saggese
Outfielders
Jordan Walker
Joshua Baez
Nathan Church
Designated Hitters
Leo Bernal
Giants
VS
Cardinals
Batting
153
Team Games Played
153
5190
At Bats
5162
1288
Hits
1250
626
Runs Batted In
671
175
Home Runs
158
77
Stolen Bases
97
.248
Batting Average
.242
649
Runs
693
252
Doubles
221
25
Triples
14
2115
Total Bases
1973
429
Walks
491
1233
Strikeouts
1204
.310
On Base Percentage
.316
.408
Slugging Percentage
.382
.717
OBP Pct + SLG Pct
.698
153
Games Played
153
153
Games Started
153
52
Hit By Pitch
91
0.0
Wins Above Replacement
0.0
0.0
Offensive Wins Above Replacement
0.0
25
Caught Stealing
25
1
Is Qualified
1
662.1
Runs Created
638.3
4.4
Runs Created Per 27 Outs
4.2
.075
Walks Per Plate Appearance
.084
0.35
Walk To Strikeout Ratio
0.41
.159
Isolated Power
.140
.252
Secondary Average
.249
3.85
Pitches Per Plate Appearance
3.86
452
Extra Base Hits
393
5748
Plate Appearances
5820
29.7
At Bats Per Home Run
32.7
35
Sacrifice Hit
19
41
Sacrifice Flies
55
Pitching
153
Team Games Played
153
51
Quality Starts
52
64
Wins
75
89
Losses
78
29
Saves
45
84
Holds
95
1265
Hits
1319
652
Earned runs
649
144
Home Runs
152
571
Walks
532
1142
Strikeouts
1216
7.6
Strikeouts Per 9 Innings
8.0
148.2
Pitches Per Start
149.8
1.36
Walks Plus Hits Per Inning Pitched
1.36
4.34
Earned Run Average
4.28
89
Losses
78
1351.0
Innings pitched
1364.2
.418
Win Percentage
.490
54
Save Opportunities
75
.247
Opponent Batting Average
.254
.328
Opponent's On-base pct.
.330
.387
Opponent's Slugging pct.
.399
.715
Opponent's OPB Pct + SLG Pct
.729
5114
At Bats
5189
219
Doubles
268
32
Triples
14
65
Batters Hit
74
131
Stolen Bases
110
153
Games Played
153
1
Complete Games
1
10
Shutouts
9
54
Wild Pitches
60
676
Runs Batted In
671
5
Balks
3
1351.0
Innings pitched
1364.2
7.6
Strikeouts Per 9 Innings
8.0
36
Caught Stealing
27
153
Games Started
153
0.0
Wins Above Replacement
0.0
1
Is Qualified
1
719
Runs
707
652
Earned Runs
649
1980
Total Bases
2071
Fielding
153
Team Games Played
153
1351
Full Innings
1365
5590
Total Chances
5590
4053
Putouts
4094
1435
Assists
1428
102
Errors
68
252
Double Plays
221
0.982
Fielding Percentage
0.988
36.6
Range Factor
36.4
0.0
Zone Rating
0.0
153
Games Played
153
0
Games Started
0
0.0
Defensive Wins Above Replacement
0.0
1
Qualified
1