

Giants vs Guardians Live Score (20 Aug, 2026)
Game Information
Stage
Standard
Season
2026
First Pitch
Thu, Aug 20, 1:10 pm
Venue
Progressive Field
Location
Cleveland, Ohio
Attendance
0
Live Situation
0Balls
1Strikes
2Outs
Gavin WilliamsPitcher
Bryce EldridgeAt Bat
Pitch 1 : Strike 1 Looking
Pitch Sequence
1
STRIKE LOOKING
Curve
81 MPH
Injury Report



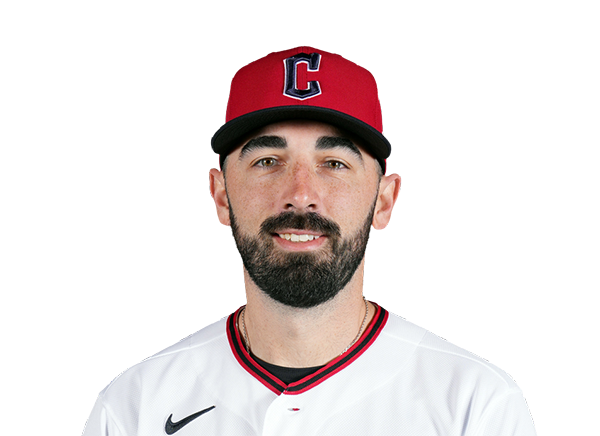
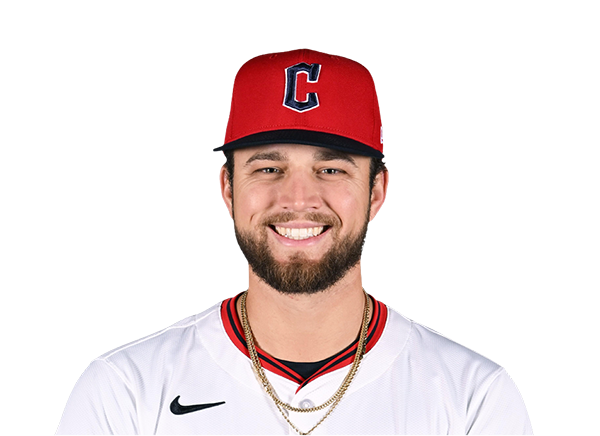

Team Stats
 SF
CLE


0
Runs
0
0
Hits
0
0
Errors
0
0
Home Runs
0
1
Walks
0
2
Strikeouts
0
Player Box Score
San Francisco Giants
| Player | H-AB | AB | R | H | RBI | HR | BB | K | #P | AVG | OBP | SLG |
|---|---|---|---|---|---|---|---|---|---|---|---|---|
 Drew Gilbert | 0-1 | 1 | 0 | 0 | 0 | 0 | 0 | 1 | 5 | .238 | .325 | .366 |
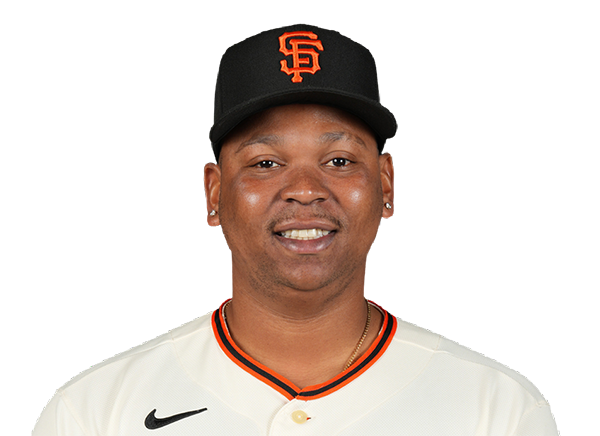 Rafael Devers | 0-0 | 0 | 0 | 0 | 0 | 0 | 1 | 0 | 5 | .244 | .318 | .471 |
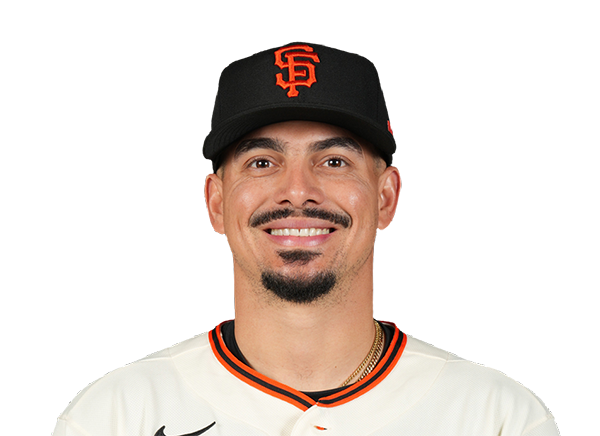 Willy Adames | 0-1 | 1 | 0 | 0 | 0 | 0 | 0 | 1 | 3 | .228 | .288 | .415 |
 Bryce Eldridge | 0-0 | 0 | 0 | 0 | 0 | 0 | 0 | 0 | 1 | .247 | .339 | .439 |
 Jung Hoo Lee | 0-0 | 0 | 0 | 0 | 0 | 0 | 0 | 0 | 0 | .294 | .329 | .435 |
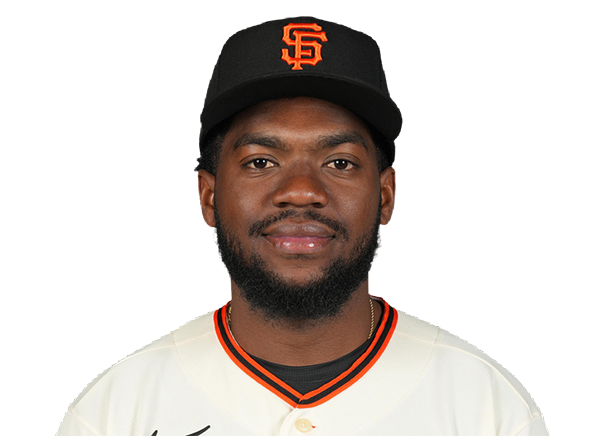 Osleivis Basabe | 0-0 | 0 | 0 | 0 | 0 | 0 | 0 | 0 | 0 | .250 | .281 | .433 |
 Turner Hill | 0-0 | 0 | 0 | 0 | 0 | 0 | 0 | 0 | 0 | .286 | .333 | .429 |
|
Drew Cavanaugh | 0-0 | 0 | 0 | 0 | 0 | 0 | 0 | 0 | 0 | .241 | .348 | .253 |
 Christian Koss | 0-0 | 0 | 0 | 0 | 0 | 0 | 0 | 0 | 0 | .195 | .222 | .241 |
Cleveland Guardians
| Player | H-AB | AB | R | H | RBI | HR | BB | K | #P | AVG | OBP | SLG |
|---|---|---|---|---|---|---|---|---|---|---|---|---|
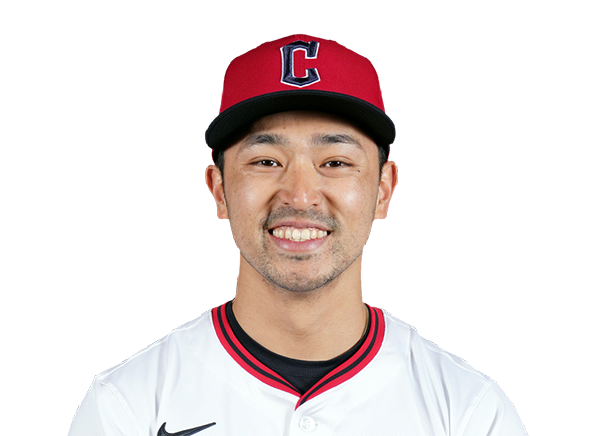 Steven Kwan | 0-0 | 0 | 0 | 0 | 0 | 0 | 0 | 0 | 0 | .264 | .368 | .326 |
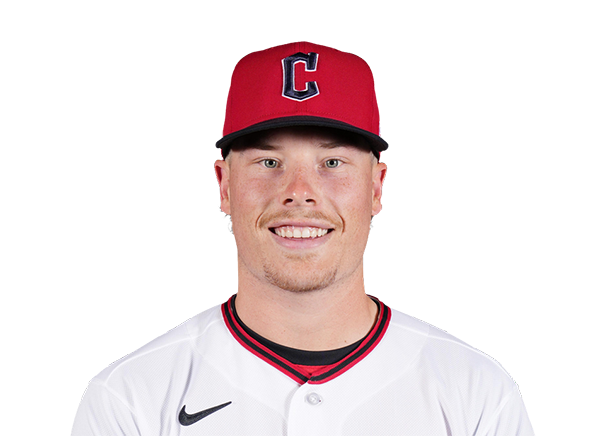 Travis Bazzana | 0-0 | 0 | 0 | 0 | 0 | 0 | 0 | 0 | 0 | .233 | .327 | .369 |
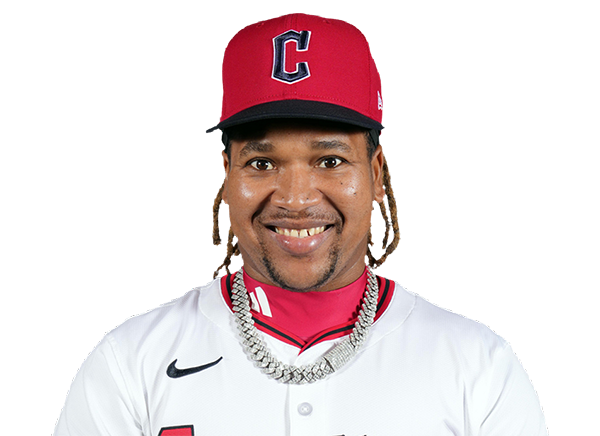 Jose Ramirez | 0-0 | 0 | 0 | 0 | 0 | 0 | 0 | 0 | 0 | .238 | .341 | .384 |
 Nathaniel Lowe | 0-0 | 0 | 0 | 0 | 0 | 0 | 0 | 0 | 0 | .266 | .334 | .483 |
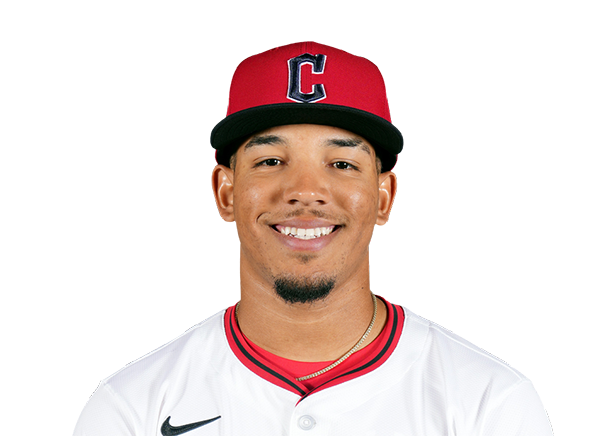 Angel Genao | 0-0 | 0 | 0 | 0 | 0 | 0 | 0 | 0 | 0 | .341 | .413 | .463 |
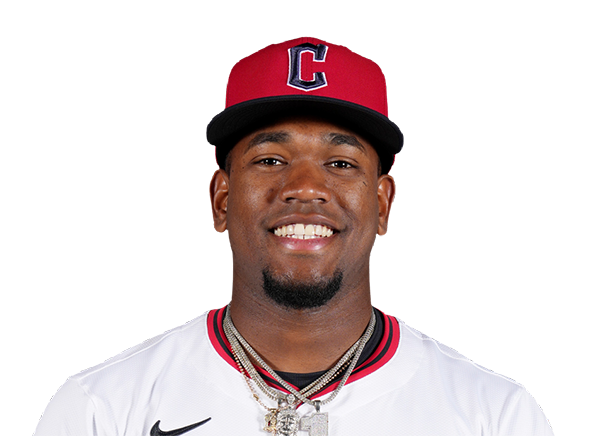 Angel Martinez | 0-0 | 0 | 0 | 0 | 0 | 0 | 0 | 0 | 0 | .241 | .273 | .429 |
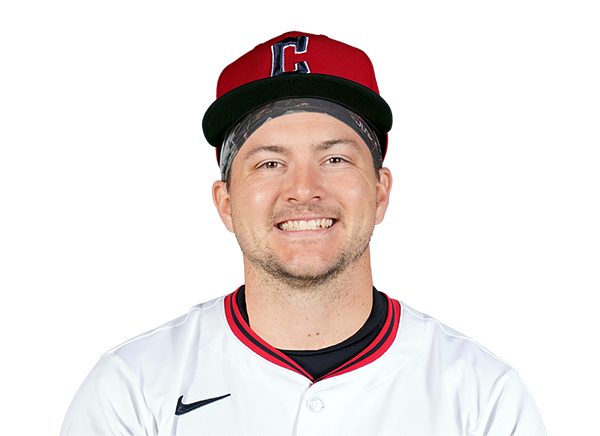 Patrick Bailey | 0-0 | 0 | 0 | 0 | 0 | 0 | 0 | 0 | 0 | .183 | .240 | .290 |
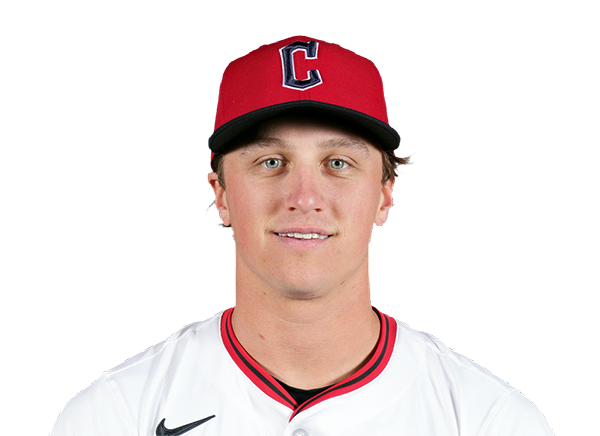 Petey Halpin | 0-0 | 0 | 0 | 0 | 0 | 0 | 0 | 0 | 0 | .214 | .242 | .310 |
 Brayan Rocchio | 0-0 | 0 | 0 | 0 | 0 | 0 | 0 | 0 | 0 | .251 | .314 | .372 |
San Francisco Giants
| Player | IP | H | R | ER | BB | K | HR | PC-ST | ERA | PC |
|---|---|---|---|---|---|---|---|---|---|---|
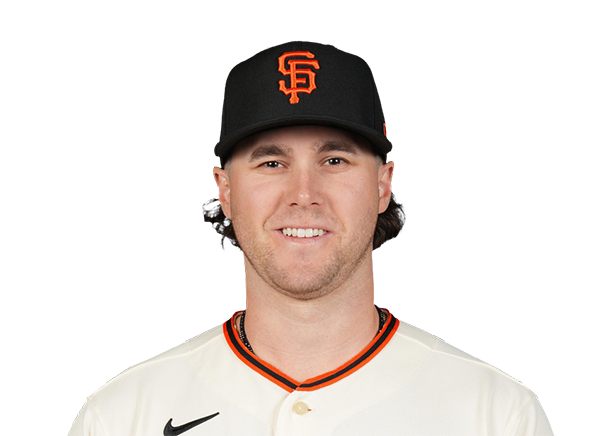 Landen Roupp | 0.0 | 0 | 0 | 0 | 0 | 0 | 0 | 0-0 | 4.31 | 0 |
Cleveland Guardians
| Player | IP | H | R | ER | BB | K | HR | PC-ST | ERA | PC |
|---|---|---|---|---|---|---|---|---|---|---|
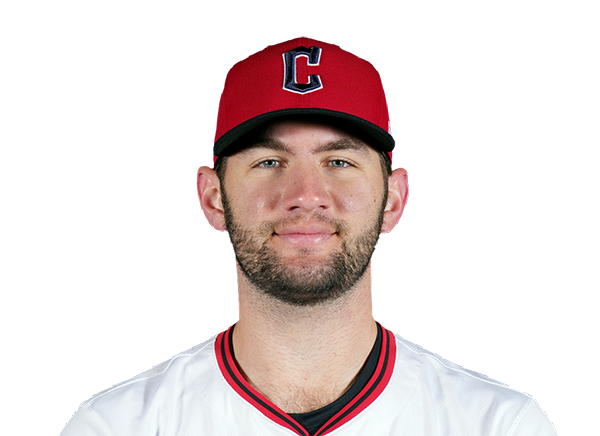 Gavin Williams | 0.2 | 0 | 0 | 0 | 1 | 2 | 0 | 14-8 | 3.73 | 14 |
H2H / Season Series
CLE0–0
SF
CLE0–1
SF
CLE8–1
SF
SF10–7
CLE
CLE4–5
SF
Last 5 Games
| Date | Opponent | Result |
|---|---|---|
| Aug 19 | @ CLE | W1–0 |
| Aug 18 | @ CLE | L1–8 |
| Aug 16 |  vs COL | L7–13 |
| Aug 15 | vs COL | W7–1 |
| Aug 14 | vs COL | L2–5 |
| Date | Opponent | Result |
|---|---|---|
| Aug 19 | vs SF | L0–1 |
| Aug 18 | vs SF | W8–1 |
| Aug 16 |  vs SD | L0–5 |
| Aug 15 | vs SD | W6–1 |
| Aug 14 | vs SD | L5–7 |
Standings
American League
| Team | W | L | PCT | GB | DIFF | STRK |
|---|---|---|---|---|---|---|
1 Rays | 76 | 53 | .589 | - | +42 | L3 |
2 White Sox | 67 | 62 | .519 | 9 | +42 | L1 |
3 Astros | 65 | 65 | .500 | 11.5 | -43 | L1 |
4 Yankees | 73 | 56 | .566 | 3 | +95 | L1 |
5 Red Sox | 70 | 59 | .543 | 6 | +98 | W2 |
6 Rangers | 64 | 66 | .492 | 12.5 | -48 | L1 |
| 7Guardians | 64 | 66 | .492 | 12.5 | -14 | W3 |
8 Blue Jays | 64 | 67 | .489 | 13 | -50 | W1 |
9 Twins | 63 | 67 | .485 | 13.5 | -47 | L2 |
10 Orioles | 63 | 67 | .485 | 13.5 | -33 | W2 |
11 Mariners | 62 | 68 | .477 | 14.5 | -44 | W2 |
12 Tigers | 61 | 68 | .473 | 15 | +77 | L4 |
13 Royals | 57 | 74 | .435 | 20 | -95 | W7 |
14 Angels | 52 | 78 | .400 | 24.5 | -68 | W1 |
15 Athletics | 50 | 80 | .385 | 26.5 | -188 | W1 |
National League
| Team | W | L | PCT | GB | DIFF | STRK |
|---|---|---|---|---|---|---|
1 Brewers | 81 | 49 | .623 | - | +163 | W3 |
2 Dodgers | 79 | 51 | .608 | 2 | +147 | W5 |
3 Braves | 75 | 55 | .577 | 6 | +108 | L2 |
4 Cubs | 74 | 56 | .569 | 7 | +98 | L3 |
5 Phillies | 72 | 58 | .554 | 9 | +25 | W8 |
| 6Padres | 70 | 60 | .538 | 11 | +9 | W2 |
7 Diamondbacks | 68 | 62 | .523 | 13 | +7 | L1 |
8 Marlins | 66 | 64 | .508 | 15 | +17 | W2 |
9 Cardinals | 66 | 65 | .504 | 15.5 | 0 | L2 |
10 Pirates | 63 | 68 | .481 | 18.5 | +29 | L2 |
11 Reds | 62 | 68 | .477 | 19 | -92 | W1 |
12 Nationals | 61 | 70 | .466 | 20.5 | +14 | L3 |
13 Mets | 59 | 71 | .454 | 22 | -39 | W1 |
| 14Giants | 52 | 77 | .403 | 28.5 | -79 | L3 |
| 15Rockies | 50 | 79 | .388 | 30.5 | -131 | L5 |
SF
VS
CLE
Pitchers
Landen Roupp
Catchers
Drew Cavanaugh
Infielders
Willy Adames
Bryce Eldridge
Osleivis Basabe
Christian Koss
Outfielders
Drew Gilbert
Jung Hoo Lee
Turner Hill
Designated Hitters
Rafael Devers
Pitchers
Gavin Williams
Catchers
Patrick Bailey
Infielders
Jose Ramirez
Nathaniel Lowe
Angel Genao
Brayan Rocchio
Outfielders
Steven Kwan
Angel Martinez
Petey Halpin
Designated Hitters
Travis Bazzana
Giants
VS
Guardians
Batting
126
Team Games Played
127
4280
At Bats
4215
1062
Hits
982
491
Runs Batted In
479
138
Home Runs
120
56
Stolen Bases
122
.248
Batting Average
.233
511
Runs
502
212
Doubles
191
24
Triples
11
1736
Total Bases
1555
329
Walks
460
994
Strikeouts
1039
.306
On Base Percentage
.312
.406
Slugging Percentage
.369
.711
OBP Pct + SLG Pct
.681
126
Games Played
127
126
Games Started
127
41
Hit By Pitch
42
0.0
Wins Above Replacement
0.0
0.0
Offensive Wins Above Replacement
0.0
18
Caught Stealing
24
1
Is Qualified
1
533.4
Runs Created
514.0
4.3
Runs Created Per 27 Outs
4.1
.070
Walks Per Plate Appearance
.096
0.33
Walk To Strikeout Ratio
0.44
.157
Isolated Power
.136
.243
Secondary Average
.268
3.86
Pitches Per Plate Appearance
3.96
374
Extra Base Hits
322
4708
Plate Appearances
4774
31.0
At Bats Per Home Run
35.1
22
Sacrifice Hit
23
36
Sacrifice Flies
32
Pitching
126
Team Games Played
127
45
Quality Starts
45
52
Wins
61
74
Losses
66
24
Saves
35
61
Holds
93
1033
Hits
1009
537
Earned runs
475
117
Home Runs
146
472
Walks
415
953
Strikeouts
1182
7.7
Strikeouts Per 9 Innings
9.5
147.6
Pitches Per Start
147.7
1.35
Walks Plus Hits Per Inning Pitched
1.27
4.35
Earned Run Average
3.80
74
Losses
66
1112.0
Innings pitched
1124.2
.413
Win Percentage
.480
43
Save Opportunities
49
.246
Opponent Batting Average
.238
.328
Opponent's On-base pct.
.311
.387
Opponent's Slugging pct.
.394
.714
Opponent's OPB Pct + SLG Pct
.705
4192
At Bats
4239
186
Doubles
195
26
Triples
15
53
Batters Hit
50
103
Stolen Bases
88
126
Games Played
127
1
Complete Games
0
9
Shutouts
4
46
Wild Pitches
49
548
Runs Batted In
503
4
Balks
2
1112.0
Innings pitched
1124.2
7.7
Strikeouts Per 9 Innings
9.5
32
Caught Stealing
18
126
Games Started
127
0.0
Wins Above Replacement
0.0
1
Is Qualified
1
584
Runs
528
537
Earned Runs
475
1622
Total Bases
1672
Fielding
126
Team Games Played
127
1112
Full Innings
1125
4598
Total Chances
4435
3336
Putouts
3374
1180
Assists
993
82
Errors
68
212
Double Plays
191
0.982
Fielding Percentage
0.985
36.6
Range Factor
34.9
0.0
Zone Rating
0.0
126
Games Played
127
0
Games Started
0
0.0
Defensive Wins Above Replacement
0.0
1
Qualified
1