

Giants vs Mets Live Score (5 Sep, 2026)
Game Information
Stage
STD
Season
2026
First Pitch
Sat, Sep 5, 4:10 pm
Venue
Citi Field
Location
Queens, New York
Venue Type
Outdoor
Broadcast
ESPN Unlmtd
Attendance
30,046
Live Situation
1Balls
1Strikes
0Outs
—Pitcher
—At Bat
Pitch Sequence
1
BALL
Slider
84 MPH
2
STRIKE SWINGING
Four-seam FB
94 MPH
3
BALL IN PLAY
Slider
86 MPH
Injury Report

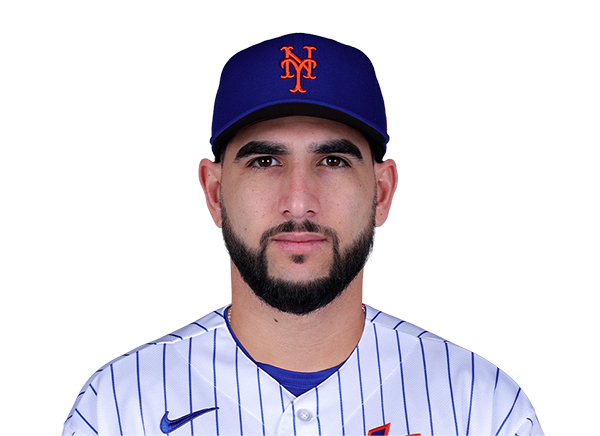
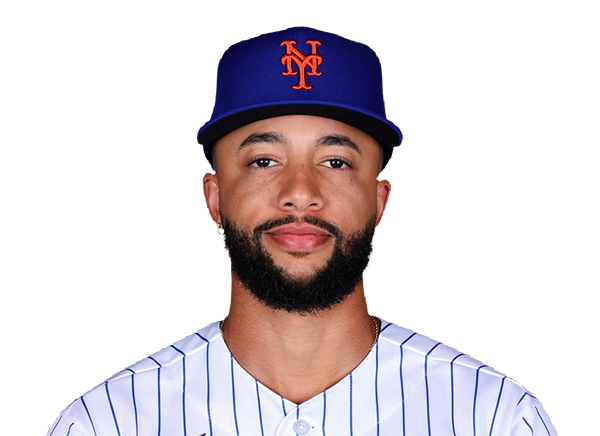
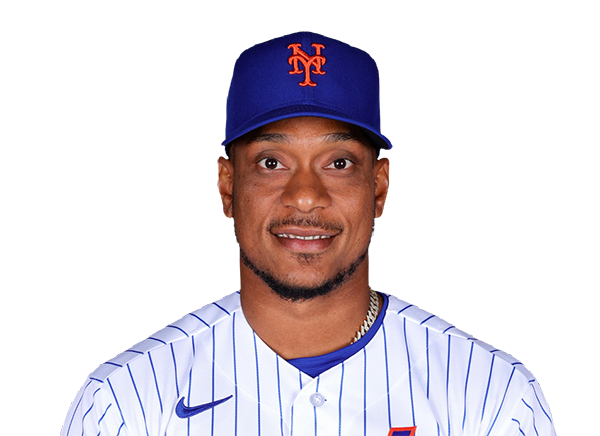


Team Stats
 SF
NYM


9
Runs
5
10
Hits
5
1
Errors
0
6
Home Runs
1
2
Walks
4
8
Strikeouts
9
Player Box Score
San Francisco Giants
| Player | H-AB | AB | R | H | RBI | HR | BB | K | #P | AVG | OBP | SLG |
|---|---|---|---|---|---|---|---|---|---|---|---|---|
 Jonah Cox | 1-5 | 5 | 1 | 1 | 0 | 0 | 0 | 1 | 14 | .291 | .333 | .519 |
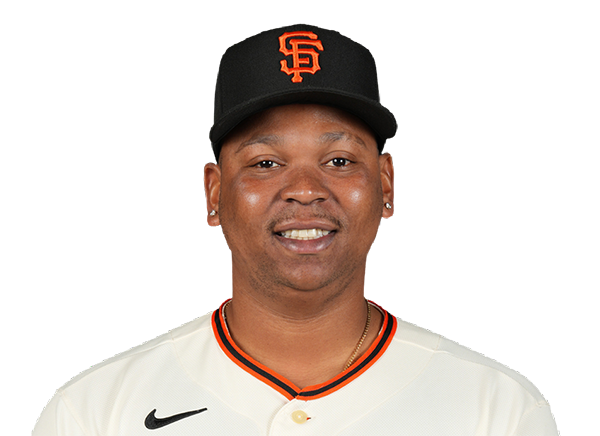 Rafael Devers | 2-4 | 4 | 2 | 2 | 3 | 2 | 0 | 0 | 10 | .258 | .339 | .519 |
 Bryce Eldridge | 1-3 | 3 | 1 | 1 | 0 | 0 | 1 | 1 | 17 | .262 | .360 | .450 |
 Osleivis Basabe | 1-4 | 4 | 1 | 1 | 2 | 1 | 0 | 2 | 18 | .216 | .264 | .382 |
|
Turner Hill | 0-4 | 4 | 0 | 0 | 0 | 0 | 0 | 2 | 19 | .308 | .400 | .404 |
 Andrew Knizner | 0-3 | 3 | 0 | 0 | 0 | 0 | 1 | 2 | 17 | .176 | .263 | .324 |
 Shay Whitcomb | 1-4 | 4 | 0 | 1 | 0 | 0 | 0 | 0 | 11 | .131 | .172 | .311 |
 Grant McCray | 2-4 | 4 | 2 | 2 | 1 | 1 | 0 | 0 | 26 | .143 | .262 | .304 |
 Christian Koss | 2-4 | 4 | 2 | 2 | 3 | 2 | 0 | 0 | 10 | .211 | .253 | .310 |
New York Mets
| Player | H-AB | AB | R | H | RBI | HR | BB | K | #P | AVG | OBP | SLG |
|---|---|---|---|---|---|---|---|---|---|---|---|---|
 Francisco Lindor | 0-5 | 5 | 0 | 0 | 0 | 0 | 0 | 1 | 27 | .230 | .313 | .426 |
 Juan Soto | 0-4 | 4 | 0 | 0 | 0 | 0 | 0 | 0 | 14 | .274 | .395 | .528 |
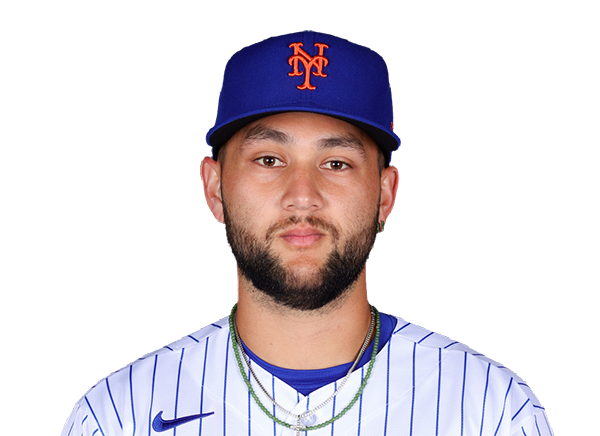 Bo Bichette | 0-4 | 4 | 0 | 0 | 0 | 0 | 0 | 2 | 18 | .264 | .313 | .397 |
 Carson Benge | 0-4 | 4 | 0 | 0 | 0 | 0 | 0 | 2 | 18 | .276 | .335 | .416 |
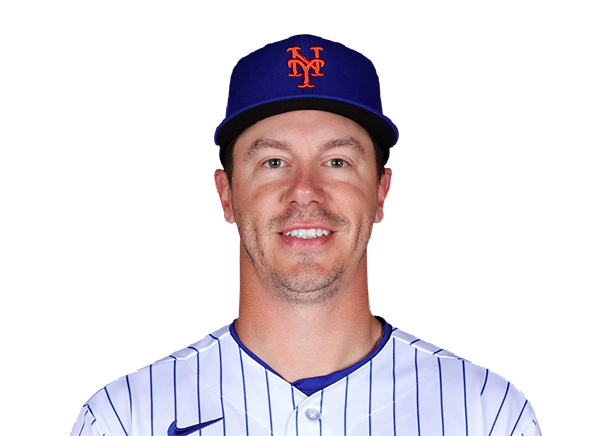 Jared Young | 2-4 | 4 | 2 | 2 | 0 | 0 | 0 | 1 | 18 | .267 | .328 | .433 |
 Marcus Semien | 1-3 | 3 | 1 | 1 | 0 | 0 | 1 | 0 | 11 | .217 | .283 | .345 |
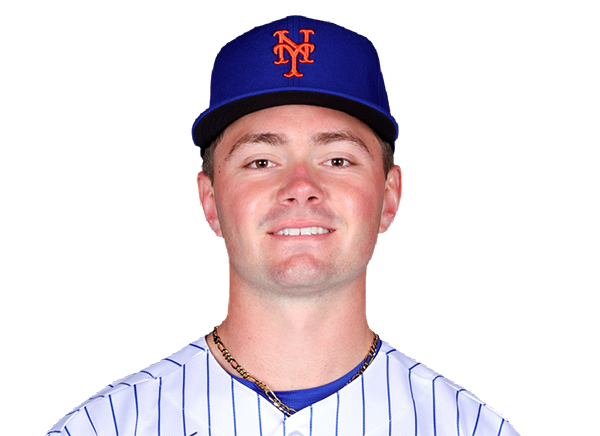 A.J. Ewing | 1-2 | 2 | 2 | 1 | 2 | 1 | 2 | 0 | 15 | .238 | .313 | .356 |
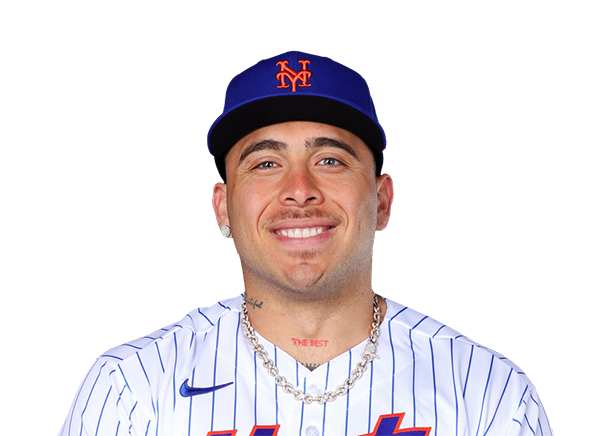 Francisco Alvarez | 0-4 | 4 | 0 | 0 | 0 | 0 | 0 | 3 | 23 | .231 | .315 | .407 |
 Brett Baty | 1-3 | 3 | 0 | 1 | 3 | 0 | 1 | 0 | 17 | .223 | .295 | .343 |
San Francisco Giants
| Player | IP | H | R | ER | BB | K | HR | PC-ST | ERA | PC |
|---|---|---|---|---|---|---|---|---|---|---|
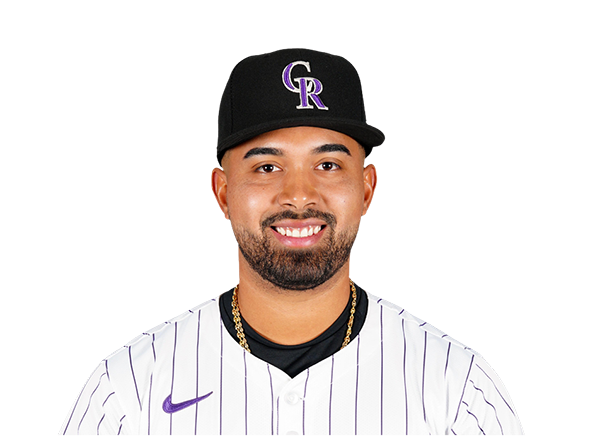 Anthony Molina | 5.0 | 1 | 2 | 0 | 1 | 6 | 1 | 87-55 | 2.79 | 87 |
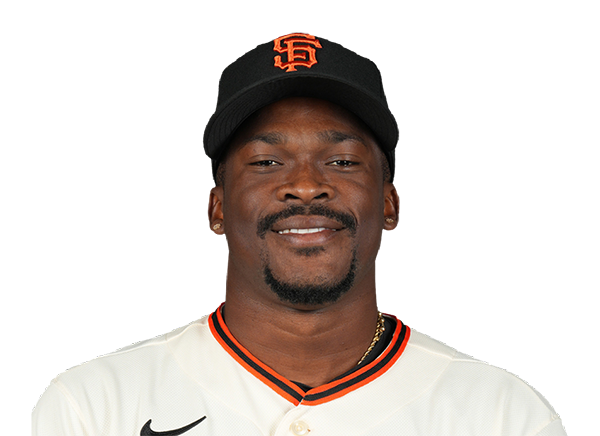 Reiver Sanmartin | 1.1 | 1 | 1 | 1 | 0 | 1 | 0 | 23-16 | 4.66 | 23 |
 Joel Kuhnel | 0.1 | 1 | 0 | 0 | 1 | 1 | 0 | 13-6 | 4.79 | 13 |
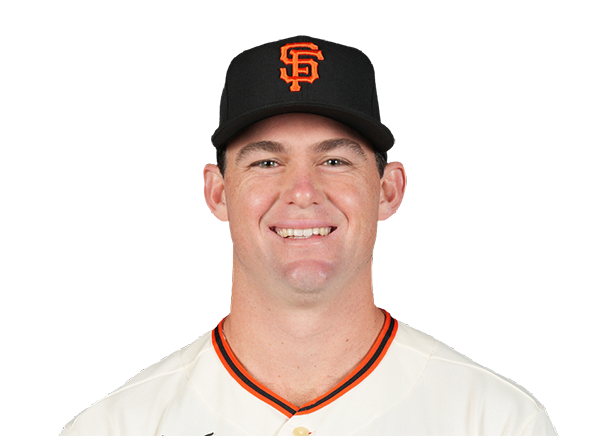 Carson Seymour | 0.1 | 0 | 0 | 0 | 1 | 0 | 0 | 9-4 | 4.43 | 9 |
 Trent Harris | 1.0 | 0 | 0 | 0 | 0 | 1 | 0 | 7-6 | 3.21 | 7 |
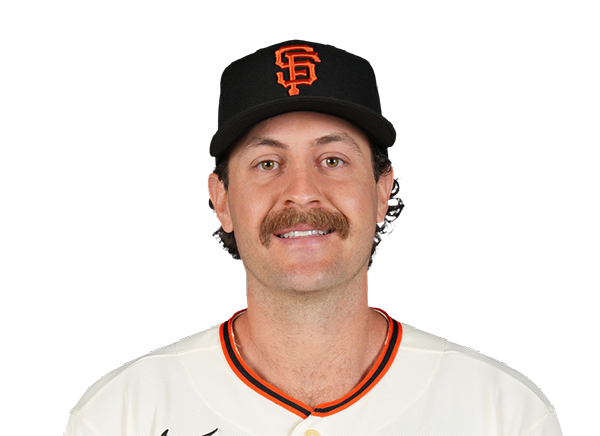 Jason Foley | 1.0 | 2 | 2 | 2 | 1 | 0 | 0 | 22-12 | 4.67 | 22 |
New York Mets
| Player | IP | H | R | ER | BB | K | HR | PC-ST | ERA | PC |
|---|---|---|---|---|---|---|---|---|---|---|
|
Zac Thornton | 5.0 | 7 | 6 | 6 | 1 | 6 | 4 | 82-59 | 3.53 | 82 |
 Chris Devenski | 2.0 | 1 | 0 | 0 | 0 | 0 | 0 | 22-14 | 7.11 | 22 |
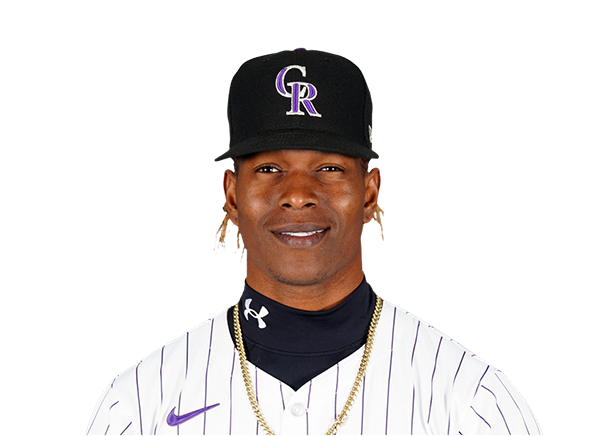 Jefry Yan | 1.0 | 1 | 2 | 2 | 1 | 2 | 1 | 22-13 | 5.68 | 22 |
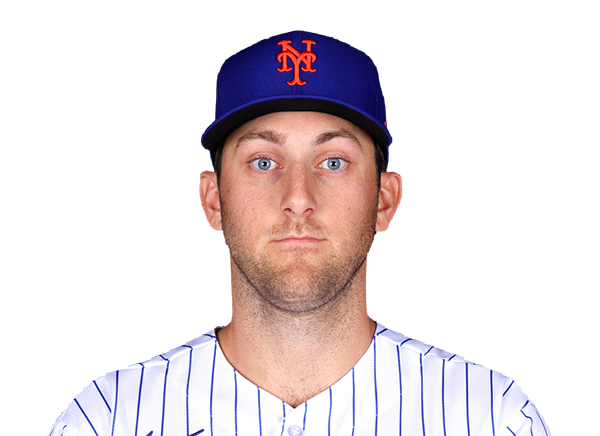 Justin Hagenman | 1.0 | 1 | 1 | 1 | 0 | 0 | 1 | 16-11 | 4.50 | 16 |
H2H / Season Series
NYM5–9
SF
NYM10–6
SF
SF2–5
NYM
SF0–9
NYM
SF3–10
NYM
SF7–2
NYM
Last 5 Games
| Date | Opponent | Result |
|---|---|---|
| Sep 5 | @ NYM | W9–5 |
| Sep 4 | @ NYM | L6–10 |
| Sep 3 |  @ PIT | L2–5 |
| Sep 2 | @ PIT | W5–4 |
| Sep 1 | @ PIT | L12–13 |
| Date | Opponent | Result |
|---|---|---|
| Sep 5 | vs SF | L5–9 |
| Sep 4 | vs SF | W10–6 |
| Sep 2 |  @ TB | W10–4 |
| Sep 1 | @ TB | L2–6 |
| Aug 31 | @ TB | W3–2 |
Standings
American League
| Team | W | L | PCT | GB | DIFF | STRK |
|---|---|---|---|---|---|---|
| 1Rays | 84 | 57 | .596 | - | +46 | W1 |
2 White Sox | 74 | 67 | .525 | 10 | +42 | W1 |
3 Astros | 73 | 69 | .514 | 11.5 | -36 | W3 |
4 Yankees | 80 | 61 | .567 | 4 | +114 | L1 |
5 Red Sox | 77 | 65 | .542 | 7.5 | +79 | W2 |
6 Guardians | 72 | 70 | .507 | 12.5 | -9 | W2 |
7 Blue Jays | 71 | 71 | .500 | 13.5 | -34 | W3 |
8 Rangers | 70 | 72 | .493 | 14.5 | -43 | L1 |
9 Orioles | 69 | 73 | .486 | 15.5 | -22 | L4 |
10 Twins | 67 | 74 | .475 | 17 | -41 | L2 |
11 Mariners | 66 | 76 | .465 | 18.5 | -69 | L2 |
12 Tigers | 64 | 77 | .454 | 20 | +45 | L2 |
13 Royals | 63 | 79 | .444 | 21.5 | -92 | L1 |
14 Athletics | 56 | 86 | .394 | 28.5 | -190 | W3 |
15 Angels | 53 | 88 | .376 | 31 | -81 | L3 |
National League
| Team | W | L | PCT | GB | DIFF | STRK |
|---|---|---|---|---|---|---|
1 Brewers | 88 | 54 | .620 | - | +174 | W1 |
2 Braves | 84 | 57 | .596 | 3.5 | +121 | W2 |
3 Dodgers | 84 | 57 | .596 | 3.5 | +149 | W2 |
4 Cubs | 80 | 62 | .563 | 8 | +138 | W2 |
5 Phillies | 79 | 62 | .560 | 8.5 | +33 | L2 |
6 Padres | 74 | 67 | .525 | 13.5 | +11 | W1 |
7 Diamondbacks | 74 | 68 | .521 | 14 | -3 | L1 |
8 Marlins | 71 | 71 | .500 | 17 | +9 | L2 |
9 Cardinals | 71 | 71 | .500 | 17 | -8 | W1 |
| 10Pirates | 70 | 72 | .493 | 18 | +30 | W2 |
11 Reds | 67 | 74 | .475 | 20.5 | -111 | L1 |
12 Nationals | 67 | 76 | .469 | 21.5 | +12 | L2 |
| 13Mets | 64 | 77 | .454 | 23.5 | -46 | W2 |
| 14Giants | 58 | 84 | .408 | 30 | -77 | L2 |
15 Rockies | 54 | 87 | .383 | 33.5 | -141 | L1 |
SF
VS
NYM
Pitchers
Anthony Molina
Catchers
Andrew Knizner
Infielders
Rafael Devers
Osleivis Basabe
Shay Whitcomb
Christian Koss
Outfielders
Jonah Cox
Turner Hill
Grant McCray
Designated Hitters
Bryce Eldridge
Pitchers
Zac Thornton
Catchers
Francisco Alvarez
Infielders
Francisco Lindor
Jared Young
Marcus Semien
Brett Baty
Outfielders
Juan Soto
Carson Benge
A.J. Ewing
Designated Hitters
Bo Bichette
Giants
VS
Mets
Batting
143
Team Games Played
142
4847
At Bats
4775
1203
Hits
1125
580
Runs Batted In
564
164
Home Runs
174
67
Stolen Bases
76
.248
Batting Average
.236
601
Runs
592
237
Doubles
180
25
Triples
18
1982
Total Bases
1863
397
Walks
451
1144
Strikeouts
1204
.309
On Base Percentage
.306
.409
Slugging Percentage
.390
.718
OBP Pct + SLG Pct
.696
143
Games Played
142
143
Games Started
142
50
Hit By Pitch
44
0.0
Wins Above Replacement
0.0
0.0
Offensive Wins Above Replacement
0.0
21
Caught Stealing
29
1
Is Qualified
1
619.7
Runs Created
573.1
4.4
Runs Created Per 27 Outs
4.1
.074
Walks Per Plate Appearance
.085
0.35
Walk To Strikeout Ratio
0.37
.161
Isolated Power
.155
.252
Secondary Average
.259
3.84
Pitches Per Plate Appearance
3.93
426
Extra Base Hits
372
5365
Plate Appearances
5322
29.6
At Bats Per Home Run
27.4
31
Sacrifice Hit
17
40
Sacrifice Flies
31
Pitching
143
Team Games Played
142
47
Quality Starts
41
59
Wins
64
84
Losses
78
26
Saves
26
77
Holds
65
1184
Hits
1149
615
Earned runs
581
136
Home Runs
160
531
Walks
502
1076
Strikeouts
1264
7.7
Strikeouts Per 9 Innings
9.0
148.1
Pitches Per Start
148.7
1.36
Walks Plus Hits Per Inning Pitched
1.31
4.39
Earned Run Average
4.13
84
Losses
78
1260.0
Innings pitched
1264.2
.413
Win Percentage
.451
48
Save Opportunities
43
.248
Opponent Batting Average
.239
.328
Opponent's On-base pct.
.319
.389
Opponent's Slugging pct.
.397
.717
Opponent's OPB Pct + SLG Pct
.716
4772
At Bats
4798
205
Doubles
234
29
Triples
21
62
Batters Hit
70
118
Stolen Bases
63
143
Games Played
142
1
Complete Games
0
10
Shutouts
5
51
Wild Pitches
33
635
Runs Batted In
615
5
Balks
3
1260.0
Innings pitched
1264.2
7.7
Strikeouts Per 9 Innings
9.0
35
Caught Stealing
29
143
Games Started
142
0.0
Wins Above Replacement
0.0
1
Is Qualified
1
674
Runs
642
615
Earned Runs
581
1855
Total Bases
1905
Fielding
143
Team Games Played
142
1260
Full Innings
1265
5204
Total Chances
5000
3780
Putouts
3794
1330
Assists
1120
94
Errors
86
237
Double Plays
180
0.982
Fielding Percentage
0.983
36.5
Range Factor
35.0
0.0
Zone Rating
0.0
143
Games Played
142
0
Games Started
0
0.0
Defensive Wins Above Replacement
0.0
1
Qualified
1