

Giants vs Mets Live Score (6 Sep, 2026)
Game Information
Stage
STD
Season
2026
First Pitch
Sun, Sep 6, 1:40 pm
Venue
Citi Field
Location
Queens, New York
Venue Type
Outdoor
Broadcast
MLB.TV
Attendance
29,410
Live Situation
2Balls
3Strikes
0Outs
—Pitcher
—At Bat
Pitch Sequence
1
STRIKE FOUL
Four-seam FB
97 MPH
2
BALL
Forkball
82 MPH
3
STRIKE LOOKING
Forkball
83 MPH
4
BALL
Forkball
81 MPH
5
STRIKE SWINGING
Forkball
84 MPH
Injury Report

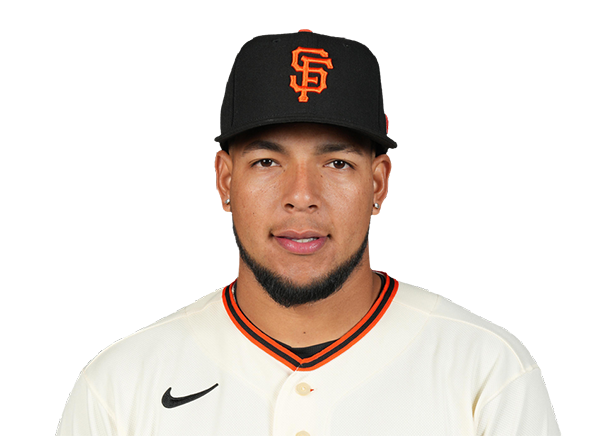
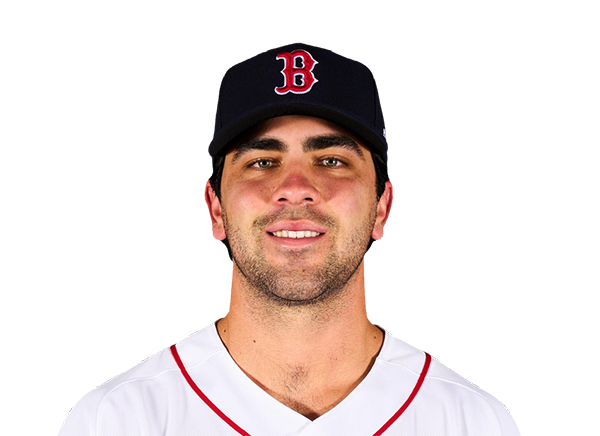

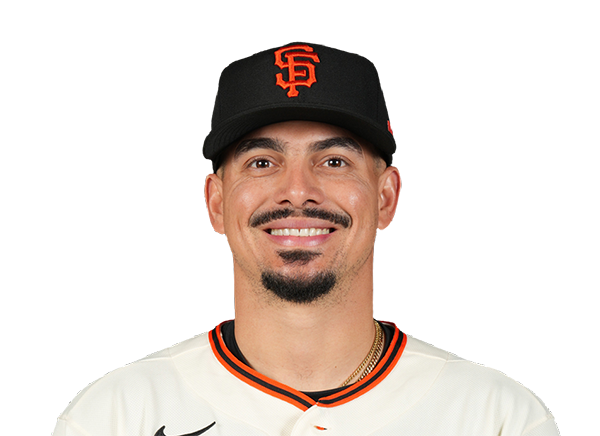
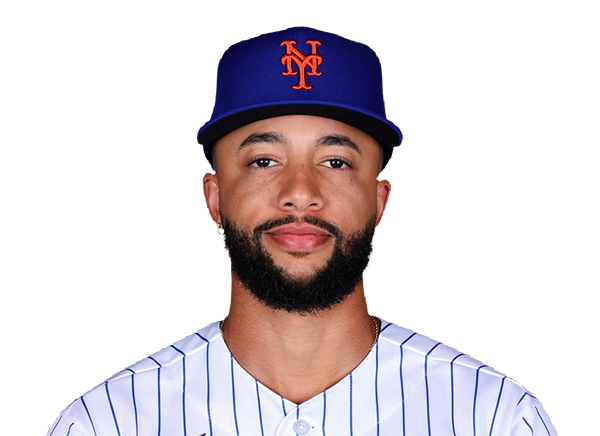



Team Stats
 SF
NYM


2
Runs
4
5
Hits
7
0
Errors
1
0
Home Runs
2
0
Walks
2
12
Strikeouts
4
Player Box Score
San Francisco Giants
| Player | H-AB | AB | R | H | RBI | HR | BB | K | #P | AVG | OBP | SLG |
|---|---|---|---|---|---|---|---|---|---|---|---|---|
 Drew Gilbert | 0-4 | 4 | 0 | 0 | 0 | 0 | 0 | 3 | 22 | .232 | .321 | .371 |
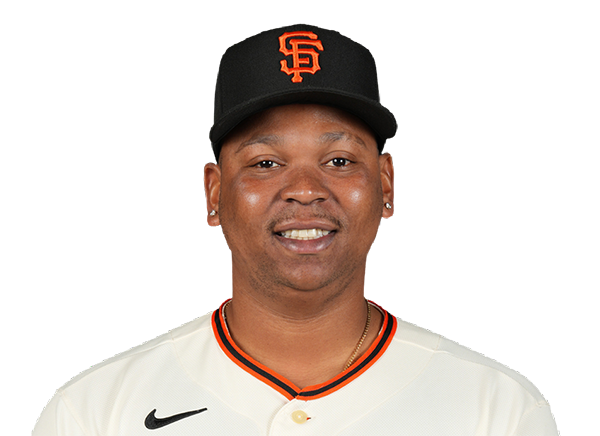 Rafael Devers | 1-4 | 4 | 0 | 1 | 0 | 0 | 0 | 3 | 26 | .258 | .338 | .517 |
 Bryce Eldridge | 1-4 | 4 | 1 | 1 | 0 | 0 | 0 | 1 | 15 | .262 | .359 | .447 |
 Jonah Cox | 1-4 | 4 | 1 | 1 | 0 | 0 | 0 | 1 | 19 | .289 | .330 | .506 |
 Jung Hoo Lee | 1-4 | 4 | 0 | 1 | 2 | 0 | 0 | 0 | 14 | .280 | .323 | .407 |
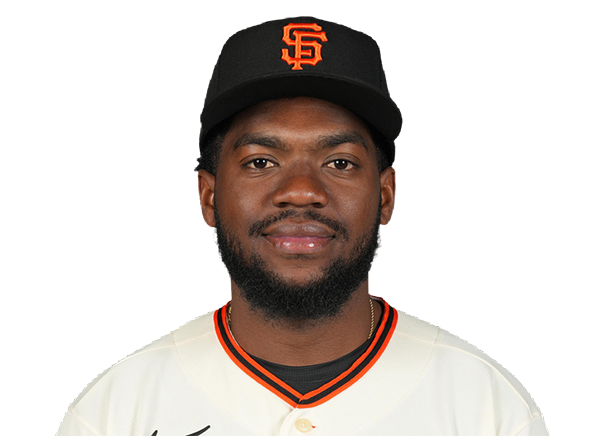 Osleivis Basabe | 0-4 | 4 | 0 | 0 | 0 | 0 | 0 | 3 | 19 | .208 | .254 | .368 |
 Grant McCray | 0-3 | 3 | 0 | 0 | 0 | 0 | 0 | 1 | 12 | .136 | .250 | .288 |
 Shay Whitcomb | 0-0 | 0 | 0 | 0 | 0 | 0 | 0 | 0 | 0 | .131 | .172 | .311 |
|
Drew Cavanaugh | 1-3 | 3 | 0 | 1 | 0 | 0 | 0 | 0 | 10 | .246 | .331 | .271 |
 Christian Koss | 0-3 | 3 | 0 | 0 | 0 | 0 | 0 | 0 | 7 | .207 | .248 | .303 |
New York Mets
| Player | H-AB | AB | R | H | RBI | HR | BB | K | #P | AVG | OBP | SLG |
|---|---|---|---|---|---|---|---|---|---|---|---|---|
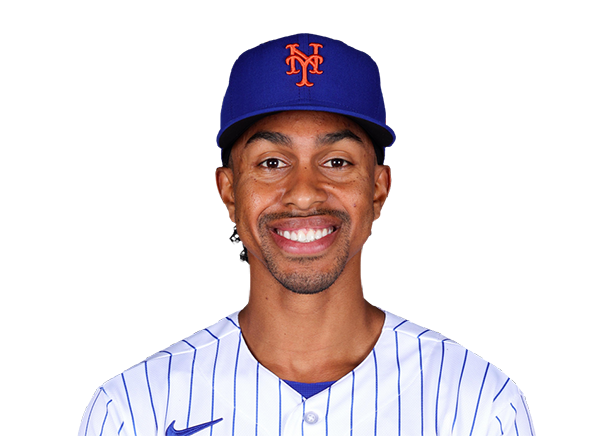 Francisco Lindor | 0-3 | 3 | 0 | 0 | 0 | 0 | 1 | 0 | 11 | .228 | .312 | .422 |
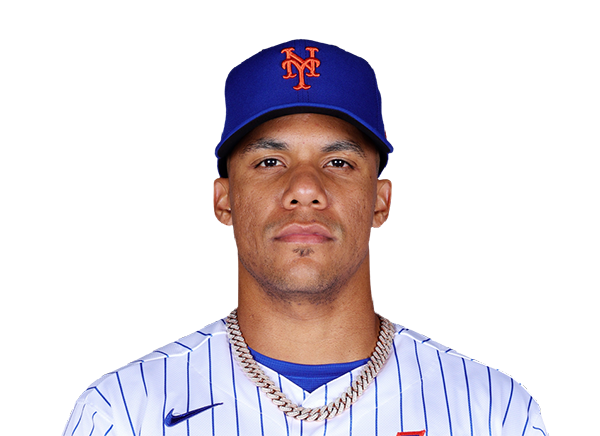 Juan Soto | 1-3 | 3 | 1 | 1 | 0 | 0 | 1 | 0 | 14 | .274 | .396 | .526 |
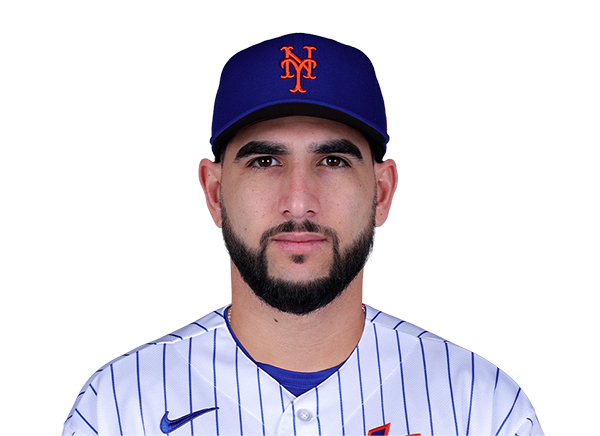
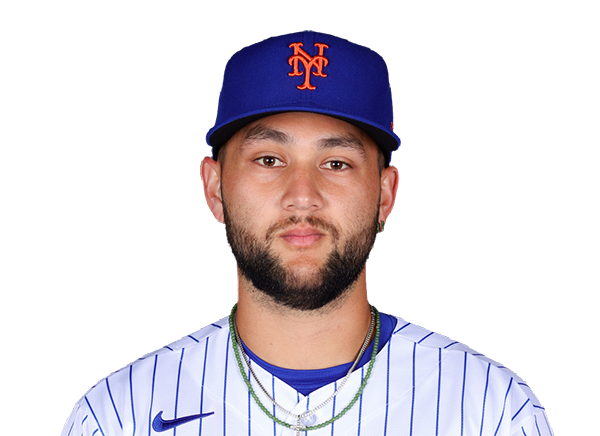 Bo Bichette | 1-4 | 4 | 1 | 1 | 3 | 1 | 0 | 1 | 19 | .264 | .312 | .401 |
 Carson Benge | 1-4 | 4 | 0 | 1 | 0 | 0 | 0 | 1 | 17 | .276 | .334 | .416 |
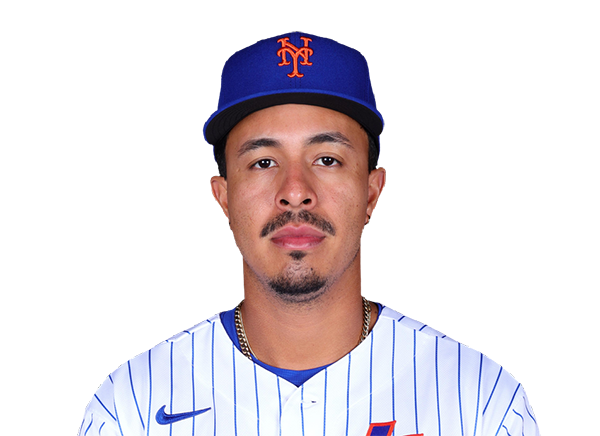 Mark Vientos | 0-2 | 2 | 0 | 0 | 0 | 0 | 0 | 1 | 12 | .217 | .259 | .410 |
 Jared Young | 0-1 | 1 | 0 | 0 | 0 | 0 | 0 | 0 | 2 | .266 | .327 | .432 |
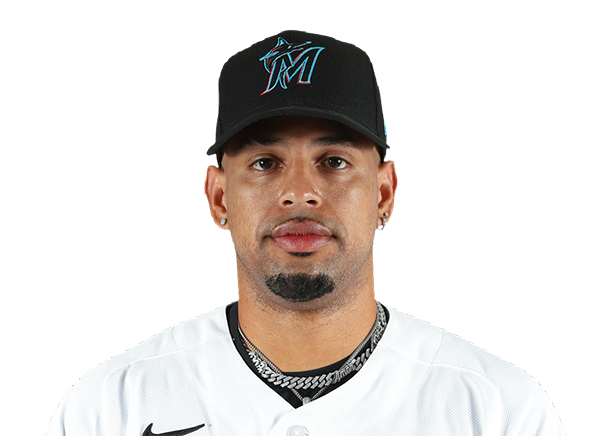 Christopher Morel | 0-0 | 0 | 0 | 0 | 0 | 0 | 0 | 0 | 0 | .167 | .231 | .202 |
 Cristian Pache | 0-0 | 0 | 0 | 0 | 0 | 0 | 0 | 0 | 0 | .125 | .125 | .125 |
 Marcus Semien | 1-3 | 3 | 0 | 1 | 0 | 0 | 0 | 0 | 12 | .218 | .283 | .345 |
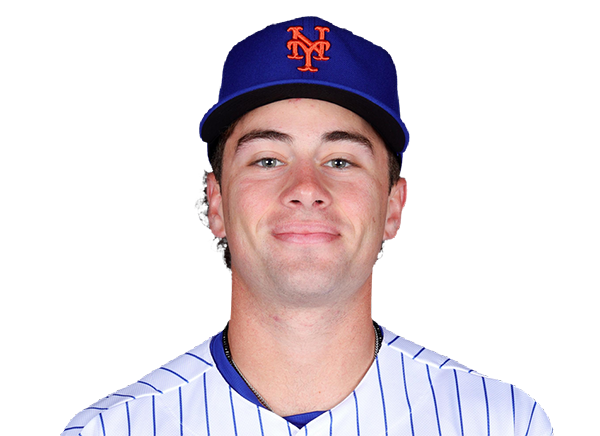 Nick Morabito | 0-2 | 2 | 0 | 0 | 0 | 0 | 0 | 0 | 3 | .105 | .227 | .158 |
 Brett Baty | 1-1 | 1 | 1 | 1 | 1 | 1 | 0 | 0 | 3 | .225 | .297 | .353 |
 A.J. Ewing | 2-3 | 3 | 1 | 2 | 0 | 0 | 0 | 0 | 18 | .242 | .316 | .359 |
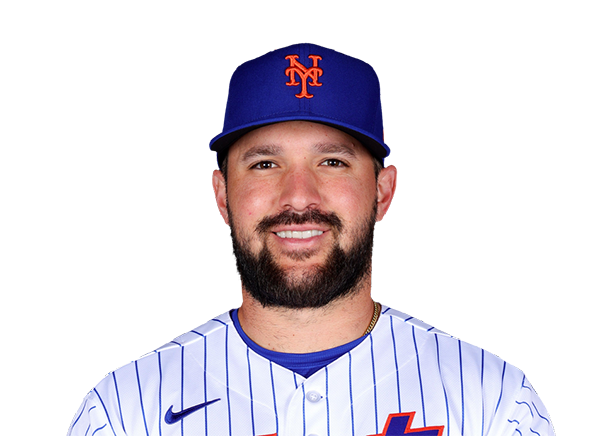 Luis Torrens | 0-2 | 2 | 0 | 0 | 0 | 0 | 0 | 1 | 8 | .232 | .297 | .390 |
San Francisco Giants
| Player | IP | H | R | ER | BB | K | HR | PC-ST | ERA | PC |
|---|---|---|---|---|---|---|---|---|---|---|
|
Cesar Perdomo | 6.0 | 3 | 0 | 0 | 1 | 4 | 0 | 83-48 | 0.90 | 83 |
 Joel Kuhnel | 1.0 | 1 | 0 | 0 | 0 | 0 | 0 | 20-13 | 4.66 | 20 |
 Carson Seymour | 1.0 | 3 | 4 | 4 | 1 | 0 | 2 | 16-10 | 5.79 | 16 |
New York Mets
| Player | IP | H | R | ER | BB | K | HR | PC-ST | ERA | PC |
|---|---|---|---|---|---|---|---|---|---|---|
 Christian Scott | 4.2 | 4 | 2 | 2 | 0 | 7 | 0 | 80-55 | 3.81 | 80 |
 Nate Lavender | 0.1 | 0 | 0 | 0 | 0 | 1 | 0 | 5-3 | 0.00 | 5 |
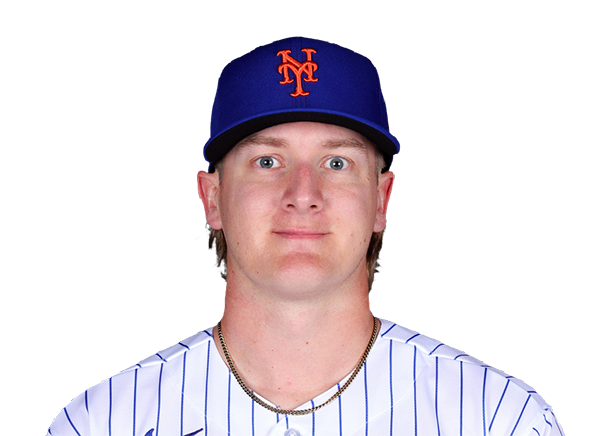 Jonathan Pintaro | 2.0 | 0 | 0 | 0 | 0 | 1 | 0 | 22-15 | 3.81 | 22 |
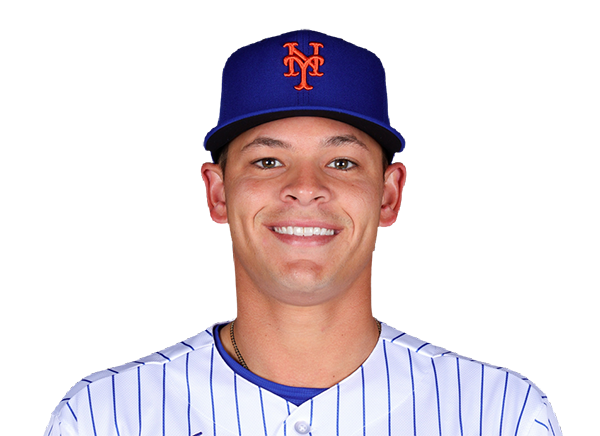 Tobias Myers | 1.0 | 1 | 0 | 0 | 0 | 2 | 0 | 23-15 | 6.13 | 23 |
 Kodai Senga | 1.0 | 0 | 0 | 0 | 0 | 1 | 0 | 14-8 | 7.11 | 14 |
H2H / Season Series
NYM4–2
SF
NYM5–9
SF
NYM10–6
SF
SF2–5
NYM
SF0–9
NYM
SF3–10
NYM
SF7–2
NYM
Last 5 Games
| Date | Opponent | Result |
|---|---|---|
| Sep 6 | @ NYM | L2–4 |
| Sep 5 | @ NYM | W9–5 |
| Sep 4 | @ NYM | L6–10 |
| Sep 3 |  @ PIT | L2–5 |
| Sep 2 | @ PIT | W5–4 |
| Date | Opponent | Result |
|---|---|---|
| Sep 6 | vs SF | W4–2 |
| Sep 5 | vs SF | L5–9 |
| Sep 4 | vs SF | W10–6 |
| Sep 2 |  @ TB | W10–4 |
| Sep 1 | @ TB | L2–6 |
Standings
American League
| Team | W | L | PCT | GB | DIFF | STRK |
|---|---|---|---|---|---|---|
| 1Rays | 85 | 58 | .594 | - | +47 | L1 |
2 White Sox | 75 | 68 | .524 | 10 | +49 | W1 |
3 Astros | 73 | 71 | .507 | 12.5 | -38 | L2 |
4 Yankees | 81 | 62 | .566 | 4 | +117 | L1 |
5 Red Sox | 79 | 65 | .549 | 6.5 | +86 | W4 |
6 Guardians | 73 | 71 | .507 | 12.5 | -14 | W1 |
7 Blue Jays | 72 | 72 | .500 | 13.5 | -38 | L1 |
8 Rangers | 71 | 73 | .493 | 14.5 | -44 | W1 |
9 Orioles | 69 | 75 | .479 | 16.5 | -29 | L6 |
10 Twins | 68 | 75 | .476 | 17 | -48 | L1 |
11 Mariners | 67 | 77 | .465 | 18.5 | -71 | W1 |
12 Tigers | 65 | 78 | .455 | 20 | +50 | L1 |
13 Royals | 64 | 80 | .444 | 21.5 | -88 | W1 |
14 Athletics | 57 | 87 | .396 | 28.5 | -188 | L1 |
15 Angels | 54 | 89 | .378 | 31 | -77 | L1 |
National League
| Team | W | L | PCT | GB | DIFF | STRK |
|---|---|---|---|---|---|---|
1 Brewers | 88 | 56 | .611 | - | +168 | L2 |
2 Dodgers | 86 | 57 | .601 | 1.5 | +152 | W4 |
3 Braves | 85 | 58 | .594 | 2.5 | +120 | W1 |
4 Cubs | 81 | 63 | .563 | 7 | +132 | L1 |
5 Phillies | 80 | 63 | .559 | 7.5 | +34 | L1 |
6 Diamondbacks | 76 | 68 | .528 | 12 | -1 | W2 |
7 Padres | 75 | 68 | .524 | 12.5 | +8 | W1 |
8 Marlins | 72 | 72 | .500 | 16 | +15 | W1 |
9 Cardinals | 72 | 72 | .500 | 16 | -9 | W1 |
| 10Pirates | 71 | 73 | .493 | 17 | +26 | W1 |
11 Reds | 69 | 74 | .483 | 18.5 | -105 | W2 |
12 Nationals | 67 | 78 | .462 | 21.5 | +9 | L4 |
| 13Mets | 65 | 78 | .455 | 22.5 | -48 | W1 |
| 14Giants | 59 | 85 | .410 | 29 | -75 | L1 |
15 Rockies | 55 | 88 | .385 | 32.5 | -140 | L1 |
SF
VS
NYM
Pitchers
Cesar Perdomo
Catchers
Drew Cavanaugh
Infielders
Bryce Eldridge
Jonah Cox
Osleivis Basabe
Christian Koss
Outfielders
Drew Gilbert
Jung Hoo Lee
Grant McCray
Designated Hitters
Rafael Devers
Pitchers
Christian Scott
Catchers
Luis Torrens
Infielders
Francisco Lindor
Bo Bichette
Mark Vientos
Marcus Semien
Outfielders
Carson Benge
Nick Morabito
A.J. Ewing
Designated Hitters
Juan Soto
Giants
VS
Mets
Batting
144
Team Games Played
143
4880
At Bats
4803
1208
Hits
1132
582
Runs Batted In
568
164
Home Runs
176
67
Stolen Bases
76
.248
Batting Average
.236
603
Runs
596
237
Doubles
181
25
Triples
18
1987
Total Bases
1877
397
Walks
453
1156
Strikeouts
1208
.308
On Base Percentage
.306
.407
Slugging Percentage
.391
.716
OBP Pct + SLG Pct
.696
144
Games Played
143
144
Games Started
143
50
Hit By Pitch
44
0.0
Wins Above Replacement
0.0
0.0
Offensive Wins Above Replacement
0.0
21
Caught Stealing
30
1
Is Qualified
1
619.3
Runs Created
576.7
4.3
Runs Created Per 27 Outs
4.1
.074
Walks Per Plate Appearance
.085
0.34
Walk To Strikeout Ratio
0.38
.160
Isolated Power
.155
.250
Secondary Average
.259
3.85
Pitches Per Plate Appearance
3.93
426
Extra Base Hits
375
5398
Plate Appearances
5353
29.8
At Bats Per Home Run
27.3
31
Sacrifice Hit
18
40
Sacrifice Flies
31
Pitching
144
Team Games Played
143
48
Quality Starts
41
59
Wins
65
85
Losses
78
26
Saves
27
78
Holds
65
1191
Hits
1154
619
Earned runs
583
138
Home Runs
160
533
Walks
502
1080
Strikeouts
1276
7.7
Strikeouts Per 9 Innings
9.0
147.9
Pitches Per Start
148.7
1.36
Walks Plus Hits Per Inning Pitched
1.30
4.39
Earned Run Average
4.12
85
Losses
78
1268.0
Innings pitched
1273.2
.410
Win Percentage
.455
49
Save Opportunities
44
.248
Opponent Batting Average
.239
.328
Opponent's On-base pct.
.318
.389
Opponent's Slugging pct.
.395
.718
Opponent's OPB Pct + SLG Pct
.713
4800
At Bats
4831
206
Doubles
234
29
Triples
21
62
Batters Hit
70
118
Stolen Bases
63
144
Games Played
143
1
Complete Games
0
10
Shutouts
5
51
Wild Pitches
33
639
Runs Batted In
617
5
Balks
3
1268.0
Innings pitched
1273.2
7.7
Strikeouts Per 9 Innings
9.0
36
Caught Stealing
29
144
Games Started
143
0.0
Wins Above Replacement
0.0
1
Is Qualified
1
678
Runs
644
619
Earned Runs
583
1869
Total Bases
1910
Fielding
144
Team Games Played
143
1268
Full Innings
1274
5238
Total Chances
5031
3804
Putouts
3821
1340
Assists
1123
94
Errors
87
237
Double Plays
181
0.982
Fielding Percentage
0.983
36.5
Range Factor
34.9
0.0
Zone Rating
0.0
144
Games Played
143
0
Games Started
0
0.0
Defensive Wins Above Replacement
0.0
1
Qualified
1