

Giants vs Padres Live Score (2 Aug, 2026)
Game Information
Stage
Standard
Season
2026
First Pitch
Sun, Aug 2, 4:10 pm
Venue
Petco Park
Location
San Diego, California
Attendance
43,856
Live Situation
0Balls
2Strikes
0Outs
—Pitcher
—At Bat
Pitch Sequence
1
STRIKE FOUL
Sinker
99 MPH
2
STRIKE FOUL
Four-seam FB
100 MPH
3
BALL IN PLAY
Four-seam FB
100 MPH
Injury Report


Team Stats
 SF
SD


4
Runs
5
7
Hits
8
2
Errors
1
2
Home Runs
1
2
Walks
5
8
Strikeouts
9
Player Box Score
San Francisco Giants
| Player | H-AB | AB | R | H | RBI | HR | BB | K | #P | AVG | OBP | SLG |
|---|---|---|---|---|---|---|---|---|---|---|---|---|
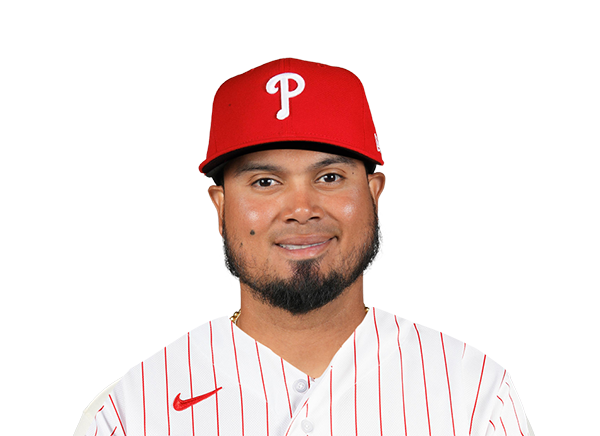 Luis Arraez | 0-5 | 5 | 0 | 0 | 0 | 0 | 0 | 0 | 19 | .324 | .360 | .440 |
 Bryce Eldridge | 1-4 | 4 | 1 | 1 | 0 | 0 | 0 | 1 | 14 | .253 | .348 | .442 |
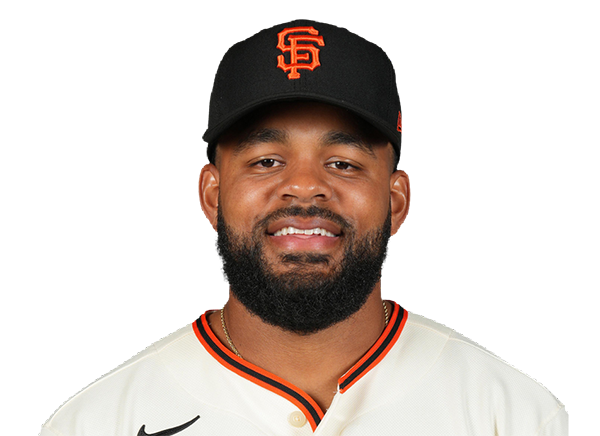 Heliot Ramos | 1-4 | 4 | 0 | 1 | 0 | 0 | 0 | 1 | 16 | .264 | .304 | .424 |
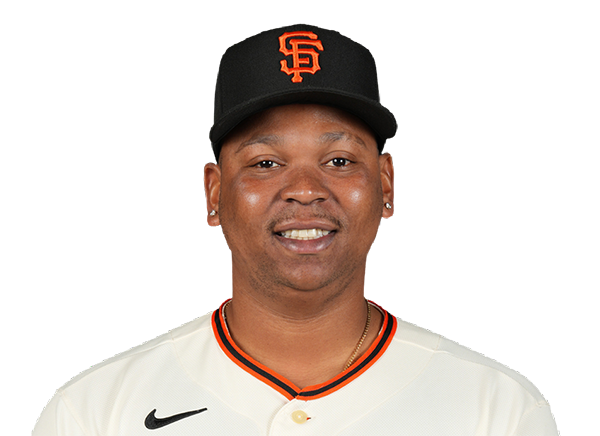 Rafael Devers | 1-3 | 3 | 2 | 1 | 1 | 1 | 1 | 1 | 23 | .250 | .324 | .481 |
 Jung Hoo Lee | 2-3 | 3 | 0 | 2 | 0 | 0 | 0 | 0 | 21 | .301 | .338 | .434 |
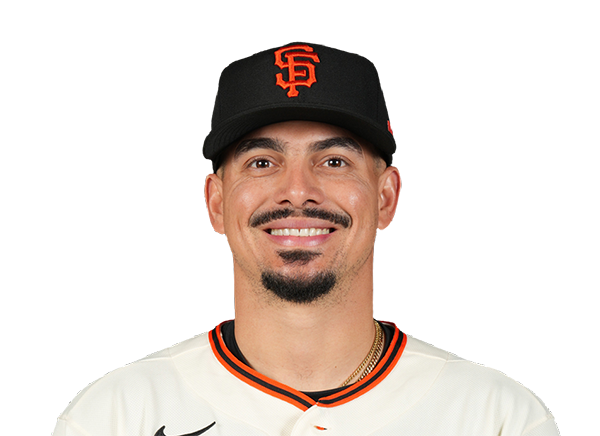 Willy Adames | 1-4 | 4 | 0 | 1 | 1 | 0 | 0 | 1 | 20 | .224 | .281 | .417 |
 Drew Cavanaugh | 0-3 | 3 | 0 | 0 | 1 | 0 | 0 | 0 | 9 | .231 | .355 | .231 |
 Christian Koss | 0-1 | 1 | 0 | 0 | 0 | 0 | 0 | 1 | 6 | .167 | .222 | .190 |
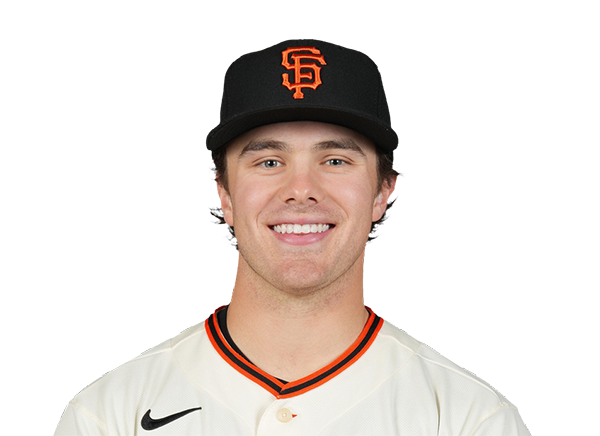 Drew Gilbert | 0-2 | 2 | 0 | 0 | 0 | 0 | 1 | 1 | 13 | .239 | .324 | .354 |
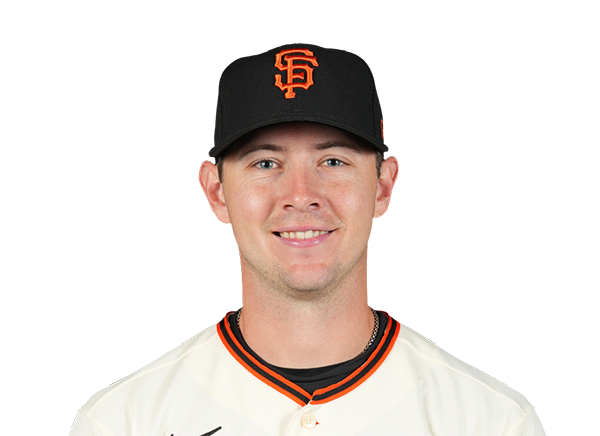 Daniel Susac | 0-1 | 1 | 0 | 0 | 0 | 0 | 0 | 1 | 7 | .264 | .308 | .403 |
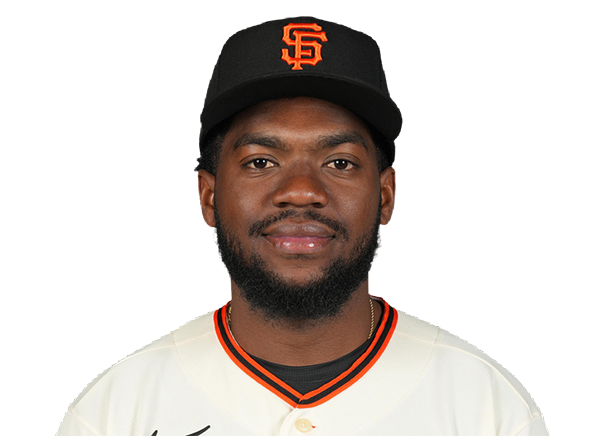 Osleivis Basabe | 1-3 | 3 | 1 | 1 | 1 | 1 | 0 | 1 | 16 | .333 | .400 | 1.111 |
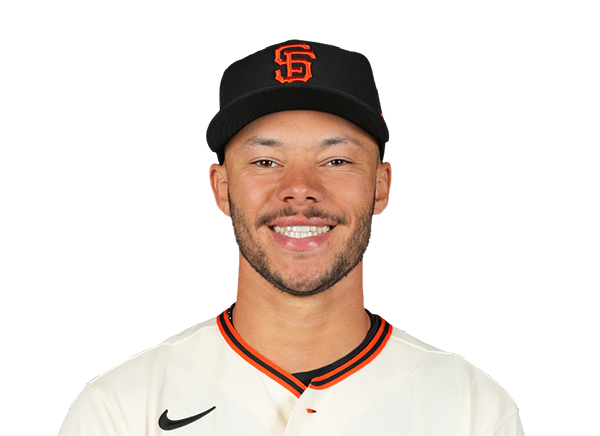 Grant McCray | 0-0 | 0 | 0 | 0 | 0 | 0 | 0 | 0 | 0 | .143 | .217 | .286 |
San Diego Padres
| Player | H-AB | AB | R | H | RBI | HR | BB | K | #P | AVG | OBP | SLG |
|---|---|---|---|---|---|---|---|---|---|---|---|---|
 Luis Rengifo | 1-3 | 3 | 0 | 1 | 0 | 0 | 1 | 0 | 28 | .362 | .483 | .532 |
 Jake Cronenworth | 1-5 | 5 | 0 | 1 | 2 | 0 | 0 | 2 | 21 | .214 | .306 | .286 |
 Manny Machado | 0-4 | 4 | 0 | 0 | 0 | 0 | 0 | 2 | 12 | .210 | .294 | .428 |
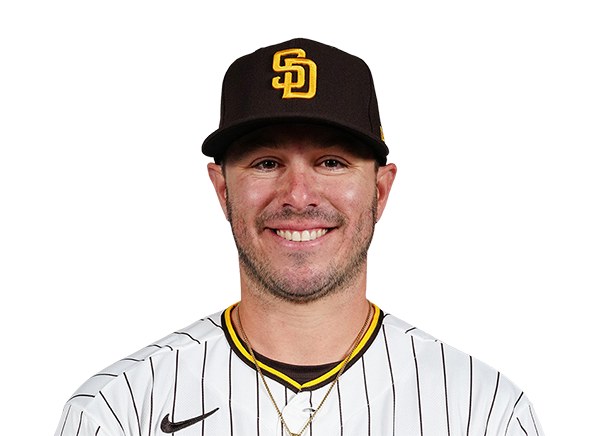 Ty France | 2-4 | 4 | 2 | 2 | 0 | 0 | 0 | 0 | 15 | .297 | .350 | .539 |
 Jackson Merrill | 2-3 | 3 | 1 | 2 | 2 | 1 | 1 | 0 | 12 | .237 | .289 | .398 |
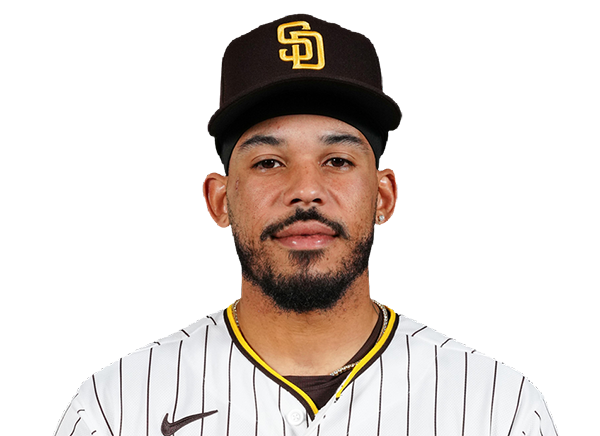 Luis Campusano | 1-4 | 4 | 0 | 1 | 1 | 0 | 0 | 2 | 16 | .304 | .403 | .500 |
 Gavin Sheets | 1-2 | 2 | 1 | 1 | 0 | 0 | 1 | 0 | 14 | .215 | .315 | .396 |
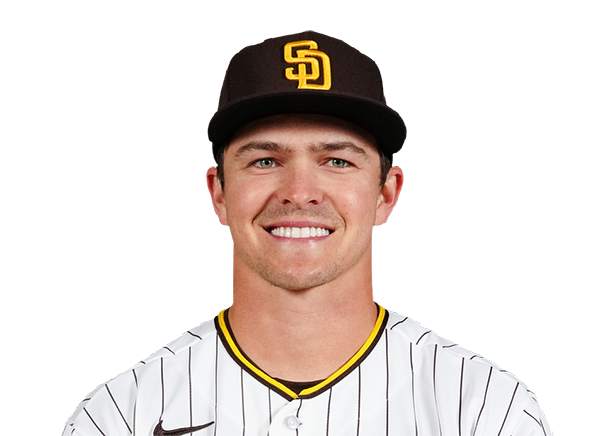 Jase Bowen | 0-1 | 1 | 0 | 0 | 0 | 0 | 0 | 0 | 4 | .156 | .194 | .234 |
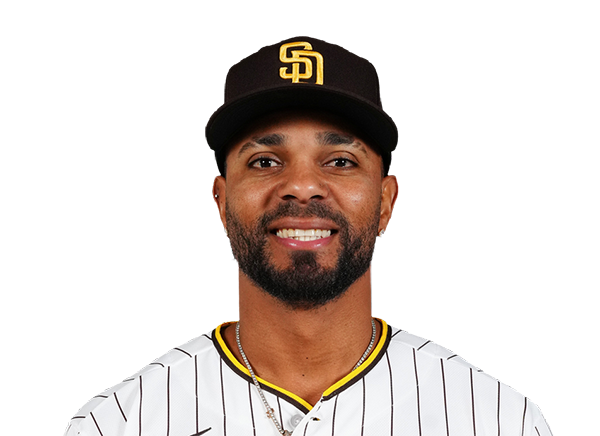 Xander Bogaerts | 0-2 | 2 | 1 | 0 | 0 | 0 | 2 | 1 | 22 | .220 | .315 | .321 |
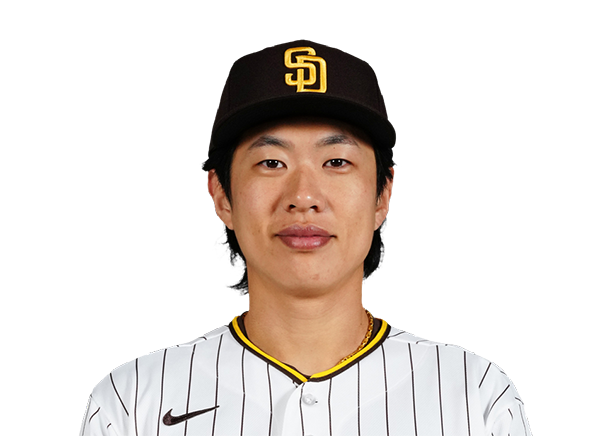 Sung-Mun Song | 0-4 | 4 | 0 | 0 | 0 | 0 | 0 | 2 | 21 | .204 | .305 | .272 |
San Francisco Giants
| Player | IP | H | R | ER | BB | K | HR | PC-ST | ERA | PC |
|---|---|---|---|---|---|---|---|---|---|---|
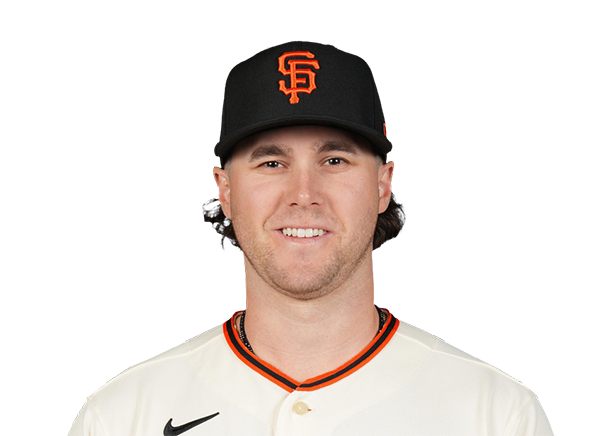 Landen Roupp | 4.2 | 6 | 5 | 5 | 4 | 6 | 1 | 99-56 | 4.34 | 99 |
 Sam Hentges | 1.1 | 1 | 0 | 0 | 0 | 2 | 0 | 19-14 | 2.66 | 19 |
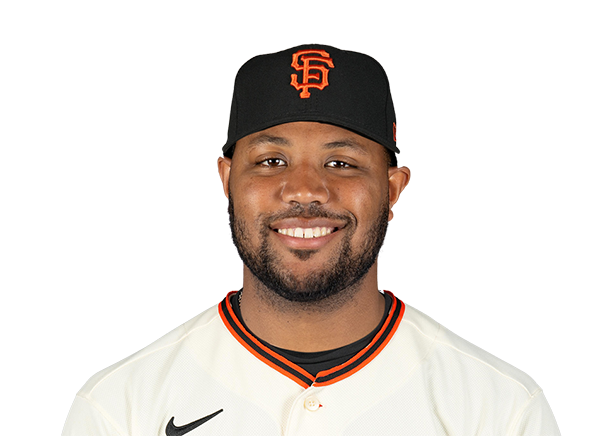 Dylan Smith | 1.0 | 1 | 0 | 0 | 0 | 1 | 0 | 16-10 | 2.75 | 16 |
 JT Brubaker | 0.2 | 0 | 0 | 0 | 1 | 0 | 0 | 23-15 | 3.06 | 23 |
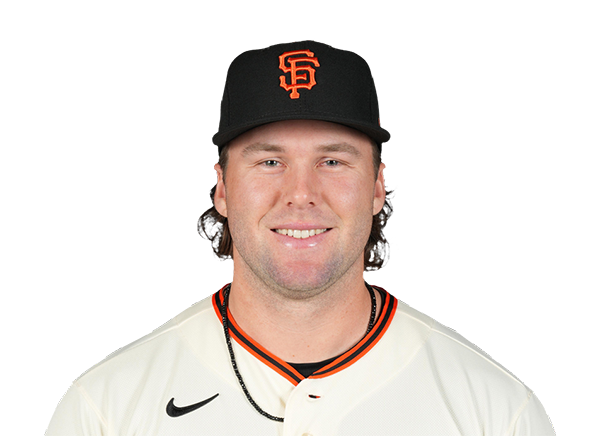 Erik Miller | 0.1 | 0 | 0 | 0 | 0 | 0 | 0 | 8-5 | 2.76 | 8 |
San Diego Padres
| Player | IP | H | R | ER | BB | K | HR | PC-ST | ERA | PC |
|---|---|---|---|---|---|---|---|---|---|---|
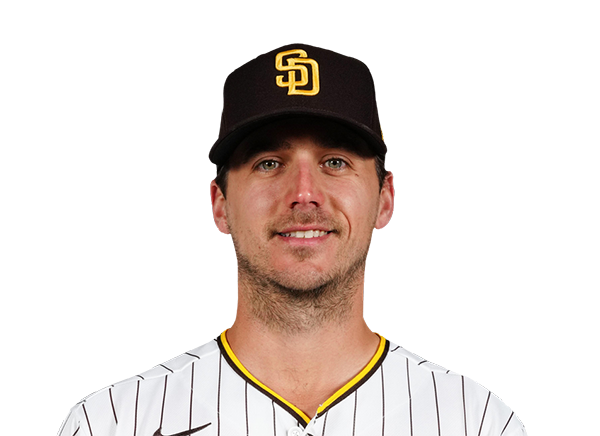 Kyle Hart | 3.0 | 1 | 0 | 0 | 0 | 2 | 0 | 43-24 | 4.53 | 43 |
 JP Sears | 1.0 | 2 | 2 | 2 | 1 | 0 | 0 | 28-17 | 4.68 | 28 |
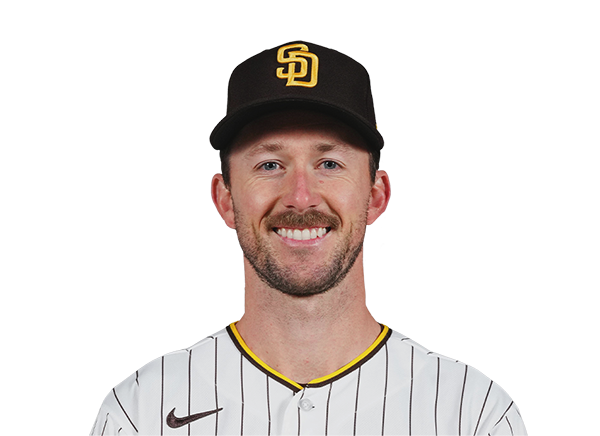 Griffin Canning | 2.0 | 2 | 1 | 1 | 0 | 0 | 1 | 38-25 | 6.58 | 38 |
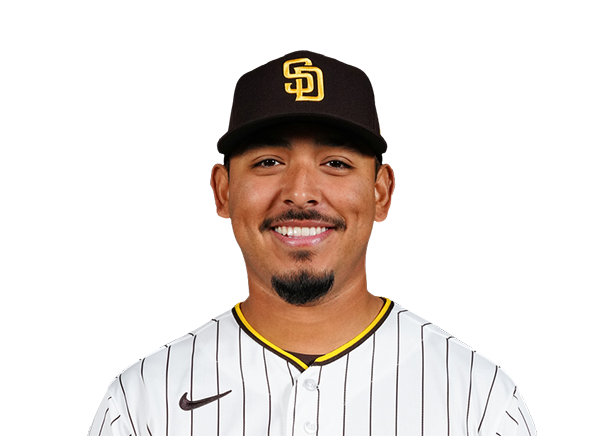 Jeremiah Estrada | 1.0 | 0 | 0 | 0 | 1 | 1 | 0 | 10-4 | 3.91 | 10 |
 Bradgley Rodriguez | 0.2 | 2 | 1 | 1 | 0 | 2 | 1 | 23-16 | 2.44 | 23 |
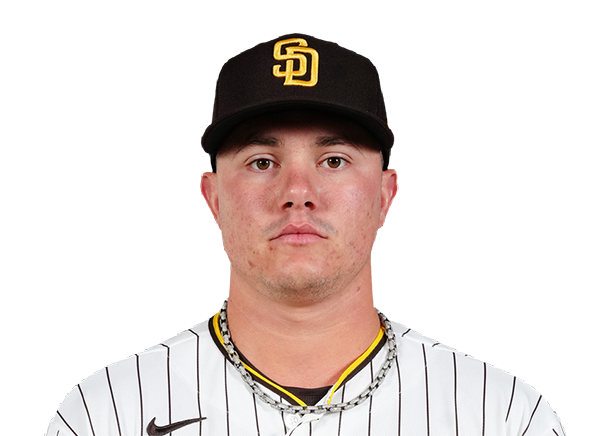 Adrian Morejon | 1.1 | 0 | 0 | 0 | 0 | 3 | 0 | 22-15 | 3.00 | 22 |
H2H / Season Series
SD5–4
SF
SD6–5
SF
SD7–0
SF
SD1–4
SF
SF1–5
SD
SF5–10
SD
SF3–2
SD
SD7–1
SF
SD3–9
SF
SD2–3
SF
Last 5 Games
| Date | Opponent | Result |
|---|---|---|
| Aug 21 |  @ BOS | L4–6 |
| Aug 20 |  @ CLE | L2–5 |
| Aug 19 | @ CLE | W1–0 |
| Aug 18 | @ CLE | L1–8 |
| Aug 16 |  vs COL | L7–13 |
| Date | Opponent | Result |
|---|---|---|
| Aug 21 |  vs MIN | W6–2 |
| Aug 19 |  @ NYM | L2–4 |
| Aug 18 | @ NYM | W5–2 |
| Aug 17 | @ NYM | L1–2 |
| Aug 16 | @ CLE | W5–0 |
Standings
American League
| Team | W | L | PCT | GB | DIFF | STRK |
|---|---|---|---|---|---|---|
1 Rays | 76 | 52 | .594 | - | +43 | L2 |
2 White Sox | 67 | 61 | .523 | 9 | +47 | W1 |
3 Astros | 65 | 64 | .504 | 11.5 | -42 | W1 |
4 Yankees | 73 | 56 | .566 | 3.5 | +95 | L1 |
| 5Red Sox | 69 | 59 | .539 | 7 | +97 | W1 |
6 Rangers | 64 | 65 | .496 | 12.5 | -45 | W2 |
7 Blue Jays | 64 | 67 | .489 | 13.5 | -50 | W1 |
| 8Twins | 63 | 66 | .488 | 13.5 | -45 | L1 |
| 9Guardians | 63 | 66 | .488 | 13.5 | -15 | W2 |
10 Orioles | 62 | 67 | .481 | 14.5 | -34 | W1 |
11 Tigers | 61 | 67 | .477 | 15 | +79 | L3 |
12 Mariners | 61 | 68 | .473 | 15.5 | -45 | W1 |
13 Royals | 56 | 74 | .431 | 21 | -97 | W6 |
14 Angels | 51 | 78 | .395 | 25.5 | -71 | L1 |
15 Athletics | 49 | 80 | .380 | 27.5 | -189 | L5 |
National League
| Team | W | L | PCT | GB | DIFF | STRK |
|---|---|---|---|---|---|---|
1 Brewers | 81 | 49 | .623 | - | +163 | W3 |
2 Dodgers | 78 | 51 | .605 | 2.5 | +146 | W4 |
3 Braves | 75 | 55 | .577 | 6 | +108 | L2 |
4 Cubs | 74 | 55 | .574 | 6.5 | +99 | L2 |
5 Phillies | 71 | 58 | .550 | 9.5 | +16 | W7 |
| 6Padres | 69 | 60 | .535 | 11.5 | +7 | W1 |
7 Diamondbacks | 68 | 61 | .527 | 12.5 | +13 | W2 |
8 Cardinals | 66 | 64 | .508 | 15 | +9 | L1 |
9 Marlins | 65 | 64 | .504 | 15.5 | +15 | W1 |
10 Pirates | 63 | 67 | .485 | 18 | +30 | L1 |
11 Reds | 61 | 68 | .473 | 19.5 | -98 | L2 |
12 Nationals | 61 | 69 | .469 | 20 | +16 | L2 |
| 13Mets | 58 | 71 | .450 | 22.5 | -44 | L1 |
| 14Giants | 52 | 76 | .406 | 28 | -78 | L2 |
| 15Rockies | 50 | 78 | .391 | 30 | -130 | L4 |
SF
VS
SD
Pitchers
Landen Roupp
Catchers
Drew Cavanaugh
Infielders
Luis Arraez
Rafael Devers
Willy Adames
Osleivis Basabe
Outfielders
Heliot Ramos
Jung Hoo Lee
Drew Gilbert
Designated Hitters
Bryce Eldridge
Pitchers
Kyle Hart
Catchers
Luis Campusano
Infielders
Jake Cronenworth
Ty France
Xander Bogaerts
Sung-Mun Song
Outfielders
Luis Rengifo
Jackson Merrill
Gavin Sheets
Designated Hitters
Manny Machado
Giants
VS
Padres
Batting
112
Team Games Played
112
3822
At Bats
3681
967
Hits
866
452
Runs Batted In
458
126
Home Runs
121
49
Stolen Bases
114
.253
Batting Average
.235
470
Runs
472
196
Doubles
165
22
Triples
10
1585
Total Bases
1414
290
Walks
383
877
Strikeouts
924
.310
On Base Percentage
.312
.415
Slugging Percentage
.384
.725
OBP Pct + SLG Pct
.696
112
Games Played
112
112
Games Started
112
39
Hit By Pitch
42
0.0
Wins Above Replacement
0.0
0.0
Offensive Wins Above Replacement
0.0
14
Caught Stealing
30
1
Is Qualified
1
494.0
Runs Created
452.5
4.5
Runs Created Per 27 Outs
4.1
.069
Walks Per Plate Appearance
.092
0.33
Walk To Strikeout Ratio
0.41
.162
Isolated Power
.149
.247
Secondary Average
.276
3.86
Pitches Per Plate Appearance
3.94
344
Extra Base Hits
296
4204
Plate Appearances
4155
30.3
At Bats Per Home Run
30.4
21
Sacrifice Hit
18
32
Sacrifice Flies
30
Pitching
112
Team Games Played
112
41
Quality Starts
18
47
Wins
58
65
Losses
54
21
Saves
34
53
Holds
70
924
Hits
919
481
Earned runs
455
110
Home Runs
125
414
Walks
389
851
Strikeouts
915
7.8
Strikeouts Per 9 Innings
8.3
147.7
Pitches Per Start
147.4
1.36
Walks Plus Hits Per Inning Pitched
1.32
4.39
Earned Run Average
4.14
65
Losses
54
986.1
Innings pitched
989.0
.420
Win Percentage
.518
36
Save Opportunities
49
.248
Opponent Batting Average
.246
.329
Opponent's On-base pct.
.324
.393
Opponent's Slugging pct.
.398
.722
Opponent's OPB Pct + SLG Pct
.721
3723
At Bats
3732
165
Doubles
163
22
Triples
14
49
Batters Hit
48
98
Stolen Bases
72
112
Games Played
112
1
Complete Games
0
8
Shutouts
8
37
Wild Pitches
29
489
Runs Batted In
470
4
Balks
3
986.1
Innings pitched
989.0
7.8
Strikeouts Per 9 Innings
8.3
30
Caught Stealing
35
112
Games Started
112
0.0
Wins Above Replacement
0.0
1
Is Qualified
1
523
Runs
484
481
Earned Runs
455
1463
Total Bases
1485
Fielding
112
Team Games Played
112
986
Full Innings
989
4083
Total Chances
3997
2959
Putouts
2967
1050
Assists
985
74
Errors
45
196
Double Plays
165
0.982
Fielding Percentage
0.989
36.6
Range Factor
36.0
0.0
Zone Rating
0.0
112
Games Played
112
0
Games Started
0
0.0
Defensive Wins Above Replacement
0.0
1
Qualified
1