

Guardians vs Brewers Live Score (21 Feb, 2026)
Game Information
Stage
EXH
Season
2026
First Pitch
Sat, Feb 21, 3:10 pm
Venue
American Family Fields of Phoenix
Location
Phoenix, Arizona
Venue Type
Outdoor
Attendance
3,797
Live Situation
2Balls
3Strikes
0Outs
—Pitcher
—At Bat
Pitch Sequence
1
STRIKE FOUL
Sinker
90 MPH
2
BALL
Four-seam FB
89 MPH
3
STRIKE SWINGING
Changeup
79 MPH
4
BALL
Four-seam FB
91 MPH
5
STRIKE SWINGING
Changeup
80 MPH
Injury Report


Team Stats
 CLE
MIL


9
Runs
6
10
Hits
10
1
Errors
1
2
Home Runs
1
8
Walks
5
8
Strikeouts
10
Player Box Score
Cleveland Guardians
| Player | H-AB | AB | R | H | RBI | HR | BB | K | #P | AVG | OBP | SLG |
|---|---|---|---|---|---|---|---|---|---|---|---|---|
 Chase DeLauter | 2-3 | 3 | 0 | 2 | 0 | 0 | 0 | 0 | 0 | .667 | .667 | .667 |
 Jaison Chourio | 0-2 | 2 | 0 | 0 | 0 | 0 | 0 | 0 | 0 | .000 | .000 | .000 |
 Brayan Rocchio | 1-3 | 3 | 0 | 1 | 0 | 0 | 0 | 1 | 0 | .333 | .333 | .333 |
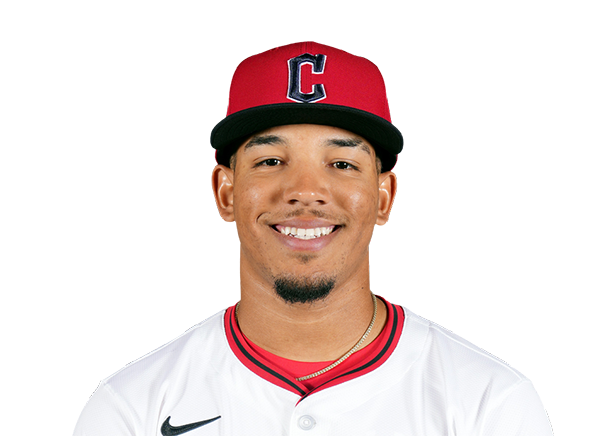 Angel Genao | 0-1 | 1 | 1 | 0 | 0 | 0 | 1 | 0 | 0 | .000 | .500 | .000 |
 Kyle Manzardo | 0-2 | 2 | 1 | 0 | 0 | 0 | 1 | 1 | 0 | .000 | .333 | .000 |
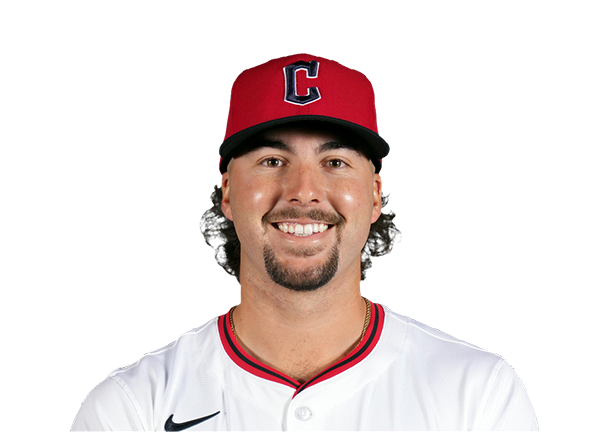 Kody Huff | 0-1 | 1 | 1 | 0 | 0 | 0 | 1 | 1 | 0 | .000 | .500 | .000 |
 Austin Hedges | 0-2 | 2 | 1 | 0 | 0 | 0 | 1 | 1 | 0 | .000 | .333 | .000 |
 Cooper Ingle | 1-2 | 2 | 1 | 1 | 3 | 1 | 0 | 0 | 0 | .500 | .500 | 2.000 |
 Daniel Schneemann | 1-3 | 3 | 0 | 1 | 0 | 0 | 0 | 0 | 0 | .333 | .333 | .333 |
|
Jose Devers | 1-2 | 2 | 0 | 1 | 0 | 0 | 0 | 1 | 0 | .500 | .500 | .500 |
 George Valera | 1-2 | 2 | 1 | 1 | 0 | 0 | 1 | 0 | 0 | .500 | .667 | .500 |
 Jacob Cozart | 1-2 | 2 | 1 | 1 | 0 | 0 | 0 | 1 | 0 | .500 | .500 | .500 |
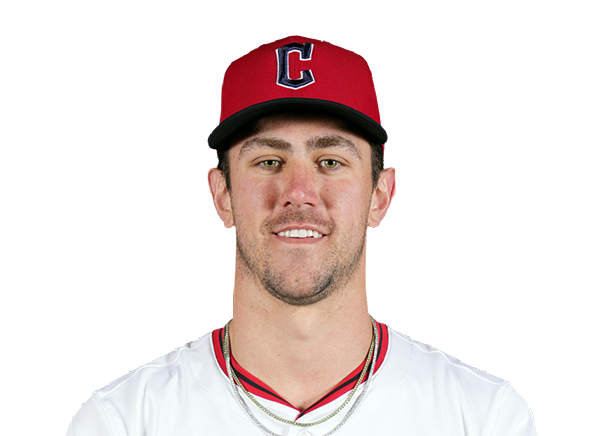 Nolan Jones | 2-3 | 3 | 1 | 2 | 4 | 1 | 0 | 0 | 0 | .667 | .667 | 2.000 |
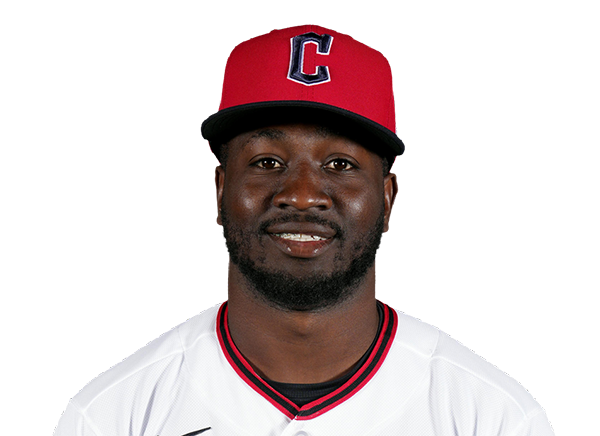 Wuilfredo Antunez | 0-1 | 1 | 0 | 0 | 0 | 0 | 1 | 0 | 0 | .000 | .500 | .000 |
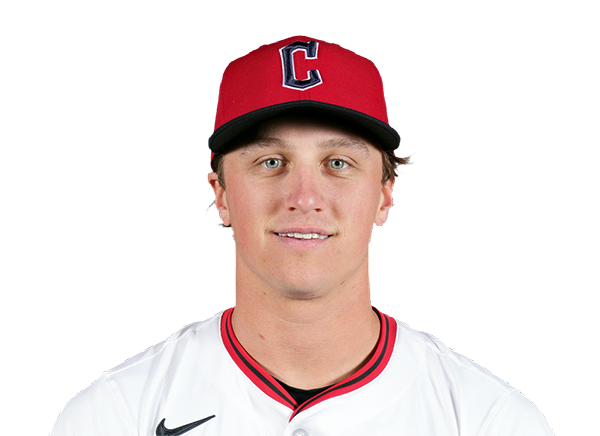 Petey Halpin | 0-2 | 2 | 1 | 0 | 0 | 0 | 1 | 0 | 0 | .000 | .333 | .000 |
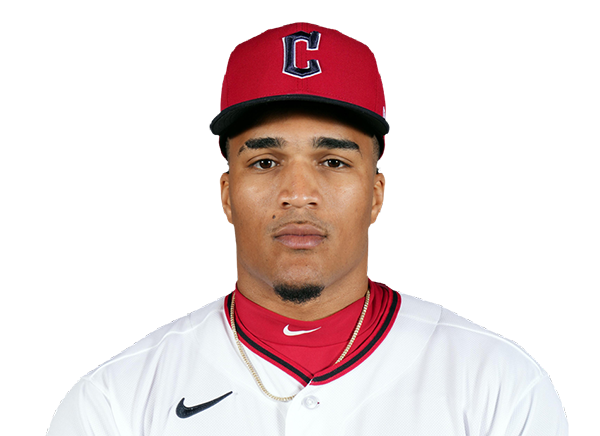 Alfonsin Rosario | 0-2 | 2 | 0 | 0 | 0 | 0 | 0 | 1 | 0 | .000 | .000 | .000 |
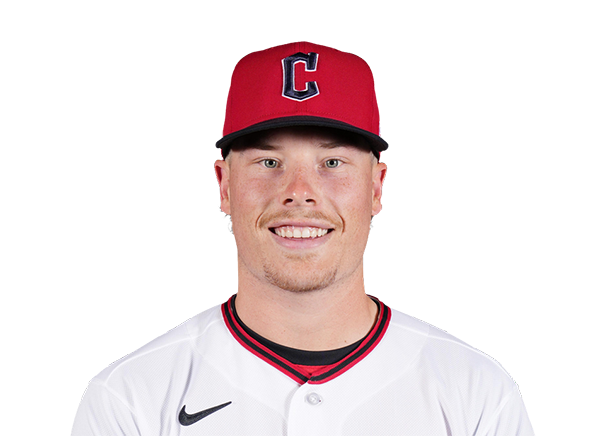 Travis Bazzana | 0-2 | 2 | 0 | 0 | 1 | 0 | 1 | 1 | 0 | .000 | .333 | .000 |
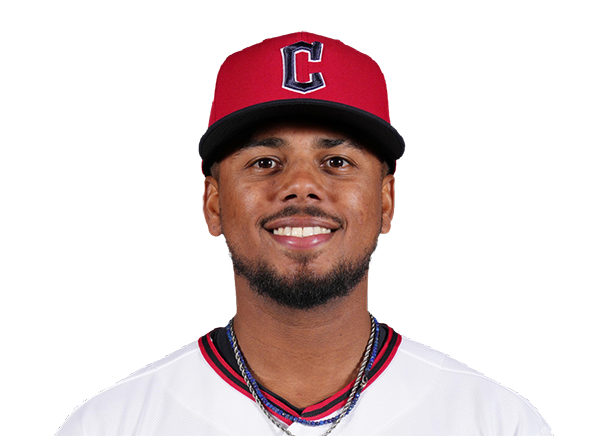 Dayan Frias | 0-1 | 1 | 0 | 0 | 0 | 0 | 0 | 0 | 0 | .000 | .000 | .000 |
Milwaukee Brewers
| Player | H-AB | AB | R | H | RBI | HR | BB | K | #P | AVG | OBP | SLG |
|---|---|---|---|---|---|---|---|---|---|---|---|---|
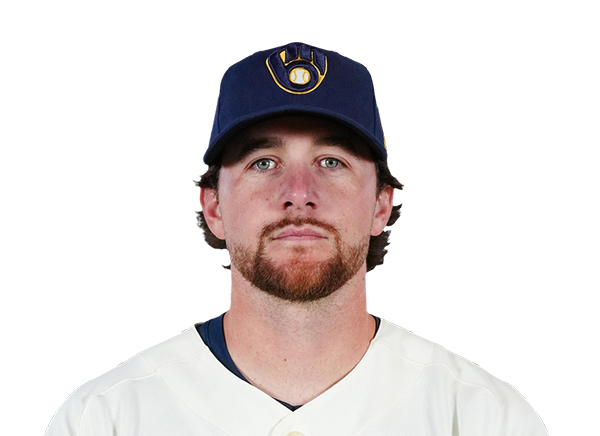 Brice Turang | 1-2 | 2 | 1 | 1 | 0 | 0 | 0 | 1 | 0 | .500 | .500 | .500 |
 Jett Williams | 0-3 | 3 | 0 | 0 | 0 | 0 | 0 | 0 | 0 | .000 | .000 | .000 |
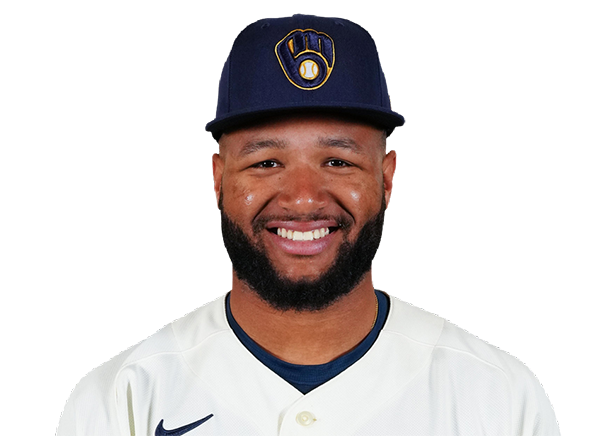 Jackson Chourio | 2-3 | 3 | 0 | 2 | 0 | 0 | 0 | 0 | 0 | .667 | .667 | .667 |
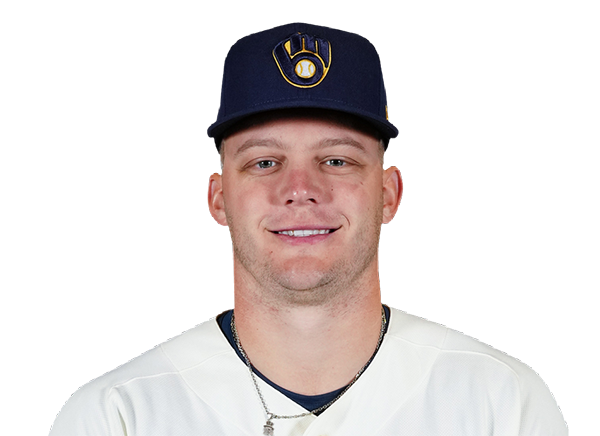 Brock Wilken | 0-1 | 1 | 0 | 0 | 0 | 0 | 1 | 0 | 0 | .000 | .500 | .000 |
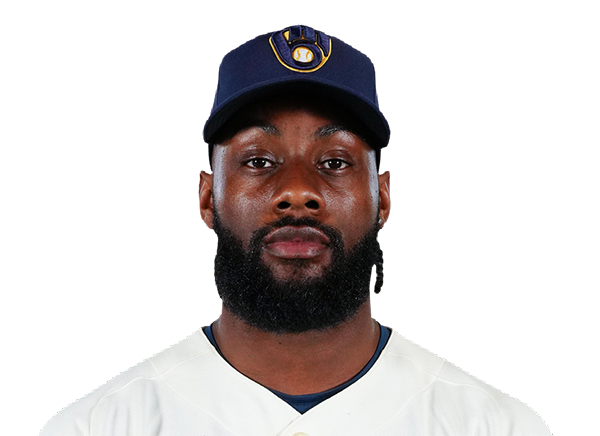 Akil Baddoo | 1-2 | 2 | 0 | 1 | 1 | 0 | 0 | 1 | 0 | .500 | .333 | .500 |
|
Joshua Adamczewski | 0-1 | 1 | 0 | 0 | 0 | 0 | 1 | 0 | 0 | .000 | .500 | .000 |
 Joey Ortiz | 0-3 | 3 | 0 | 0 | 0 | 0 | 0 | 1 | 0 | .000 | .000 | .000 |
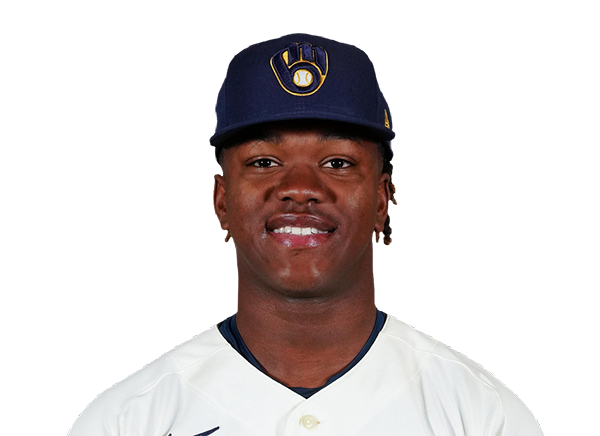 Jesus Made | 0-2 | 2 | 0 | 0 | 0 | 0 | 0 | 1 | 0 | .000 | .000 | .000 |
 Tyler Black | 1-2 | 2 | 1 | 1 | 0 | 0 | 1 | 0 | 0 | .500 | .667 | .500 |
|
Jon Adams | 0-0 | 0 | 1 | 0 | 0 | 0 | 2 | 0 | 0 | .000 | 1.000 | .000 |
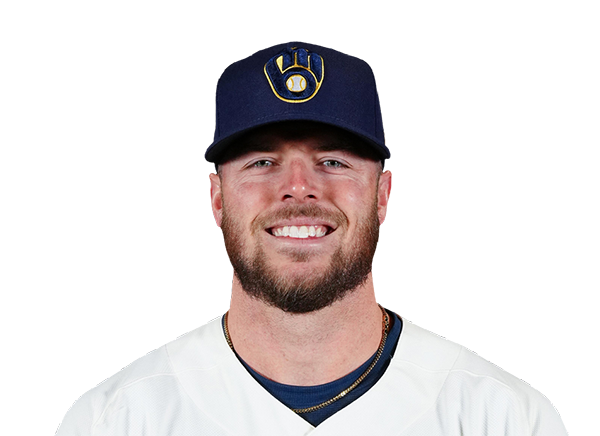 Brandon Lockridge | 2-3 | 3 | 2 | 2 | 1 | 1 | 0 | 0 | 0 | .667 | .667 | 1.667 |
|
Luis Pena | 1-1 | 1 | 1 | 1 | 0 | 0 | 0 | 0 | 0 | 1.000 | 1.000 | 1.000 |
 Jordyn Adams | 0-2 | 2 | 0 | 0 | 0 | 0 | 0 | 2 | 0 | .000 | .000 | .000 |
 David Hamilton | 1-3 | 3 | 0 | 1 | 2 | 0 | 0 | 1 | 0 | .333 | .333 | .667 |
 Reese McGuire | 0-3 | 3 | 0 | 0 | 0 | 0 | 0 | 2 | 0 | .000 | .000 | .000 |
 Matthew Wood | 0-1 | 1 | 0 | 0 | 0 | 0 | 0 | 0 | 0 | .000 | .000 | .000 |
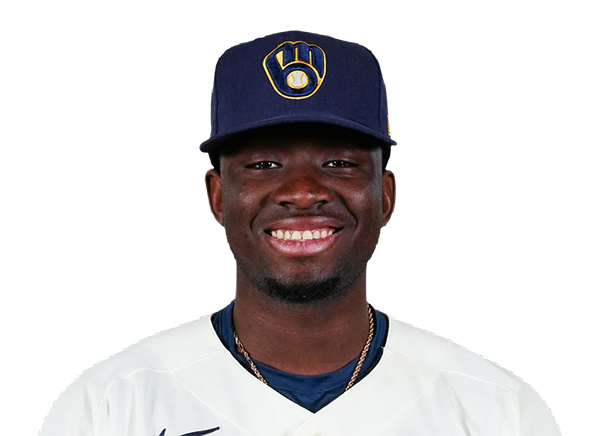 Luis Lara | 0-3 | 3 | 0 | 0 | 0 | 0 | 0 | 1 | 0 | .000 | .000 | .000 |
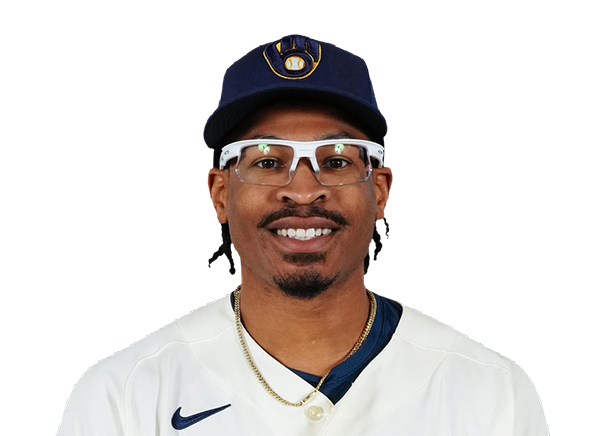 Greg Jones | 1-1 | 1 | 0 | 1 | 2 | 0 | 0 | 0 | 0 | 1.000 | 1.000 | 1.000 |
Cleveland Guardians
| Player | IP | H | R | ER | BB | K | HR | PC-ST | ERA | PC |
|---|---|---|---|---|---|---|---|---|---|---|
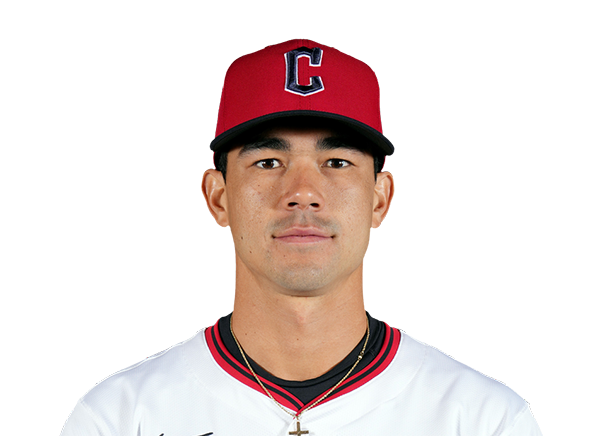 Joey Cantillo | 1.1 | 3 | 2 | 2 | 0 | 2 | 1 | ----- | 13.50 | -- |
|
Izaak Martinez | 0.2 | 0 | 0 | 0 | 0 | 0 | 0 | ----- | 0.00 | -- |
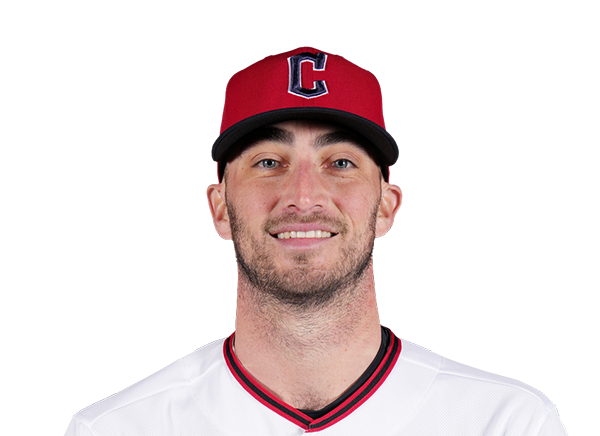 Connor Brogdon | 1.0 | 0 | 0 | 0 | 0 | 2 | 0 | ----- | 0.00 | -- |
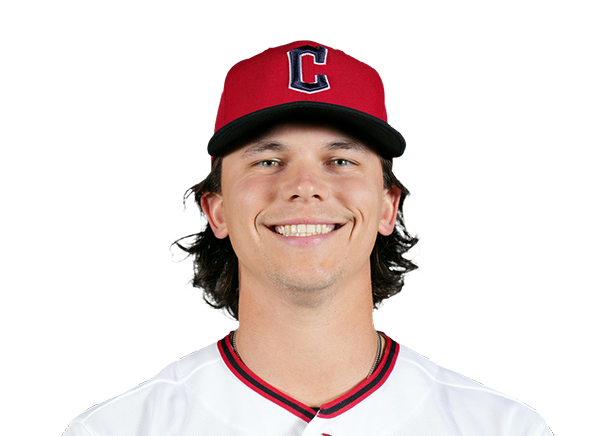 Ryan Webb | 1.1 | 4 | 2 | 2 | 0 | 1 | 0 | ----- | 13.50 | -- |
|
Jack Carey | 0.2 | 1 | 0 | 0 | 1 | 0 | 0 | ----- | 0.00 | -- |
 Jack Leftwich | 1.0 | 0 | 0 | 0 | 0 | 2 | 0 | ----- | 0.00 | -- |
|
Matthew Jachec | 1.0 | 0 | 0 | 0 | 1 | 1 | 0 | ----- | 0.00 | -- |
|
Zane Morehouse | 1.0 | 2 | 2 | 2 | 1 | 1 | 0 | ----- | 18.00 | -- |
|
Xavier Martinez | 1.0 | 0 | 0 | 0 | 2 | 1 | 0 | ----- | 0.00 | -- |
Milwaukee Brewers
| Player | IP | H | R | ER | BB | K | HR | PC-ST | ERA | PC |
|---|---|---|---|---|---|---|---|---|---|---|
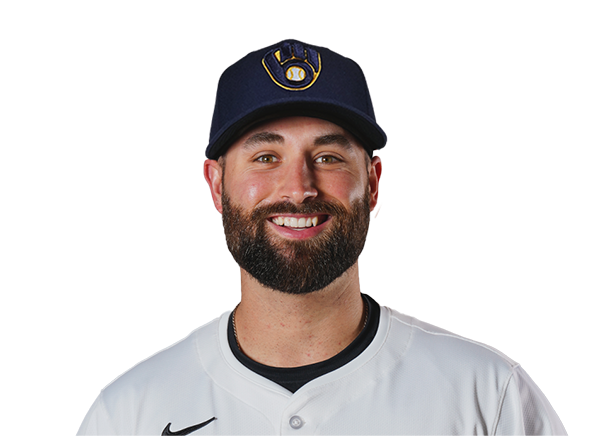 Garrett Stallings | 1.0 | 2 | 0 | 0 | 0 | 0 | 0 | ----- | 0.00 | -- |
|
Blake Holub | 1.0 | 1 | 0 | 0 | 0 | 0 | 0 | ----- | 0.00 | -- |
|
Matthew Childers | 1.0 | 1 | 0 | 0 | 0 | 1 | 0 | ----- | 0.00 | -- |
|
Jaron Deberry | 0.1 | 1 | 3 | 2 | 4 | 0 | 0 | ----- | 54.00 | -- |
|
Jesús Broca | 0.2 | 0 | 0 | 0 | 0 | 1 | 0 | ----- | 0.00 | -- |
|
Tyson Hardin | 1.0 | 2 | 3 | 3 | 1 | 1 | 1 | ----- | 27.00 | -- |
|
Brett Wichrowski | 1.0 | 3 | 3 | 3 | 2 | 1 | 1 | ----- | 27.00 | -- |
|
Edwin Jimenez | 1.0 | 0 | 0 | 0 | 0 | 1 | 0 | ----- | 0.00 | -- |
|
Manuel Rodriguez | 1.0 | 0 | 0 | 0 | 0 | 1 | 0 | ----- | 0.00 | -- |
|
Mark Manfredi | 1.0 | 0 | 0 | 0 | 1 | 2 | 0 | ----- | 0.00 | -- |
H2H / Season Series
CLE1–0
MIL
MIL6–9
CLE
Last 5 Games
| Date | Opponent | Result |
|---|---|---|
| Sep 2 |  vs TOR | L0–11 |
| Sep 1 | vs TOR | W6–1 |
| Aug 30 |  vs KC | W11–1 |
| Aug 29 | vs KC | L3–8 |
| Aug 28 | vs KC | L0–3 |
| Date | Opponent | Result |
|---|---|---|
| Sep 2 |  @ CHC | W9–5 |
| Sep 1 | @ CHC | W9–4 |
| Aug 31 | @ CHC | L3–17 |
| Aug 30 |  vs TEX | L4–7 |
| Aug 29 | vs TEX | W5–3 |
Standings
American League
| Team | W | L | PCT | GB | DIFF | STRK |
|---|---|---|---|---|---|---|
1 Rays | 83 | 56 | .597 | - | +51 | L1 |
2 White Sox | 73 | 66 | .525 | 10 | +43 | L1 |
3 Astros | 71 | 69 | .507 | 12.5 | -42 | W1 |
4 Yankees | 80 | 60 | .571 | 3.5 | +115 | W2 |
5 Red Sox | 75 | 65 | .536 | 8.5 | +77 | L2 |
| 6Guardians | 70 | 69 | .504 | 13 | -8 | L1 |
| 7Rangers | 69 | 71 | .493 | 14.5 | -48 | L1 |
| 8Blue Jays | 69 | 71 | .493 | 14.5 | -44 | W1 |
9 Orioles | 69 | 71 | .493 | 14.5 | -20 | L2 |
10 Twins | 67 | 73 | .479 | 16.5 | -38 | L1 |
11 Mariners | 66 | 74 | .471 | 17.5 | -65 | W2 |
12 Tigers | 64 | 75 | .460 | 19 | +47 | W1 |
| 13Royals | 62 | 78 | .443 | 21.5 | -89 | L3 |
14 Athletics | 54 | 86 | .386 | 29.5 | -194 | W1 |
15 Angels | 53 | 87 | .379 | 30.5 | -80 | L2 |
National League
| Team | W | L | PCT | GB | DIFF | STRK |
|---|---|---|---|---|---|---|
| 1Brewers | 87 | 53 | .621 | - | +172 | W2 |
2 Braves | 83 | 57 | .593 | 4 | +118 | W1 |
3 Dodgers | 82 | 57 | .590 | 4.5 | +146 | L2 |
4 Phillies | 79 | 61 | .564 | 8 | +36 | L1 |
| 5Cubs | 78 | 62 | .557 | 9 | +132 | L2 |
6 Diamondbacks | 74 | 67 | .525 | 13.5 | -1 | W1 |
7 Padres | 73 | 67 | .521 | 14 | +10 | L2 |
8 Marlins | 71 | 69 | .507 | 16 | +18 | W2 |
9 Cardinals | 70 | 70 | .500 | 17 | -8 | W2 |
10 Pirates | 68 | 72 | .486 | 19 | +26 | L1 |
11 Reds | 67 | 73 | .479 | 20 | -108 | W2 |
12 Nationals | 67 | 75 | .472 | 21 | +14 | L1 |
13 Mets | 63 | 77 | .450 | 24 | -50 | W1 |
14 Giants | 58 | 82 | .414 | 29 | -70 | W1 |
15 Rockies | 54 | 86 | .386 | 33 | -140 | W2 |
CLE
VS
MIL
Pitchers
Joey Cantillo
Izaak Martinez
Connor Brogdon
Ryan Webb
Jack Carey
Jack Leftwich
Matthew Jachec
Zane Morehouse
Xavier Martinez
Catchers
Austin Hedges
Cooper Ingle
Infielders
Brayan Rocchio
Angel Genao
Kyle Manzardo
Kody Huff
Daniel Schneemann
Jose Devers
Travis Bazzana
Dayan Frias
Outfielders
Chase DeLauter
Jaison Chourio
Nolan Jones
Wuilfredo Antunez
Petey Halpin
Alfonsin Rosario
Designated Hitters
George Valera
Jacob Cozart
Pitchers
Garrett Stallings
Blake Holub
Matthew Childers
Jaron Deberry
Jesús Broca
Tyson Hardin
Brett Wichrowski
Edwin Jimenez
Manuel Rodriguez
Mark Manfredi
Catchers
Reese McGuire
Matthew Wood
Infielders
Brice Turang
Jett Williams
Joey Ortiz
Jesus Made
Tyler Black
Jon Adams
Luis Pena
David Hamilton
Outfielders
Akil Baddoo
Joshua Adamczewski
Brandon Lockridge
Jordyn Adams
Luis Lara
Greg Jones
Designated Hitters
Jackson Chourio
Brock Wilken
Guardians
VS
Brewers
Batting
139
Team Games Played
140
4632
At Bats
4752
1095
Hits
1221
540
Runs Batted In
664
130
Home Runs
130
129
Stolen Bases
136
.236
Batting Average
.257
563
Runs
704
210
Doubles
246
13
Triples
22
1721
Total Bases
1901
498
Walks
578
1120
Strikeouts
1166
.314
On Base Percentage
.340
.372
Slugging Percentage
.400
.686
OBP Pct + SLG Pct
.740
139
Games Played
140
139
Games Started
140
45
Hit By Pitch
37
0.0
Wins Above Replacement
0.0
0.0
Offensive Wins Above Replacement
0.0
27
Caught Stealing
44
1
Is Qualified
1
569.0
Runs Created
672.5
4.1
Runs Created Per 27 Outs
4.9
.095
Walks Per Plate Appearance
.106
0.44
Walk To Strikeout Ratio
0.50
.135
Isolated Power
.143
.265
Secondary Average
.284
3.95
Pitches Per Plate Appearance
4.00
353
Extra Base Hits
398
5240
Plate Appearances
5443
35.6
At Bats Per Home Run
36.6
24
Sacrifice Hit
31
39
Sacrifice Flies
38
Pitching
139
Team Games Played
140
51
Quality Starts
48
70
Wins
87
69
Losses
53
40
Saves
44
101
Holds
76
1098
Hits
1026
510
Earned runs
484
156
Home Runs
147
453
Walks
445
1296
Strikeouts
1340
9.5
Strikeouts Per 9 Innings
9.6
147.7
Pitches Per Start
145.7
1.26
Walks Plus Hits Per Inning Pitched
1.18
3.72
Earned Run Average
3.48
69
Losses
53
1233.2
Innings pitched
1251.2
.504
Win Percentage
.621
54
Save Opportunities
62
.236
Opponent Batting Average
.221
.310
Opponent's On-base pct.
.296
.390
Opponent's Slugging pct.
.362
.700
Opponent's OPB Pct + SLG Pct
.658
4643
At Bats
4638
215
Doubles
185
15
Triples
14
58
Batters Hit
56
92
Stolen Bases
61
139
Games Played
140
0
Complete Games
1
4
Shutouts
9
53
Wild Pitches
45
541
Runs Batted In
510
2
Balks
6
1233.2
Innings pitched
1251.2
9.5
Strikeouts Per 9 Innings
9.6
19
Caught Stealing
29
139
Games Started
140
0.0
Wins Above Replacement
0.0
1
Is Qualified
1
571
Runs
532
510
Earned Runs
484
1811
Total Bases
1680
Fielding
139
Team Games Played
140
1234
Full Innings
1252
4849
Total Chances
4921
3701
Putouts
3755
1075
Assists
1102
73
Errors
64
210
Double Plays
246
0.985
Fielding Percentage
0.987
34.8
Range Factor
34.9
0.0
Zone Rating
0.0
139
Games Played
140
0
Games Started
0
0.0
Defensive Wins Above Replacement
0.0
1
Qualified
1