

Guardians vs Cardinals Live Score (15 Apr, 2026)
Game Information
Stage
Standard
Season
2026
First Pitch
Wed, Apr 15, 1:15 pm
Venue
Busch Stadium
Location
St. Louis, Missouri
Attendance
22,642
Live Situation
2Balls
1Strikes
0Outs
—Pitcher
—At Bat
Pitch Sequence
1
BALL
Sinker
99 MPH
2
STRIKE LOOKING
Sinker
98 MPH
3
BALL
Sweeper
82 MPH
4
BALL IN PLAY
Sinker
99 MPH
Injury Report
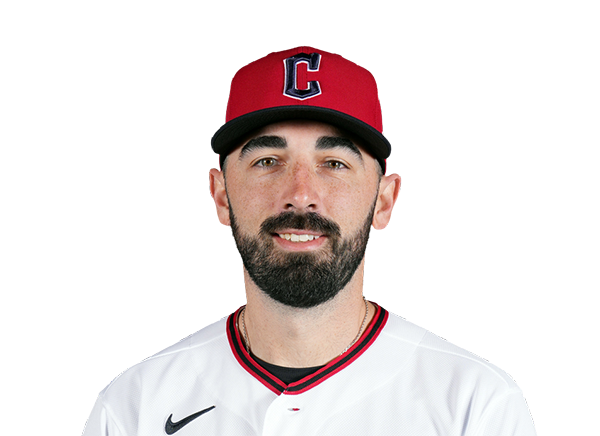

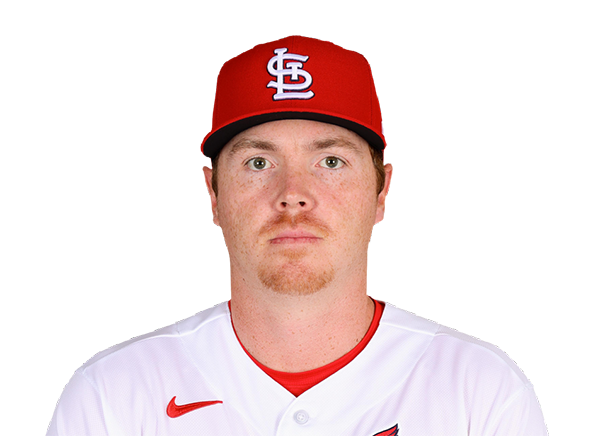
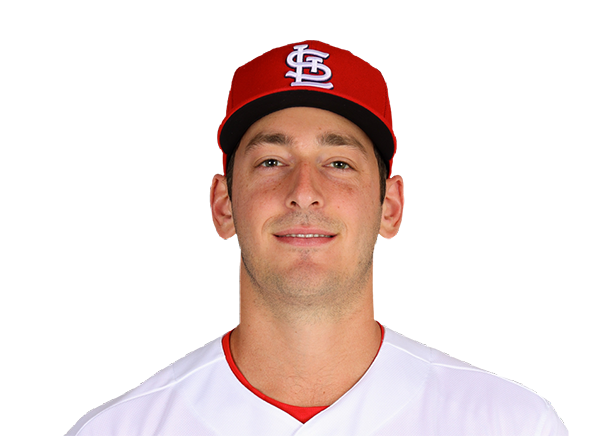

Team Stats
 CLE
STL


3
Runs
5
8
Hits
9
0
Errors
0
0
Home Runs
0
2
Walks
7
8
Strikeouts
7
Player Box Score
Cleveland Guardians
| Player | H-AB | AB | R | H | RBI | HR | BB | K | #P | AVG | OBP | SLG |
|---|---|---|---|---|---|---|---|---|---|---|---|---|
 Steven Kwan | 1-4 | 4 | 0 | 1 | 0 | 0 | 0 | 0 | 21 | .239 | .316 | .324 |
 Chase DeLauter | 0-3 | 3 | 0 | 0 | 0 | 0 | 1 | 0 | 19 | .259 | .343 | .586 |
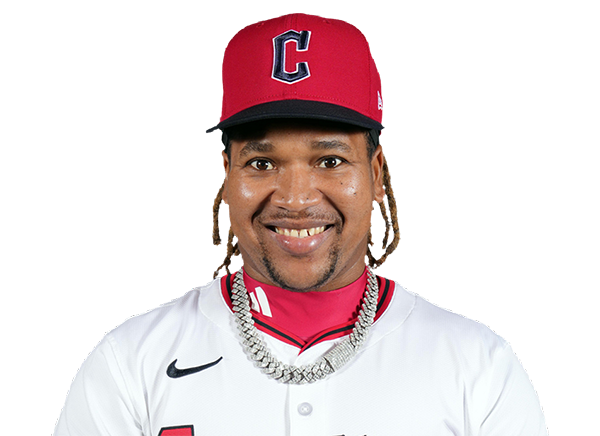 Jose Ramirez | 0-4 | 4 | 1 | 0 | 0 | 0 | 0 | 1 | 15 | .205 | .301 | .384 |
 Kyle Manzardo | 2-2 | 2 | 0 | 2 | 1 | 0 | 0 | 0 | 9 | .180 | .268 | .260 |
 Angel Martinez | 0-2 | 2 | 0 | 0 | 0 | 0 | 0 | 1 | 9 | .302 | .362 | .491 |
 George Valera | 1-2 | 2 | 0 | 1 | 0 | 0 | 0 | 1 | 5 | .333 | .333 | .667 |
 Rhys Hoskins | 0-1 | 1 | 1 | 0 | 0 | 0 | 1 | 1 | 12 | .205 | .327 | .386 |
 Juan Brito | 0-4 | 4 | 0 | 0 | 0 | 0 | 0 | 2 | 17 | .222 | .276 | .296 |
 Daniel Schneemann | 2-3 | 3 | 1 | 2 | 0 | 0 | 0 | 1 | 12 | .295 | .340 | .500 |
 Bo Naylor | 1-3 | 3 | 0 | 1 | 2 | 0 | 0 | 1 | 15 | .158 | .238 | .184 |
 Brayan Rocchio | 1-3 | 3 | 0 | 1 | 0 | 0 | 0 | 0 | 13 | .211 | .338 | .333 |
St. Louis Cardinals
| Player | H-AB | AB | R | H | RBI | HR | BB | K | #P | AVG | OBP | SLG |
|---|---|---|---|---|---|---|---|---|---|---|---|---|
 JJ Wetherholt | 0-1 | 1 | 0 | 0 | 1 | 0 | 2 | 0 | 23 | .227 | .354 | .379 |
 Ivan Herrera | 0-2 | 2 | 0 | 0 | 0 | 0 | 3 | 0 | 22 | .194 | .386 | .290 |
 Alec Burleson | 2-5 | 5 | 0 | 2 | 2 | 0 | 0 | 2 | 14 | .279 | .375 | .412 |
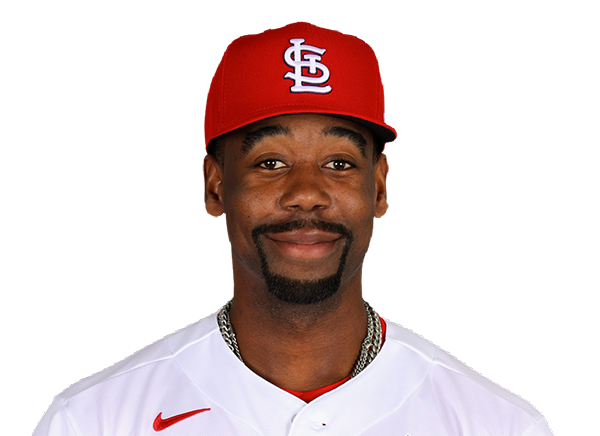 Jordan Walker | 1-5 | 5 | 0 | 1 | 0 | 0 | 0 | 2 | 20 | .319 | .373 | .710 |
 Nolan Gorman | 1-4 | 4 | 0 | 1 | 0 | 0 | 0 | 0 | 12 | .208 | .290 | .321 |
 Ramon Urias | 0-1 | 1 | 1 | 0 | 0 | 0 | 0 | 0 | 1 | .212 | .316 | .485 |
 Masyn Winn | 1-4 | 4 | 1 | 1 | 0 | 0 | 0 | 1 | 14 | .188 | .339 | .250 |
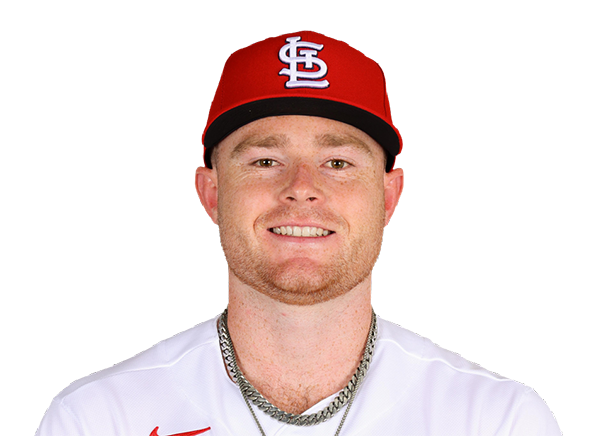 Nathan Church | 3-4 | 4 | 2 | 3 | 1 | 0 | 0 | 0 | 8 | .205 | .238 | .308 |
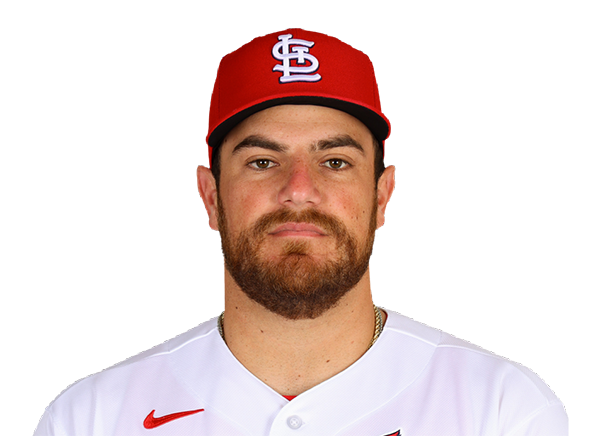 Pedro Pages | 1-3 | 3 | 0 | 1 | 1 | 0 | 0 | 0 | 14 | .206 | .263 | .324 |
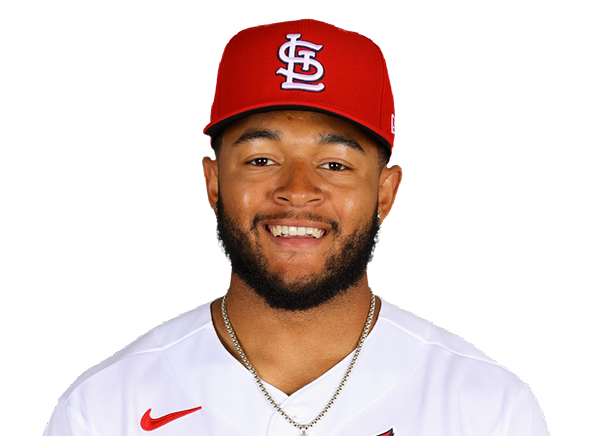 Victor Scott II | 0-2 | 2 | 1 | 0 | 0 | 0 | 2 | 2 | 21 | .255 | .294 | .277 |
Cleveland Guardians
| Player | IP | H | R | ER | BB | K | HR | PC-ST | ERA | PC |
|---|---|---|---|---|---|---|---|---|---|---|
 Slade Cecconi | 4.0 | 3 | 1 | 1 | 5 | 4 | 0 | 87-52 | 5.03 | 87 |
 Connor Brogdon | 1.1 | 2 | 3 | 3 | 1 | 0 | 0 | 18-10 | 6.43 | 18 |
 Tim Herrin | 0.1 | 1 | 0 | 0 | 1 | 0 | 0 | 8-6 | 0.00 | 8 |
 Matt Festa | 2.1 | 3 | 1 | 1 | 0 | 3 | 0 | 36-25 | 7.00 | 36 |
St. Louis Cardinals
| Player | IP | H | R | ER | BB | K | HR | PC-ST | ERA | PC |
|---|---|---|---|---|---|---|---|---|---|---|
 Dustin May | 6.0 | 6 | 1 | 1 | 1 | 4 | 0 | 91-59 | 6.98 | 91 |
 Justin Bruihl | 0.2 | 2 | 2 | 2 | 1 | 1 | 0 | 24-15 | 8.00 | 24 |
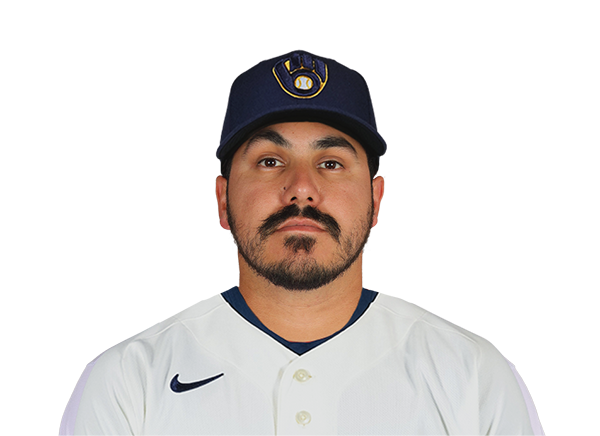 JoJo Romero | 1.1 | 0 | 0 | 0 | 0 | 1 | 0 | 17-10 | 0.00 | 17 |
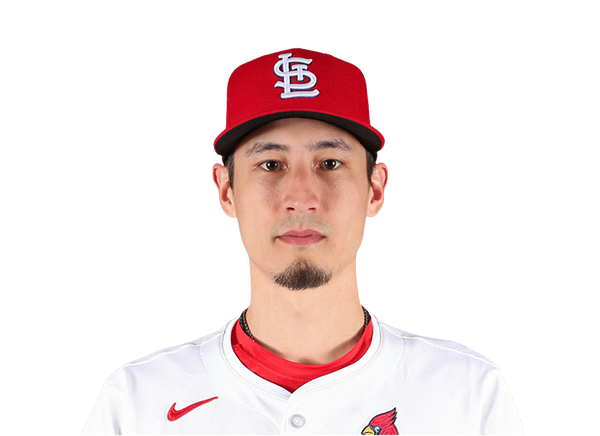 Riley O'Brien | 1.0 | 0 | 0 | 0 | 0 | 2 | 0 | 15-10 | 0.00 | 15 |
H2H / Season Series
STL5–3
CLE
STL6–5
CLE
STL3–9
CLE
Last 5 Games
| Date | Opponent | Result |
|---|---|---|
| Aug 21 |  @ COL | W9–1 |
| Aug 20 |  vs SF | W5–2 |
| Aug 19 | vs SF | L0–1 |
| Aug 18 | vs SF | W8–1 |
| Aug 16 |  vs SD | L0–5 |
| Date | Opponent | Result |
|---|---|---|
| Aug 21 |  @ PHI | L6–7 |
| Aug 20 |  @ CIN | W10–9 |
| Aug 19 | @ CIN | L4–5 |
| Aug 18 | @ CIN | W3–0 |
| Aug 17 | @ CIN | L5–6 |
Standings
American League
| Team | W | L | PCT | GB | DIFF | STRK |
|---|---|---|---|---|---|---|
1 Rays | 76 | 52 | .594 | - | +43 | L2 |
2 White Sox | 67 | 61 | .523 | 9 | +47 | W1 |
3 Astros | 65 | 64 | .504 | 11.5 | -42 | W1 |
4 Yankees | 73 | 56 | .566 | 3.5 | +95 | L1 |
5 Red Sox | 69 | 59 | .539 | 7 | +97 | W1 |
6 Rangers | 64 | 65 | .496 | 12.5 | -45 | W2 |
7 Blue Jays | 64 | 67 | .489 | 13.5 | -50 | W1 |
8 Twins | 63 | 66 | .488 | 13.5 | -45 | L1 |
| 9Guardians | 63 | 66 | .488 | 13.5 | -15 | W2 |
10 Orioles | 62 | 67 | .481 | 14.5 | -34 | W1 |
11 Tigers | 61 | 67 | .477 | 15 | +79 | L3 |
12 Mariners | 61 | 68 | .473 | 15.5 | -45 | W1 |
13 Royals | 56 | 74 | .431 | 21 | -97 | W6 |
14 Angels | 51 | 78 | .395 | 25.5 | -71 | L1 |
15 Athletics | 49 | 80 | .380 | 27.5 | -189 | L5 |
National League
| Team | W | L | PCT | GB | DIFF | STRK |
|---|---|---|---|---|---|---|
1 Brewers | 81 | 49 | .623 | - | +163 | W3 |
2 Dodgers | 78 | 51 | .605 | 2.5 | +146 | W4 |
3 Braves | 75 | 55 | .577 | 6 | +108 | L2 |
4 Cubs | 74 | 55 | .574 | 6.5 | +99 | L2 |
| 5Phillies | 71 | 58 | .550 | 9.5 | +16 | W7 |
| 6Padres | 69 | 60 | .535 | 11.5 | +7 | W1 |
7 Diamondbacks | 68 | 61 | .527 | 12.5 | +13 | W2 |
8 Marlins | 66 | 64 | .508 | 15 | +17 | W2 |
| 9Cardinals | 66 | 64 | .508 | 15 | +9 | L1 |
10 Pirates | 63 | 67 | .485 | 18 | +30 | L1 |
| 11Reds | 61 | 68 | .473 | 19.5 | -98 | L2 |
12 Nationals | 61 | 70 | .466 | 20.5 | +14 | L3 |
13 Mets | 58 | 71 | .450 | 22.5 | -44 | L1 |
| 14Giants | 52 | 76 | .406 | 28 | -78 | L2 |
| 15Rockies | 50 | 78 | .391 | 30 | -130 | L4 |
CLE
VS
STL
Pitchers
Slade Cecconi
Connor Brogdon
Tim Herrin
Matt Festa
Catchers
Bo Naylor
Infielders
Kyle Manzardo
Rhys Hoskins
Juan Brito
Daniel Schneemann
Brayan Rocchio
Outfielders
Steven Kwan
Chase DeLauter
Angel Martinez
George Valera
Designated Hitters
Jose Ramirez
Pitchers
Dustin May
Justin Bruihl
JoJo Romero
Riley O'Brien
Catchers
Pedro Pages
Infielders
JJ Wetherholt
Alec Burleson
Nolan Gorman
Ramon Urias
Masyn Winn
Outfielders
Jordan Walker
Nathan Church
Victor Scott II
Designated Hitters
Ivan Herrera
Guardians
VS
Cardinals
Batting
129
Team Games Played
130
4289
At Bats
4364
1005
Hits
1052
493
Runs Batted In
563
122
Home Runs
135
124
Stolen Bases
80
.234
Batting Average
.241
516
Runs
578
194
Doubles
186
11
Triples
13
1587
Total Bases
1669
469
Walks
426
1051
Strikeouts
1012
.314
On Base Percentage
.318
.370
Slugging Percentage
.382
.684
OBP Pct + SLG Pct
.700
129
Games Played
130
129
Games Started
130
42
Hit By Pitch
83
0.0
Wins Above Replacement
0.0
0.0
Offensive Wins Above Replacement
0.0
25
Caught Stealing
22
1
Is Qualified
1
526.6
Runs Created
541.6
4.1
Runs Created Per 27 Outs
4.2
.097
Walks Per Plate Appearance
.086
0.45
Walk To Strikeout Ratio
0.42
.136
Isolated Power
.141
.268
Secondary Average
.252
3.95
Pitches Per Plate Appearance
3.86
327
Extra Base Hits
334
4858
Plate Appearances
4936
35.2
At Bats Per Home Run
32.3
23
Sacrifice Hit
19
33
Sacrifice Flies
42
Pitching
129
Team Games Played
130
45
Quality Starts
47
63
Wins
66
66
Losses
64
36
Saves
38
96
Holds
84
1020
Hits
1100
478
Earned runs
523
147
Home Runs
126
428
Walks
442
1205
Strikeouts
1006
9.5
Strikeouts Per 9 Innings
7.8
147.8
Pitches Per Start
148.8
1.27
Walks Plus Hits Per Inning Pitched
1.33
3.76
Earned Run Average
4.06
66
Losses
64
1142.2
Innings pitched
1159.1
.488
Win Percentage
.508
50
Save Opportunities
62
.237
Opponent Batting Average
.251
.311
Opponent's On-base pct.
.325
.392
Opponent's Slugging pct.
.392
.703
Opponent's OPB Pct + SLG Pct
.717
4303
At Bats
4389
196
Doubles
222
15
Triples
11
50
Batters Hit
58
88
Stolen Bases
89
129
Games Played
130
0
Complete Games
1
4
Shutouts
9
49
Wild Pitches
52
506
Runs Batted In
541
2
Balks
3
1142.2
Innings pitched
1159.1
9.5
Strikeouts Per 9 Innings
7.8
18
Caught Stealing
21
129
Games Started
130
0.0
Wins Above Replacement
0.0
1
Is Qualified
1
531
Runs
569
478
Earned Runs
523
1687
Total Bases
1722
Fielding
129
Team Games Played
130
1143
Full Innings
1159
4501
Total Chances
4752
3428
Putouts
3478
1005
Assists
1219
68
Errors
55
194
Double Plays
186
0.985
Fielding Percentage
0.988
34.9
Range Factor
36.5
0.0
Zone Rating
0.0
129
Games Played
130
0
Games Started
0
0.0
Defensive Wins Above Replacement
0.0
1
Qualified
1