

Guardians vs Mariners Live Score (29 Mar, 2026)
Game Information
Stage
Standard
Season
2026
First Pitch
Sun, Mar 29, 7:20 pm
Venue
T-Mobile Park
Location
Seattle, Washington
Attendance
30,800
Live Situation
2Balls
2Strikes
0Outs
—Pitcher
—At Bat
Pitch Sequence
1
STRIKE LOOKING
Sinker
89 MPH
2
STRIKE SWINGING
Changeup
84 MPH
3
BALL
Cutter
87 MPH
4
BALL
Sweeper
80 MPH
5
BALL IN PLAY
Sweeper
78 MPH
Injury Report

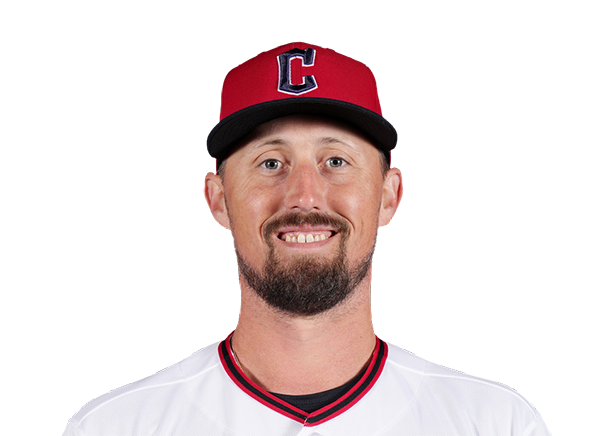

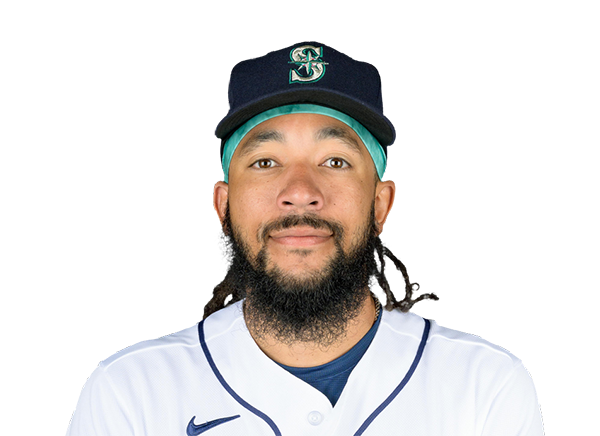

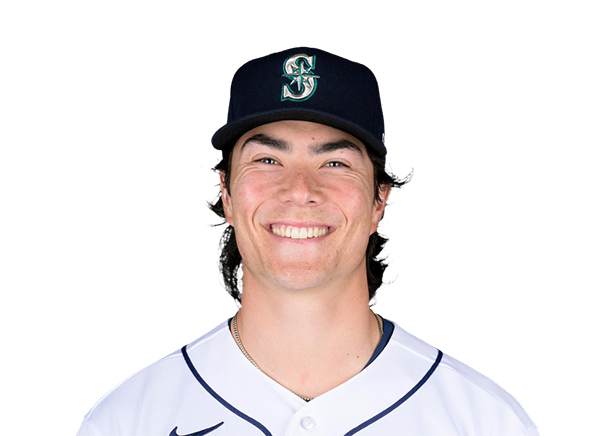
Team Stats
 CLE
SEA


0
Runs
8
2
Hits
9
1
Errors
0
0
Home Runs
1
1
Walks
5
14
Strikeouts
8
Player Box Score
Cleveland Guardians
| Player | H-AB | AB | R | H | RBI | HR | BB | K | #P | AVG | OBP | SLG |
|---|---|---|---|---|---|---|---|---|---|---|---|---|
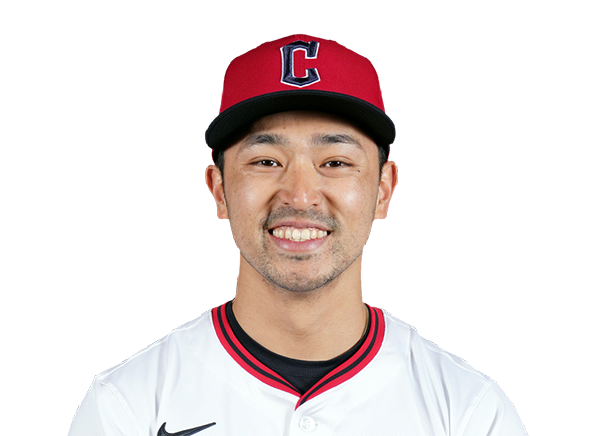 Steven Kwan | 0-3 | 3 | 0 | 0 | 0 | 0 | 0 | 0 | 12 | .235 | .235 | .235 |
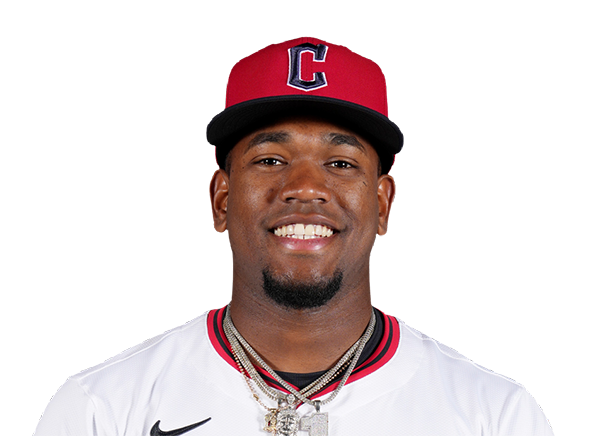 Angel Martinez | 0-1 | 1 | 0 | 0 | 0 | 0 | 0 | 1 | 6 | .143 | .143 | .286 |
 Chase DeLauter | 1-3 | 3 | 0 | 1 | 0 | 0 | 0 | 1 | 12 | .353 | .353 | 1.059 |
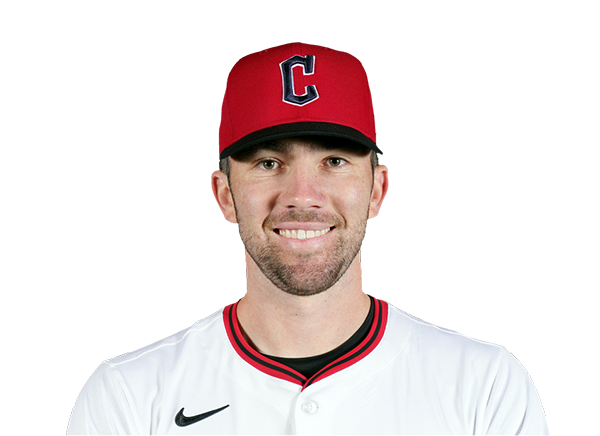 David Fry | 0-1 | 1 | 0 | 0 | 0 | 0 | 0 | 0 | 5 | .333 | .333 | .500 |
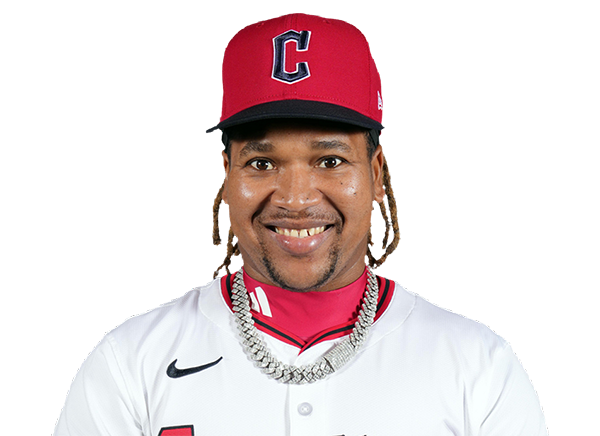 Jose Ramirez | 0-2 | 2 | 0 | 0 | 0 | 0 | 1 | 2 | 16 | .125 | .176 | .250 |
 Kyle Manzardo | 0-3 | 3 | 0 | 0 | 0 | 0 | 0 | 2 | 13 | .125 | .176 | .125 |
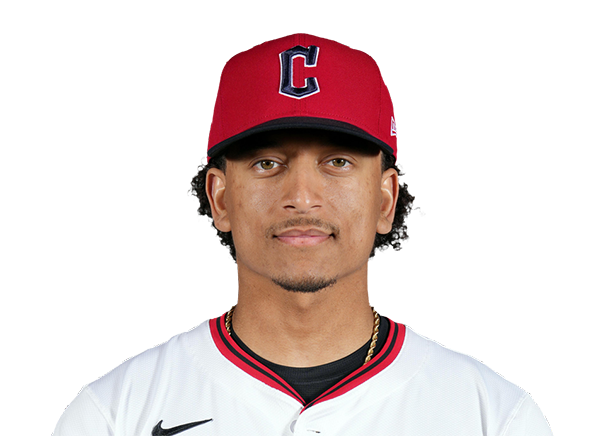 Bo Naylor | 0-3 | 3 | 0 | 0 | 0 | 0 | 0 | 3 | 19 | .091 | .167 | .091 |
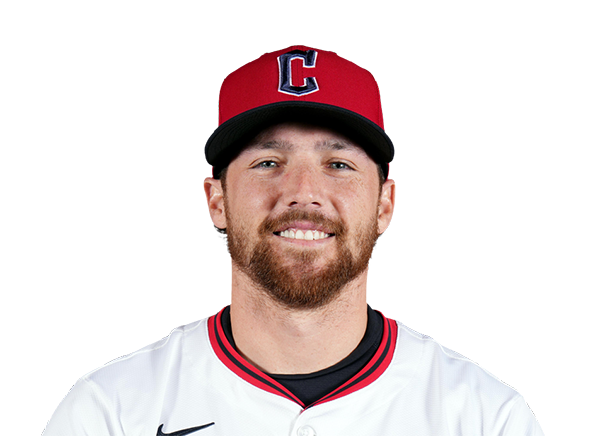 Daniel Schneemann | 1-3 | 3 | 0 | 1 | 0 | 0 | 0 | 1 | 14 | .222 | .222 | .333 |
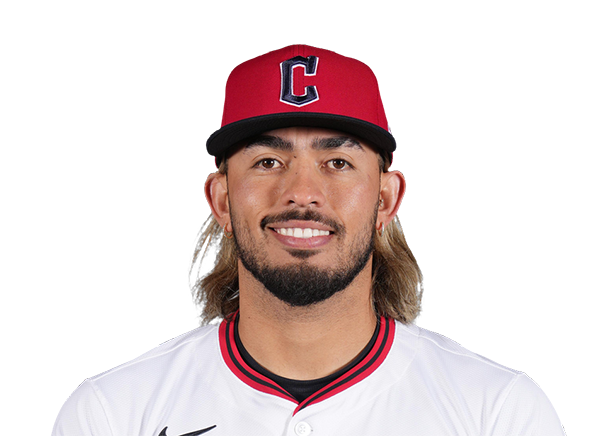 Gabriel Arias | 0-3 | 3 | 0 | 0 | 0 | 0 | 0 | 2 | 14 | .100 | .100 | .100 |
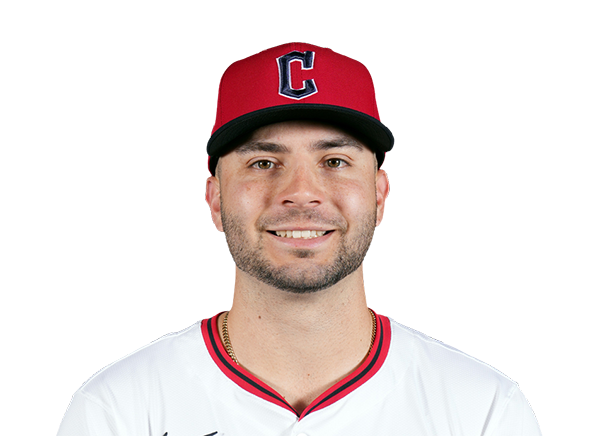 CJ Kayfus | 0-2 | 2 | 0 | 0 | 0 | 0 | 0 | 2 | 17 | .000 | .273 | .000 |
 Brayan Rocchio | 0-3 | 3 | 0 | 0 | 0 | 0 | 0 | 0 | 13 | .200 | .429 | .300 |
Seattle Mariners
| Player | H-AB | AB | R | H | RBI | HR | BB | K | #P | AVG | OBP | SLG |
|---|---|---|---|---|---|---|---|---|---|---|---|---|
 Brendan Donovan | 2-3 | 3 | 2 | 2 | 3 | 1 | 0 | 1 | 21 | .429 | .556 | .929 |
 Cal Raleigh | 1-4 | 4 | 0 | 1 | 1 | 0 | 1 | 1 | 25 | .133 | .278 | .200 |
 Julio Rodriguez | 0-4 | 4 | 2 | 0 | 0 | 0 | 1 | 0 | 18 | .067 | .222 | .067 |
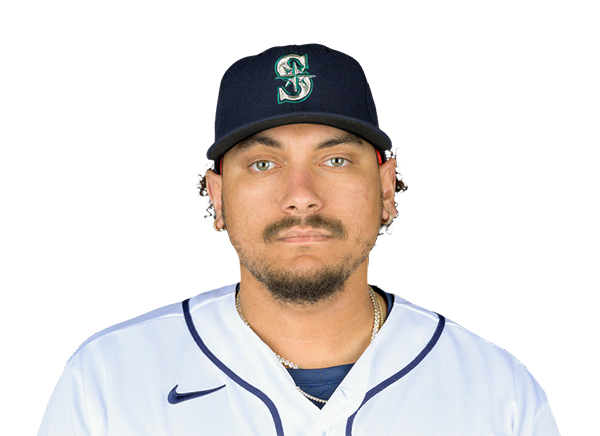 Josh Naylor | 0-4 | 4 | 0 | 0 | 0 | 0 | 1 | 1 | 13 | .000 | .167 | .000 |
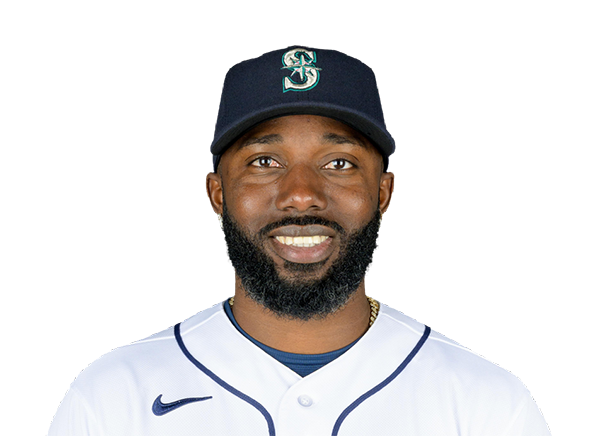 Randy Arozarena | 2-4 | 4 | 1 | 2 | 2 | 0 | 1 | 0 | 18 | .308 | .500 | .462 |
 Luke Raley | 1-5 | 5 | 0 | 1 | 1 | 0 | 0 | 3 | 23 | .286 | .333 | .929 |
 Dominic Canzone | 1-3 | 3 | 1 | 1 | 0 | 0 | 0 | 0 | 16 | .300 | .417 | 1.000 |
 Cole Young | 1-3 | 3 | 1 | 1 | 0 | 0 | 1 | 0 | 14 | .214 | .267 | .500 |
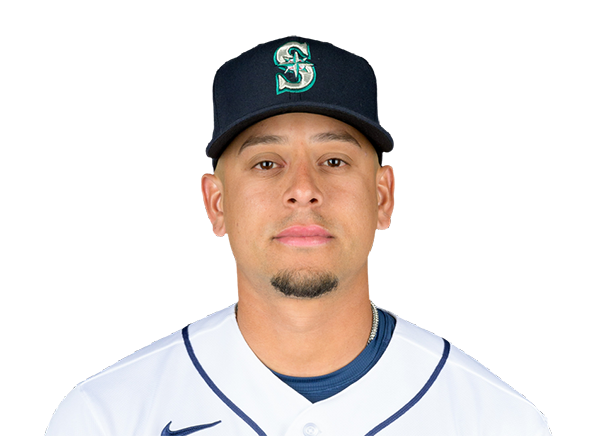 Leo Rivas | 1-4 | 4 | 1 | 1 | 1 | 0 | 0 | 2 | 18 | .154 | .267 | .308 |
Cleveland Guardians
| Player | IP | H | R | ER | BB | K | HR | PC-ST | ERA | PC |
|---|---|---|---|---|---|---|---|---|---|---|
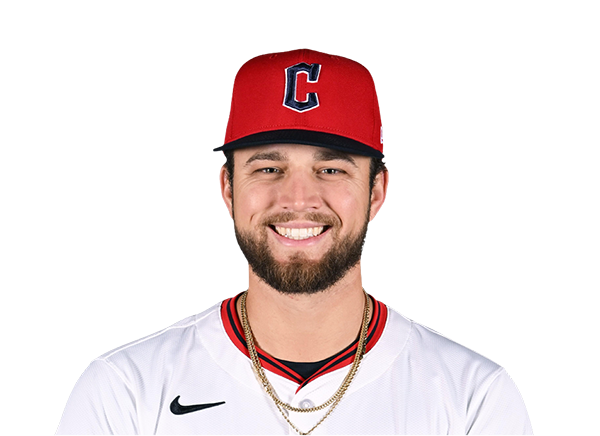 Slade Cecconi | 4.1 | 6 | 6 | 6 | 3 | 5 | 1 | 93-56 | 12.46 | 93 |
 Peyton Pallette | 1.2 | 2 | 1 | 1 | 1 | 1 | 0 | 38-21 | 2.45 | 38 |
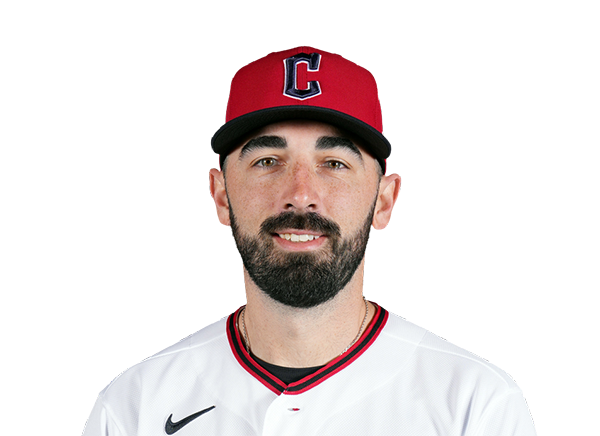 Colin Holderman | 2.0 | 1 | 1 | 0 | 1 | 2 | 0 | 35-22 | 6.00 | 35 |
Seattle Mariners
| Player | IP | H | R | ER | BB | K | HR | PC-ST | ERA | PC |
|---|---|---|---|---|---|---|---|---|---|---|
 Emerson Hancock | 6.0 | 0 | 0 | 0 | 1 | 9 | 0 | 97-62 | 0.00 | 97 |
 Cooper Criswell | 3.0 | 2 | 0 | 0 | 0 | 5 | 0 | 44-33 | 2.25 | 44 |
H2H / Season Series
CLE6–5
SEA
CLE4–3
SEA
CLE1–3
SEA
SEA8–0
CLE
SEA5–6
CLE
SEA5–1
CLE
SEA4–6
CLE
CLE8–20
SEA
SEA8–7
CLE
Last 5 Games
| Date | Opponent | Result |
|---|---|---|
| Aug 22 |  @ COL | W4–3 |
| Aug 21 | @ COL | W9–1 |
| Aug 20 |  vs SF | W5–2 |
| Aug 19 | vs SF | L0–1 |
| Aug 18 | vs SF | W8–1 |
| Date | Opponent | Result |
|---|---|---|
| Aug 22 |  vs CHC | W5–4 |
| Aug 21 | vs CHC | W6–5 |
| Aug 20 |  @ MIL | L4–7 |
| Aug 19 | @ MIL | W7–5 |
| Aug 18 | @ MIL | L0–22 |
Standings
American League
| Team | W | L | PCT | GB | DIFF | STRK |
|---|---|---|---|---|---|---|
1 Rays | 76 | 53 | .589 | - | +42 | L3 |
2 White Sox | 67 | 62 | .519 | 9 | +42 | L1 |
3 Astros | 65 | 65 | .500 | 11.5 | -43 | L1 |
4 Yankees | 73 | 56 | .566 | 3 | +95 | L1 |
5 Red Sox | 70 | 59 | .543 | 6 | +98 | W2 |
6 Rangers | 64 | 66 | .492 | 12.5 | -48 | L1 |
| 7Guardians | 64 | 66 | .492 | 12.5 | -14 | W3 |
8 Blue Jays | 64 | 67 | .489 | 13 | -50 | W1 |
9 Twins | 63 | 67 | .485 | 13.5 | -47 | L2 |
10 Orioles | 63 | 67 | .485 | 13.5 | -33 | W2 |
| 11Mariners | 62 | 68 | .477 | 14.5 | -44 | W2 |
12 Tigers | 61 | 68 | .473 | 15 | +77 | L4 |
13 Royals | 57 | 74 | .435 | 20 | -95 | W7 |
14 Angels | 52 | 78 | .400 | 24.5 | -68 | W1 |
15 Athletics | 50 | 80 | .385 | 26.5 | -188 | W1 |
National League
| Team | W | L | PCT | GB | DIFF | STRK |
|---|---|---|---|---|---|---|
| 1Brewers | 81 | 49 | .623 | - | +163 | W3 |
2 Dodgers | 79 | 51 | .608 | 2 | +147 | W5 |
3 Braves | 75 | 55 | .577 | 6 | +108 | L2 |
| 4Cubs | 74 | 56 | .569 | 7 | +98 | L3 |
5 Phillies | 72 | 58 | .554 | 9 | +25 | W8 |
6 Padres | 70 | 60 | .538 | 11 | +9 | W2 |
7 Diamondbacks | 68 | 62 | .523 | 13 | +7 | L1 |
8 Marlins | 66 | 64 | .508 | 15 | +17 | W2 |
9 Cardinals | 66 | 65 | .504 | 15.5 | 0 | L2 |
10 Pirates | 63 | 68 | .481 | 18.5 | +29 | L2 |
11 Reds | 62 | 68 | .477 | 19 | -92 | W1 |
12 Nationals | 61 | 70 | .466 | 20.5 | +14 | L3 |
13 Mets | 59 | 71 | .454 | 22 | -39 | W1 |
| 14Giants | 52 | 77 | .403 | 28.5 | -79 | L3 |
| 15Rockies | 50 | 79 | .388 | 30.5 | -131 | L5 |
CLE
VS
SEA
Pitchers
Slade Cecconi
Peyton Pallette
Colin Holderman
Catchers
Bo Naylor
Infielders
Kyle Manzardo
Daniel Schneemann
Gabriel Arias
Brayan Rocchio
Outfielders
Steven Kwan
Angel Martinez
Chase DeLauter
David Fry
CJ Kayfus
Designated Hitters
Jose Ramirez
Pitchers
Emerson Hancock
Cooper Criswell
Catchers
Cal Raleigh
Infielders
Brendan Donovan
Josh Naylor
Cole Young
Leo Rivas
Outfielders
Julio Rodriguez
Randy Arozarena
Luke Raley
Designated Hitters
Dominic Canzone
Guardians
VS
Mariners
Batting
130
Team Games Played
130
4323
At Bats
4305
1012
Hits
988
497
Runs Batted In
494
123
Home Runs
148
124
Stolen Bases
89
.234
Batting Average
.230
520
Runs
511
194
Doubles
158
11
Triples
13
1597
Total Bases
1616
472
Walks
434
1055
Strikeouts
1120
.313
On Base Percentage
.309
.369
Slugging Percentage
.375
.683
OBP Pct + SLG Pct
.685
130
Games Played
130
130
Games Started
130
42
Hit By Pitch
78
0.0
Wins Above Replacement
0.0
0.0
Offensive Wins Above Replacement
0.0
25
Caught Stealing
34
1
Is Qualified
1
529.3
Runs Created
510.4
4.1
Runs Created Per 27 Outs
4.0
.096
Walks Per Plate Appearance
.089
0.45
Walk To Strikeout Ratio
0.39
.135
Isolated Power
.146
.267
Secondary Average
.259
3.95
Pitches Per Plate Appearance
3.90
328
Extra Base Hits
319
4895
Plate Appearances
4859
35.1
At Bats Per Home Run
29.1
23
Sacrifice Hit
10
33
Sacrifice Flies
31
Pitching
130
Team Games Played
130
46
Quality Starts
57
64
Wins
62
66
Losses
68
37
Saves
29
98
Holds
69
1027
Hits
1079
481
Earned runs
511
149
Home Runs
149
429
Walks
331
1214
Strikeouts
1107
9.5
Strikeouts Per 9 Innings
8.7
147.6
Pitches Per Start
142.0
1.26
Walks Plus Hits Per Inning Pitched
1.23
3.76
Earned Run Average
4.01
66
Losses
68
1151.2
Innings pitched
1148.0
.492
Win Percentage
.477
51
Save Opportunities
50
.237
Opponent Batting Average
.248
.310
Opponent's On-base pct.
.307
.392
Opponent's Slugging pct.
.404
.703
Opponent's OPB Pct + SLG Pct
.711
4337
At Bats
4356
197
Doubles
210
15
Triples
12
50
Batters Hit
56
89
Stolen Bases
94
130
Games Played
130
0
Complete Games
1
4
Shutouts
9
50
Wild Pitches
27
509
Runs Batted In
523
2
Balks
4
1151.2
Innings pitched
1148.0
9.5
Strikeouts Per 9 Innings
8.7
18
Caught Stealing
28
130
Games Started
130
0.0
Wins Above Replacement
0.0
1
Is Qualified
1
534
Runs
555
481
Earned Runs
511
1701
Total Bases
1760
Fielding
130
Team Games Played
130
1152
Full Innings
1148
4532
Total Chances
4570
3455
Putouts
3444
1009
Assists
1058
68
Errors
68
194
Double Plays
158
0.985
Fielding Percentage
0.985
34.9
Range Factor
35.3
0.0
Zone Rating
0.0
130
Games Played
130
0
Games Started
0
0.0
Defensive Wins Above Replacement
0.0
1
Qualified
1