

Guardians vs Orioles Live Score (7 Sep, 2026)
Game Information
Stage
STD
Season
2026
First Pitch
Mon, Sep 7, 1:35 pm
Venue
Oriole Park at Camden Yards
Location
Baltimore, Maryland
Venue Type
Outdoor
Broadcast
MLB.TV
Attendance
21,612
Live Situation
3Balls
2Strikes
0Outs
—Pitcher
—At Bat
Pitch Sequence
1
BALL
Four-seam FB
90 MPH
2
BALL
Four-seam FB
91 MPH
3
STRIKE LOOKING
Four-seam FB
90 MPH
4
STRIKE SWINGING
Four-seam FB
92 MPH
5
BALL
Four-seam FB
92 MPH
6
STRIKE FOUL
Four-seam FB
92 MPH
7
BALL IN PLAY
Four-seam FB
92 MPH
Injury Report


Team Stats
 CLE
BAL


4
Runs
6
9
Hits
9
0
Errors
0
1
Home Runs
2
0
Walks
7
6
Strikeouts
11
Player Box Score
Cleveland Guardians
| Player | H-AB | AB | R | H | RBI | HR | BB | K | #P | AVG | OBP | SLG |
|---|---|---|---|---|---|---|---|---|---|---|---|---|
 Steven Kwan | 2-4 | 4 | 0 | 2 | 0 | 0 | 0 | 0 | 15 | .274 | .373 | .335 |
 Jo Adell | 2-4 | 4 | 1 | 2 | 1 | 0 | 0 | 1 | 23 | .239 | .294 | .399 |
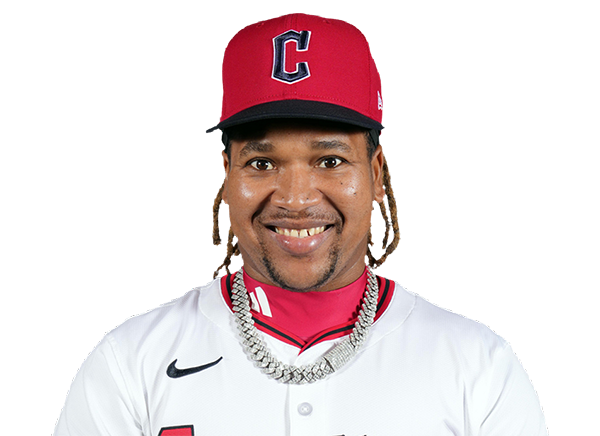 Jose Ramirez | 1-4 | 4 | 1 | 1 | 0 | 0 | 0 | 0 | 12 | .237 | .329 | .377 |
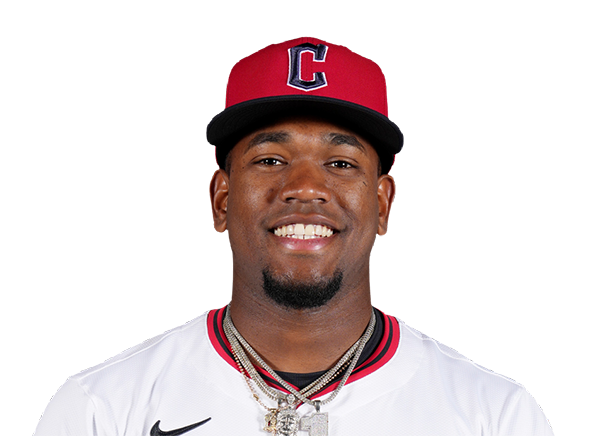 Angel Martinez | 1-4 | 4 | 0 | 1 | 0 | 0 | 0 | 2 | 14 | .243 | .282 | .426 |
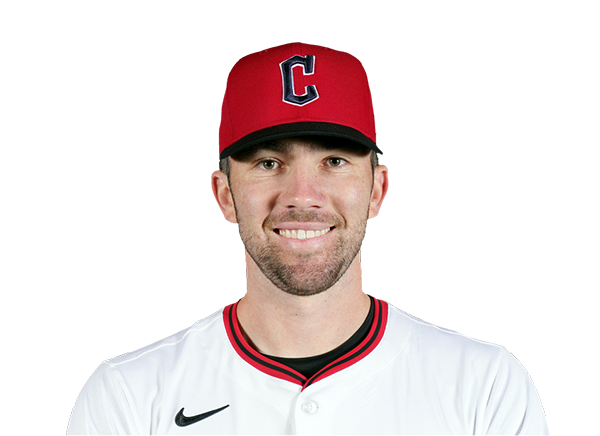 David Fry | 0-3 | 3 | 0 | 0 | 0 | 0 | 0 | 0 | 8 | .191 | .310 | .338 |
 Nathaniel Lowe | 1-1 | 1 | 1 | 1 | 3 | 1 | 0 | 0 | 5 | .256 | .323 | .459 |
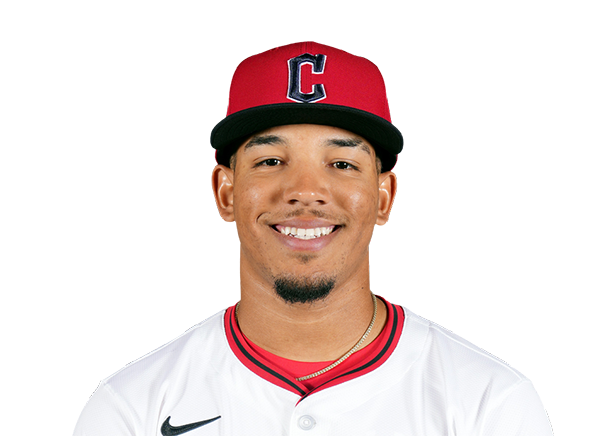 Angel Genao | 0-4 | 4 | 0 | 0 | 0 | 0 | 0 | 2 | 11 | .235 | .291 | .333 |
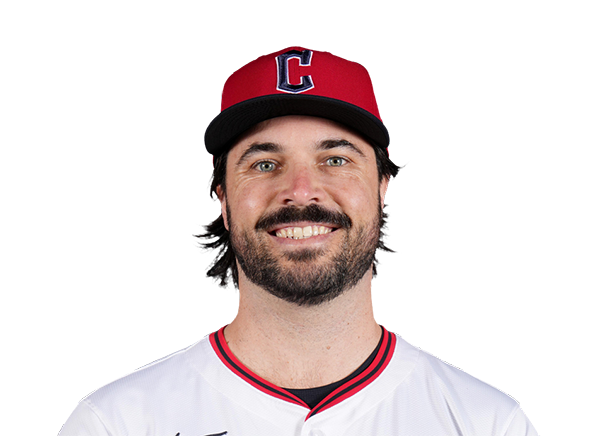 Austin Hedges | 1-3 | 3 | 0 | 1 | 0 | 0 | 0 | 0 | 10 | .253 | .323 | .366 |
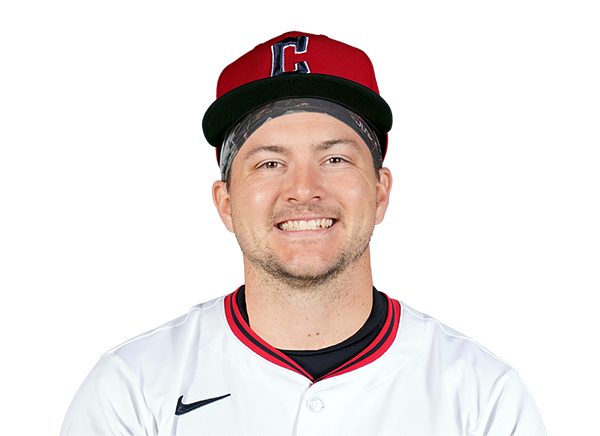 Patrick Bailey | 0-1 | 1 | 0 | 0 | 0 | 0 | 0 | 0 | 7 | .203 | .270 | .325 |
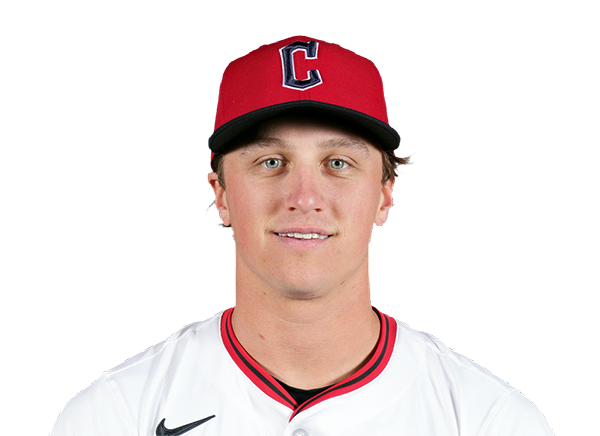 Petey Halpin | 0-3 | 3 | 0 | 0 | 0 | 0 | 0 | 1 | 18 | .208 | .245 | .305 |
 Brayan Rocchio | 1-3 | 3 | 1 | 1 | 0 | 0 | 0 | 0 | 11 | .247 | .306 | .378 |
Baltimore Orioles
| Player | H-AB | AB | R | H | RBI | HR | BB | K | #P | AVG | OBP | SLG |
|---|---|---|---|---|---|---|---|---|---|---|---|---|
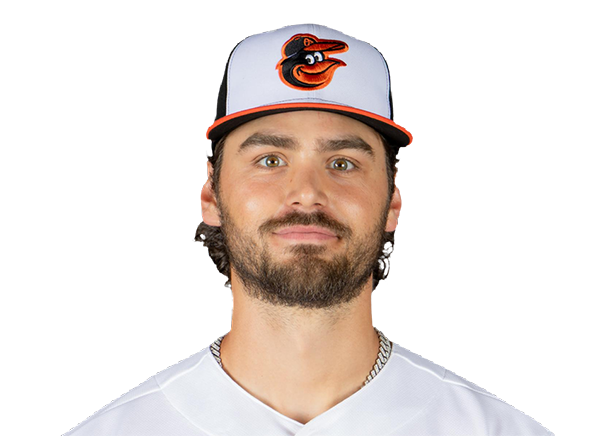 Blaze Alexander | 0-3 | 3 | 0 | 0 | 1 | 0 | 2 | 2 | 37 | .302 | .358 | .411 |
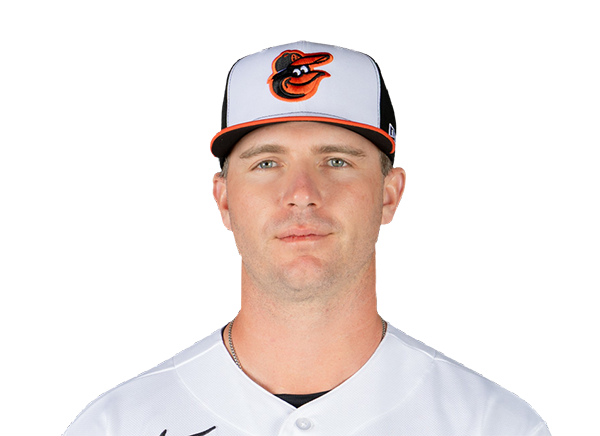 Pete Alonso | 0-2 | 2 | 0 | 0 | 1 | 0 | 2 | 0 | 21 | .266 | .360 | .494 |
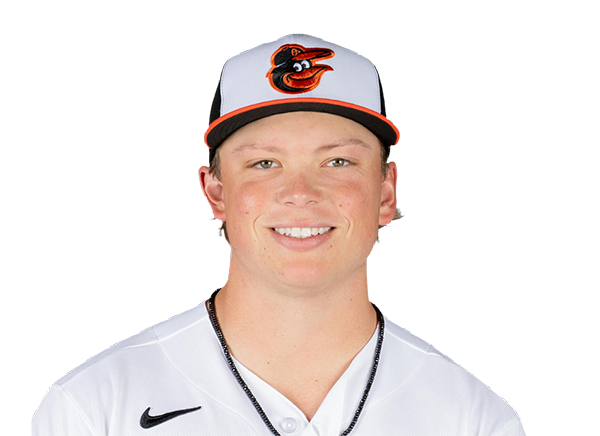 Jackson Holliday | 1-5 | 5 | 1 | 1 | 0 | 0 | 0 | 1 | 16 | .232 | .309 | .349 |
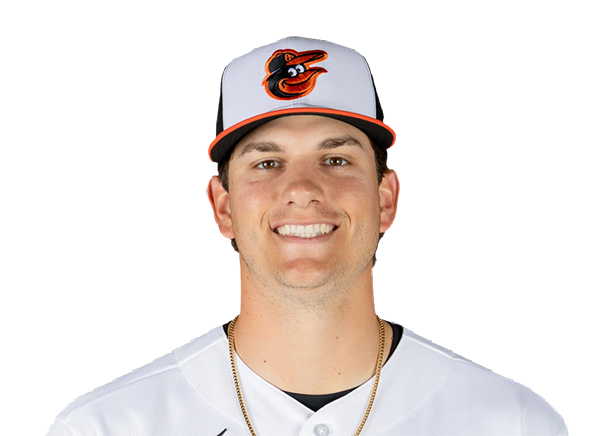 Coby Mayo | 2-5 | 5 | 2 | 2 | 3 | 2 | 0 | 2 | 22 | .224 | .288 | .460 |
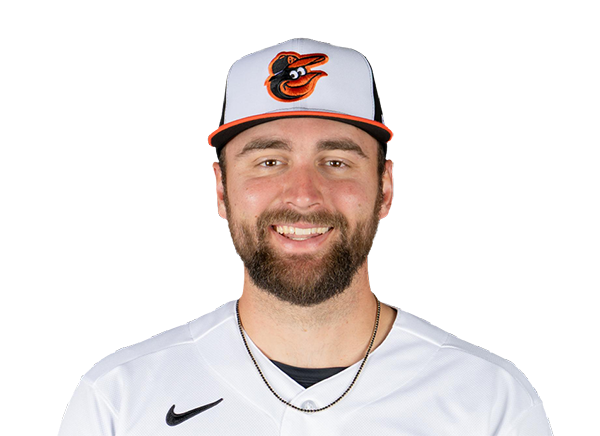 Colton Cowser | 0-0 | 0 | 0 | 0 | 0 | 0 | 0 | 0 | 0 | .215 | .306 | .368 |
 Gunnar Henderson | 1-5 | 5 | 0 | 1 | 0 | 0 | 0 | 1 | 17 | .220 | .303 | .397 |
 Christian Encarnacion-Strand | 0-4 | 4 | 1 | 0 | 0 | 0 | 1 | 1 | 13 | .260 | .306 | .486 |
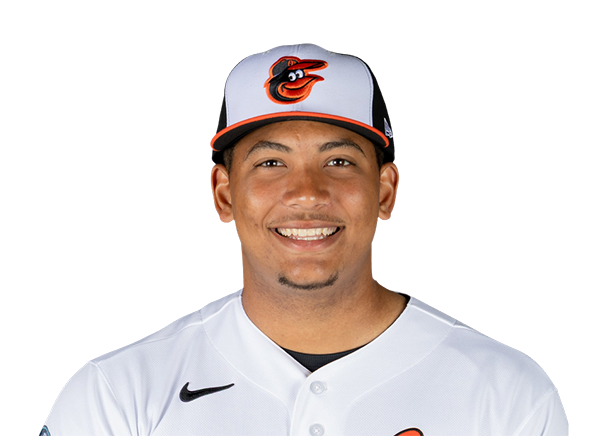 Samuel Basallo | 2-3 | 3 | 2 | 2 | 0 | 0 | 0 | 1 | 16 | .230 | .300 | .420 |
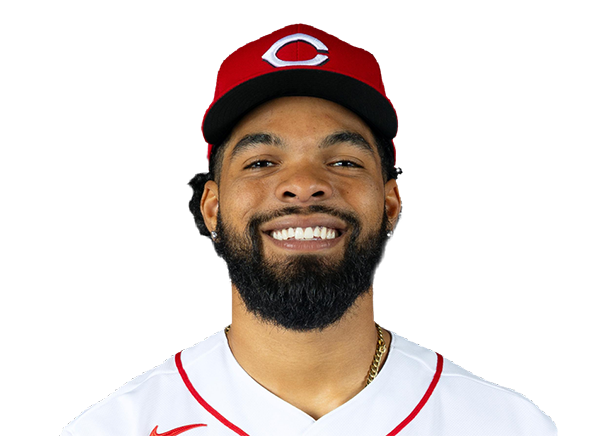 Rece Hinds | 2-2 | 2 | 0 | 2 | 0 | 0 | 2 | 0 | 18 | .175 | .244 | .275 |
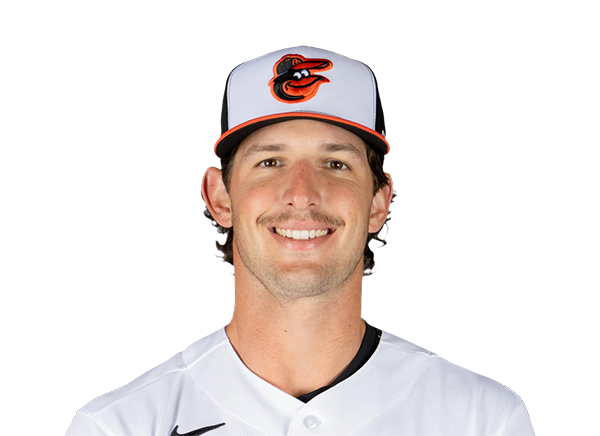 Dylan Beavers | 1-4 | 4 | 0 | 1 | 1 | 0 | 0 | 3 | 20 | .244 | .323 | .382 |
Cleveland Guardians
| Player | IP | H | R | ER | BB | K | HR | PC-ST | ERA | PC |
|---|---|---|---|---|---|---|---|---|---|---|
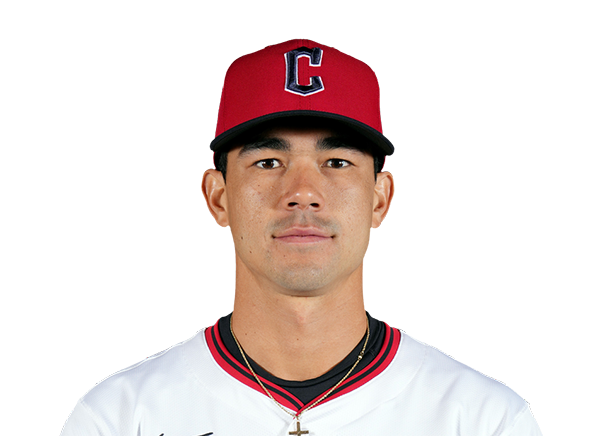 Joey Cantillo | 2.1 | 3 | 4 | 4 | 5 | 3 | 1 | 72-35 | 4.00 | 72 |
 Franco Aleman | 0.2 | 0 | 0 | 0 | 2 | 2 | 0 | 30-18 | 3.26 | 30 |
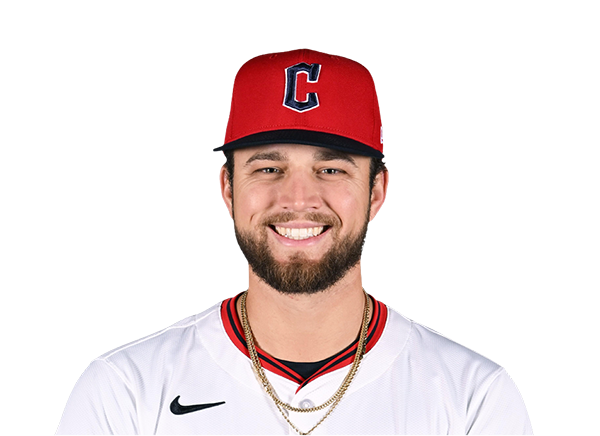 Slade Cecconi | 3.0 | 3 | 2 | 2 | 0 | 3 | 1 | 44-33 | 5.06 | 44 |
 Daniel Espino | 1.0 | 2 | 0 | 0 | 0 | 2 | 0 | 22-16 | 3.00 | 22 |
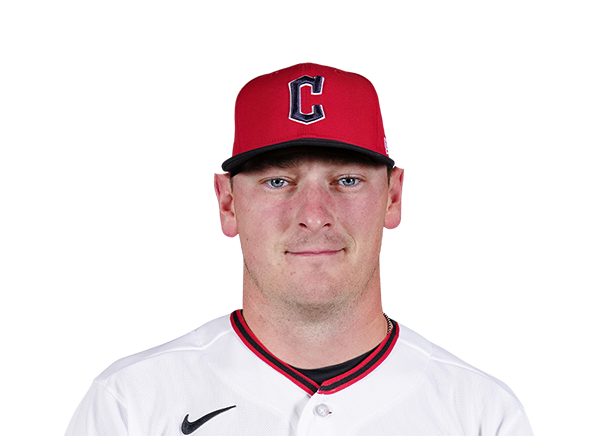 Craig Yoho | 1.0 | 1 | 0 | 0 | 0 | 1 | 0 | 12-9 | 4.15 | 12 |
Baltimore Orioles
| Player | IP | H | R | ER | BB | K | HR | PC-ST | ERA | PC |
|---|---|---|---|---|---|---|---|---|---|---|
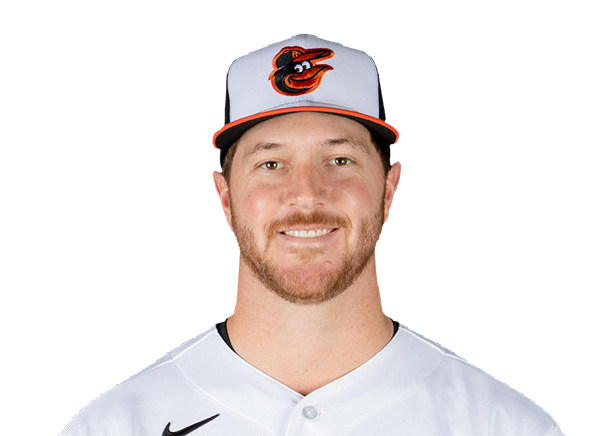 Trevor Rogers | 7.1 | 6 | 1 | 1 | 0 | 6 | 0 | 104-78 | 4.15 | 104 |
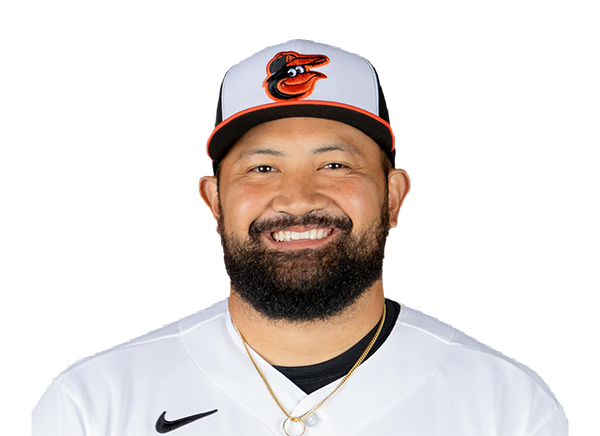 Rico Garcia | 0.2 | 0 | 0 | 0 | 0 | 0 | 0 | 6-5 | 3.12 | 6 |
 Andrew Kittredge | 0.2 | 3 | 3 | 3 | 0 | 0 | 1 | 17-11 | 3.83 | 17 |
 Josh Walker | 0.1 | 0 | 0 | 0 | 0 | 0 | 0 | 7-4 | 2.01 | 7 |
H2H / Season Series
BAL6–4
CLE
CLE8–4
BAL
CLE4–2
BAL
CLE4–6
BAL
CLE4–2
BAL
Last 5 Games
| Date | Opponent | Result |
|---|---|---|
| Sep 7 | @ BAL | L4–6 |
| Sep 6 |  vs DET | W3–2 |
| Sep 5 | vs DET | L0–6 |
| Sep 4 | vs DET | W4–3 |
| Sep 4 | vs DET | W7–6 |
| Date | Opponent | Result |
|---|---|---|
| Sep 7 | vs CLE | W6–4 |
| Sep 6 |  vs BOS | L1–3 |
| Sep 5 | vs BOS | L0–5 |
| Sep 4 | vs BOS | L0–1 |
| Sep 3 | vs BOS | L5–6 |
Standings
American League
| Team | W | L | PCT | GB | DIFF | STRK |
|---|---|---|---|---|---|---|
1 Rays | 85 | 58 | .594 | - | +47 | L1 |
2 White Sox | 75 | 68 | .524 | 10 | +49 | W1 |
3 Astros | 73 | 71 | .507 | 12.5 | -38 | L2 |
4 Yankees | 81 | 62 | .566 | 4 | +117 | L1 |
| 5Red Sox | 80 | 65 | .552 | 6 | +89 | W5 |
| 6Guardians | 73 | 72 | .503 | 13 | -16 | L1 |
7 Blue Jays | 72 | 72 | .500 | 13.5 | -38 | L1 |
8 Rangers | 71 | 73 | .493 | 14.5 | -44 | W1 |
| 9Orioles | 70 | 75 | .483 | 16 | -27 | W1 |
10 Twins | 68 | 76 | .472 | 17.5 | -49 | L2 |
11 Mariners | 67 | 77 | .465 | 18.5 | -71 | W1 |
| 12Tigers | 66 | 78 | .458 | 19.5 | +51 | W1 |
13 Royals | 64 | 81 | .441 | 22 | -89 | L1 |
14 Athletics | 57 | 87 | .396 | 28.5 | -188 | L1 |
15 Angels | 54 | 90 | .375 | 31.5 | -80 | L2 |
National League
| Team | W | L | PCT | GB | DIFF | STRK |
|---|---|---|---|---|---|---|
1 Brewers | 89 | 56 | .614 | - | +169 | W1 |
2 Dodgers | 87 | 57 | .604 | 1.5 | +155 | W5 |
3 Braves | 85 | 59 | .590 | 3.5 | +119 | L1 |
4 Phillies | 81 | 63 | .563 | 7.5 | +35 | W1 |
5 Cubs | 81 | 64 | .559 | 8 | +131 | L2 |
6 Diamondbacks | 77 | 68 | .531 | 12 | 0 | W3 |
7 Padres | 76 | 68 | .528 | 12.5 | +9 | W2 |
8 Marlins | 72 | 73 | .497 | 17 | +10 | L1 |
9 Cardinals | 72 | 73 | .497 | 17 | -10 | L1 |
10 Pirates | 71 | 73 | .493 | 17.5 | +26 | W1 |
11 Reds | 69 | 75 | .479 | 19.5 | -108 | L1 |
12 Nationals | 67 | 79 | .459 | 22.5 | +8 | L5 |
13 Mets | 66 | 78 | .458 | 22.5 | -43 | W2 |
14 Giants | 60 | 85 | .414 | 29 | -74 | W1 |
15 Rockies | 55 | 88 | .385 | 33 | -140 | L1 |
CLE
VS
BAL
Pitchers
Joey Cantillo
Catchers
Austin Hedges
Infielders
Jose Ramirez
David Fry
Angel Genao
Brayan Rocchio
Outfielders
Steven Kwan
Angel Martinez
Petey Halpin
Designated Hitters
Jo Adell
Pitchers
Trevor Rogers
Catchers
Samuel Basallo
Infielders
Pete Alonso
Jackson Holliday
Coby Mayo
Gunnar Henderson
Outfielders
Blaze Alexander
Rece Hinds
Dylan Beavers
Designated Hitters
Christian Encarnacion-Strand
Guardians
VS
Orioles
Batting
145
Team Games Played
145
4827
At Bats
4827
1139
Hits
1130
561
Runs Batted In
624
135
Home Runs
174
132
Stolen Bases
72
.236
Batting Average
.234
584
Runs
647
221
Doubles
212
13
Triples
19
1791
Total Bases
1902
511
Walks
538
1161
Strikeouts
1343
.313
On Base Percentage
.316
.371
Slugging Percentage
.394
.684
OBP Pct + SLG Pct
.710
145
Games Played
145
145
Games Started
145
50
Hit By Pitch
56
0.0
Wins Above Replacement
0.0
0.0
Offensive Wins Above Replacement
0.0
28
Caught Stealing
32
1
Is Qualified
1
588.3
Runs Created
609.3
4.1
Runs Created Per 27 Outs
4.2
.094
Walks Per Plate Appearance
.098
0.44
Walk To Strikeout Ratio
0.40
.135
Isolated Power
.160
.262
Secondary Average
.280
3.95
Pitches Per Plate Appearance
3.98
369
Extra Base Hits
405
5455
Plate Appearances
5474
35.8
At Bats Per Home Run
27.7
25
Sacrifice Hit
17
40
Sacrifice Flies
34
Pitching
145
Team Games Played
145
54
Quality Starts
57
73
Wins
70
72
Losses
75
40
Saves
40
101
Holds
78
1151
Hits
1251
539
Earned runs
593
161
Home Runs
154
480
Walks
478
1366
Strikeouts
1168
9.5
Strikeouts Per 9 Innings
8.1
148.4
Pitches Per Start
145.9
1.27
Walks Plus Hits Per Inning Pitched
1.34
3.76
Earned Run Average
4.13
72
Losses
75
1288.2
Innings pitched
1292.1
.503
Win Percentage
.483
54
Save Opportunities
61
.237
Opponent Batting Average
.253
.311
Opponent's On-base pct.
.321
.389
Opponent's Slugging pct.
.406
.700
Opponent's OPB Pct + SLG Pct
.727
4854
At Bats
4949
224
Doubles
246
15
Triples
25
60
Batters Hit
44
95
Stolen Bases
77
145
Games Played
145
0
Complete Games
1
4
Shutouts
2
53
Wild Pitches
42
569
Runs Batted In
646
2
Balks
2
1288.2
Innings pitched
1292.1
9.5
Strikeouts Per 9 Innings
8.1
20
Caught Stealing
34
145
Games Started
145
0.0
Wins Above Replacement
0.0
1
Is Qualified
1
600
Runs
674
539
Earned Runs
593
1888
Total Bases
2009
Fielding
145
Team Games Played
145
1289
Full Innings
1292
5071
Total Chances
5196
3866
Putouts
3877
1129
Assists
1232
76
Errors
87
221
Double Plays
212
0.985
Fielding Percentage
0.983
34.9
Range Factor
35.6
0.0
Zone Rating
0.0
145
Games Played
145
0
Games Started
0
0.0
Defensive Wins Above Replacement
0.0
1
Qualified
1