

Guardians vs Rays Live Score (24 Jul, 2026)
Game Information
Stage
Standard
Season
2026
First Pitch
Fri, Jul 24, 7:10 pm
Venue
Tropicana Field
Location
St. Petersburg, Florida
Attendance
19,099
Live Situation
0Balls
2Strikes
0Outs
—Pitcher
—At Bat
Pitch Sequence
1
STRIKE FOUL
Four-seam FB
93 MPH
2
STRIKE FOUL
Cutter
89 MPH
3
BALL IN PLAY
Sinker
96 MPH
Injury Report
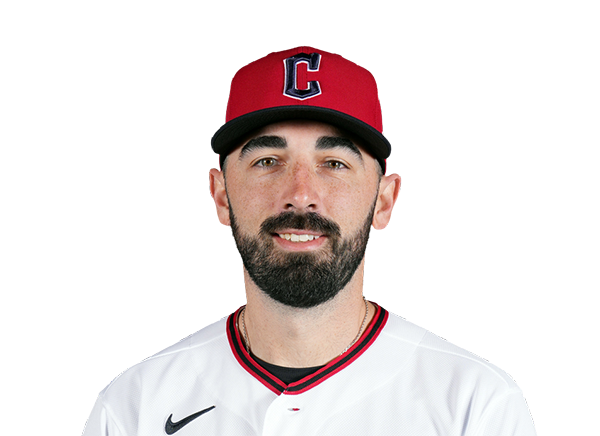
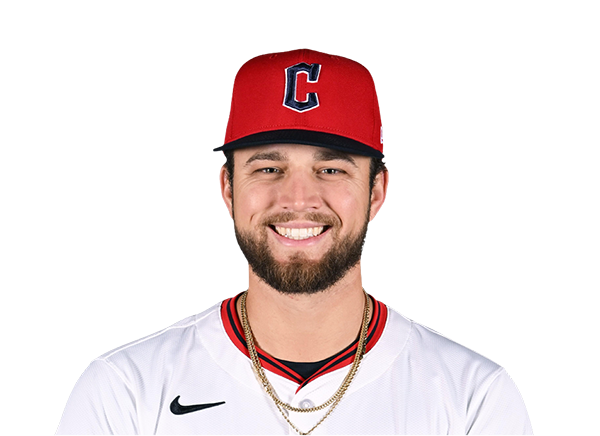
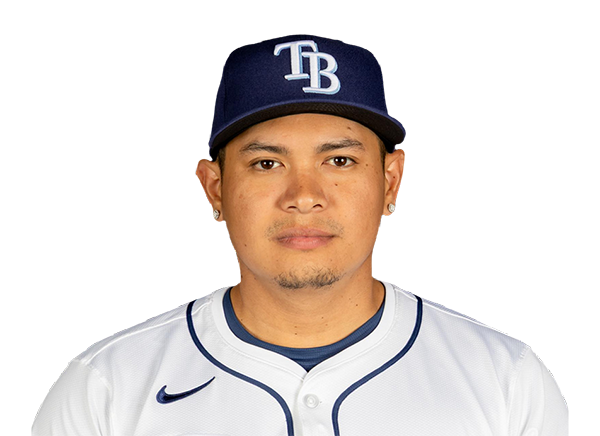

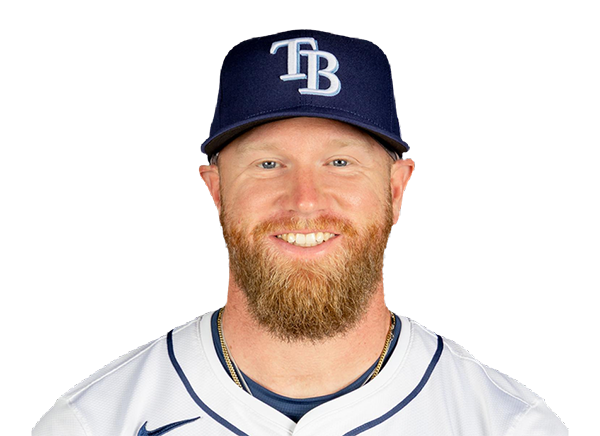
Team Stats
 CLE
TB


3
Runs
11
7
Hits
15
1
Errors
0
1
Home Runs
2
2
Walks
4
7
Strikeouts
10
Player Box Score
Cleveland Guardians
| Player | H-AB | AB | R | H | RBI | HR | BB | K | #P | AVG | OBP | SLG |
|---|---|---|---|---|---|---|---|---|---|---|---|---|
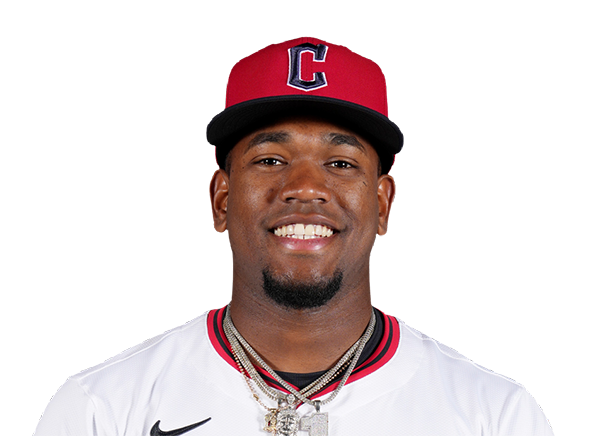 Angel Martinez | 0-4 | 4 | 0 | 0 | 0 | 0 | 0 | 0 | 11 | .235 | .272 | .435 |
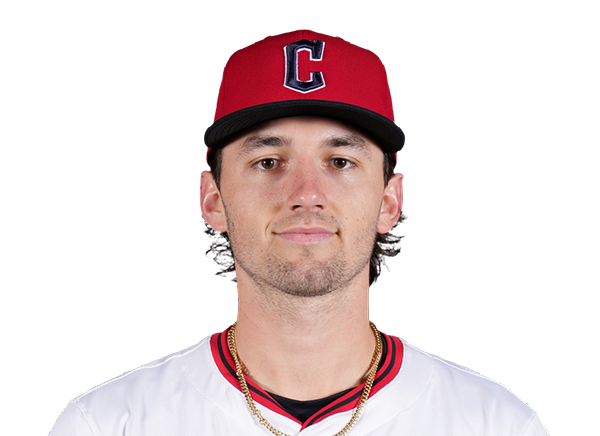 Chase DeLauter | 1-3 | 3 | 1 | 1 | 0 | 0 | 1 | 0 | 16 | .284 | .351 | .450 |
 Rhys Hoskins | 0-4 | 4 | 0 | 0 | 0 | 0 | 0 | 3 | 18 | .174 | .305 | .370 |
 Brayan Rocchio | 2-4 | 4 | 0 | 2 | 1 | 0 | 0 | 0 | 16 | .274 | .335 | .407 |
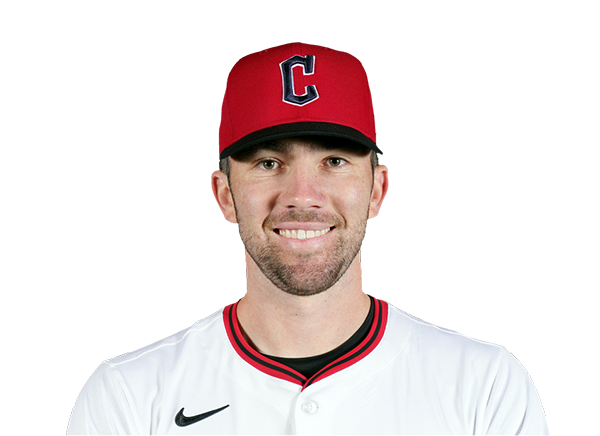 David Fry | 0-4 | 4 | 0 | 0 | 0 | 0 | 0 | 1 | 16 | .186 | .296 | .343 |
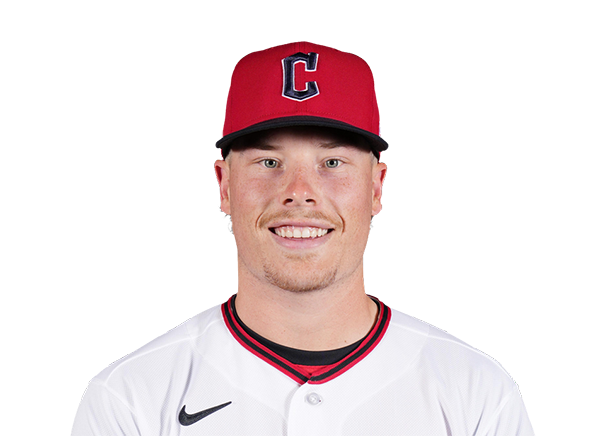 Travis Bazzana | 0-4 | 4 | 0 | 0 | 0 | 0 | 0 | 0 | 8 | .238 | .336 | .403 |
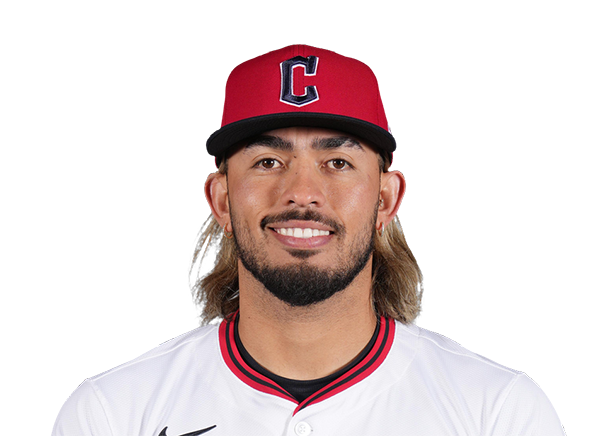 Gabriel Arias | 2-4 | 4 | 1 | 2 | 0 | 0 | 0 | 2 | 12 | .250 | .289 | .407 |
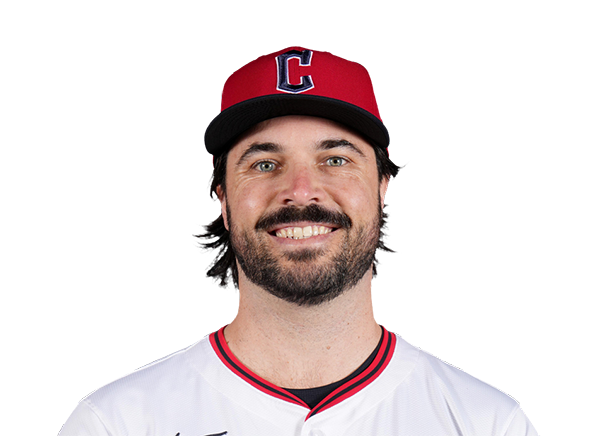 Austin Hedges | 2-3 | 3 | 1 | 2 | 2 | 1 | 1 | 0 | 15 | .289 | .351 | .430 |
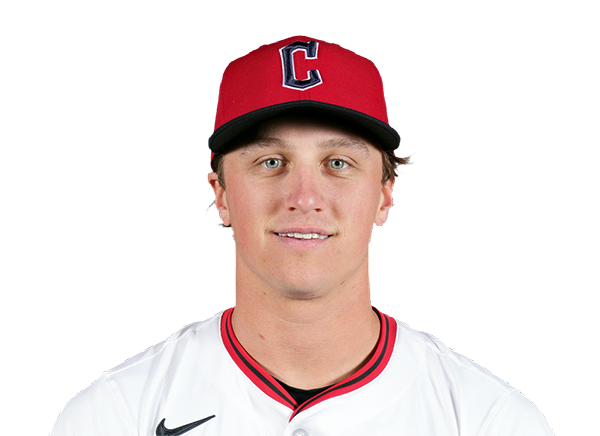 Petey Halpin | 0-4 | 4 | 0 | 0 | 0 | 0 | 0 | 1 | 12 | .198 | .213 | .326 |
Tampa Bay Rays
| Player | H-AB | AB | R | H | RBI | HR | BB | K | #P | AVG | OBP | SLG |
|---|---|---|---|---|---|---|---|---|---|---|---|---|
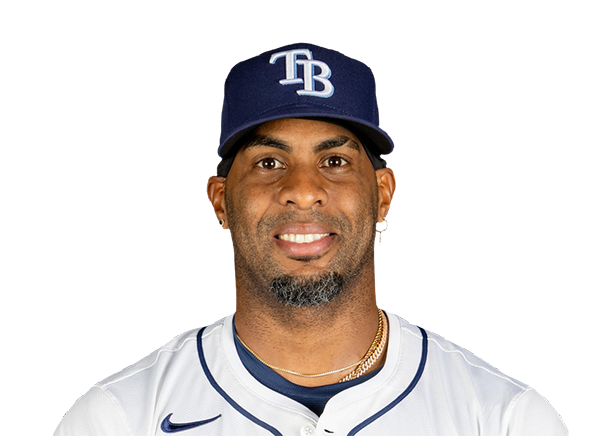 Yandy Diaz | 0-4 | 4 | 0 | 0 | 0 | 0 | 1 | 2 | 17 | .304 | .380 | .462 |
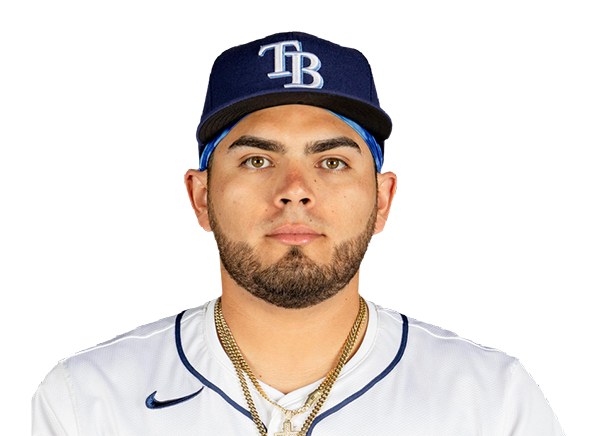 Jonathan Aranda | 1-4 | 4 | 1 | 1 | 0 | 0 | 1 | 2 | 21 | .283 | .378 | .440 |
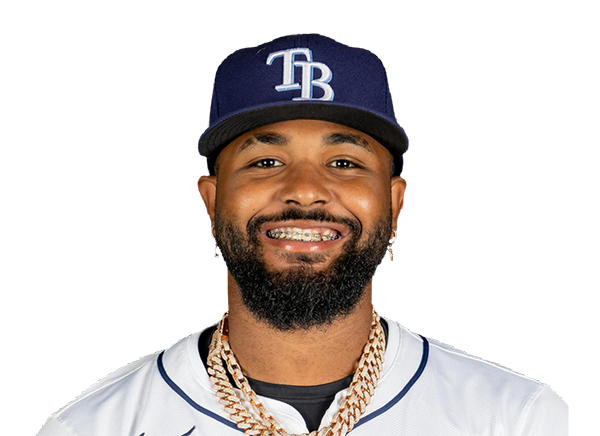 Junior Caminero | 1-5 | 5 | 0 | 1 | 1 | 0 | 0 | 0 | 23 | .286 | .376 | .548 |
 Cedric Mullins | 2-5 | 5 | 2 | 2 | 0 | 0 | 0 | 1 | 19 | .204 | .284 | .355 |
 Jonny DeLuca | 2-4 | 4 | 3 | 2 | 1 | 0 | 1 | 2 | 26 | .267 | .303 | .440 |
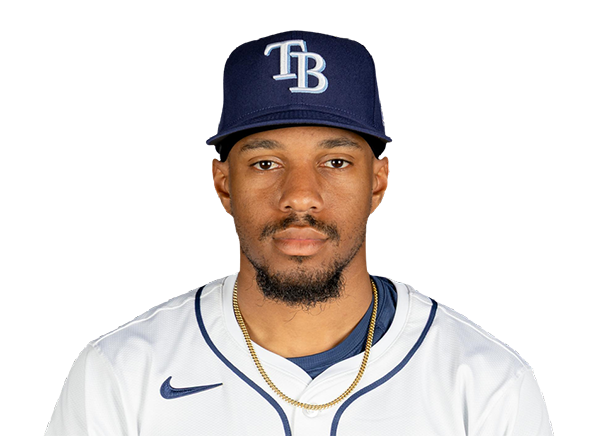 Chandler Simpson | 2-4 | 4 | 1 | 2 | 1 | 0 | 0 | 0 | 11 | .291 | .325 | .355 |
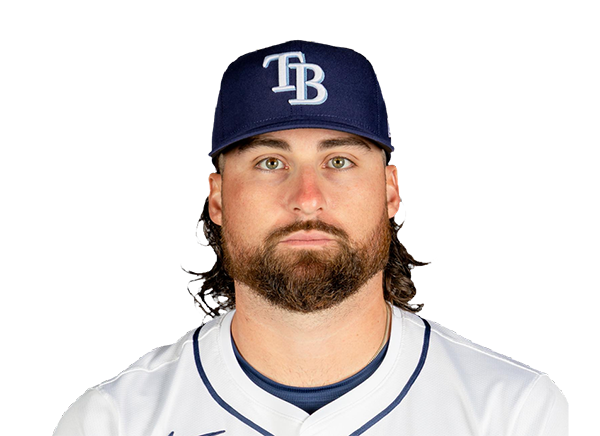 Ryan Vilade | 1-2 | 2 | 1 | 1 | 2 | 1 | 1 | 1 | 11 | .260 | .325 | .480 |
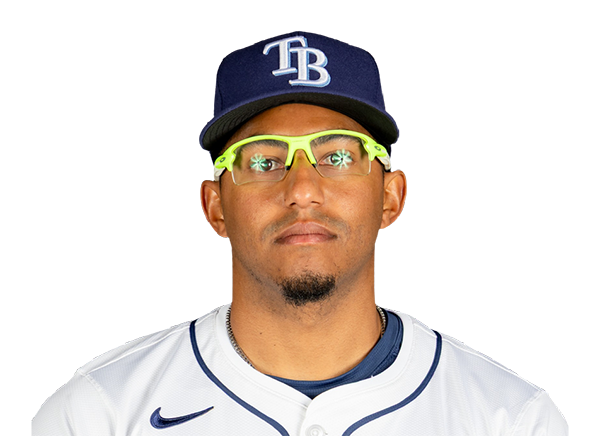 Richie Palacios | 1-2 | 2 | 1 | 1 | 3 | 1 | 0 | 1 | 7 | .233 | .328 | .344 |
 Ben Williamson | 1-5 | 5 | 1 | 1 | 1 | 0 | 0 | 1 | 18 | .251 | .316 | .332 |
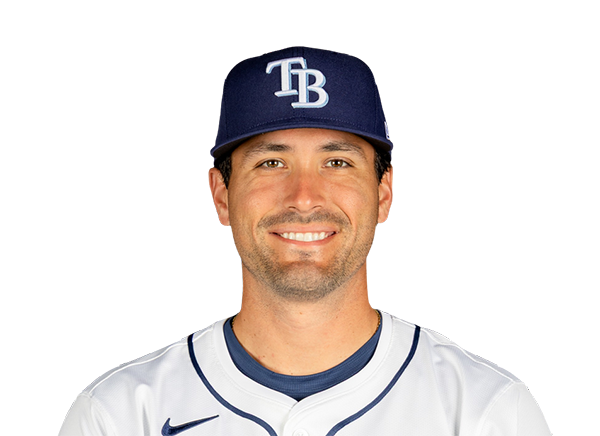 Nick Fortes | 4-4 | 4 | 1 | 4 | 2 | 0 | 0 | 0 | 15 | .281 | .321 | .386 |
Cleveland Guardians
| Player | IP | H | R | ER | BB | K | HR | PC-ST | ERA | PC |
|---|---|---|---|---|---|---|---|---|---|---|
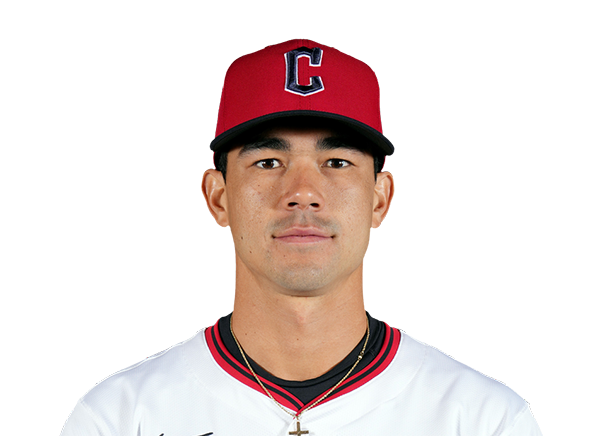 Joey Cantillo | 3.2 | 8 | 5 | 5 | 1 | 4 | 1 | 74-45 | 4.02 | 74 |
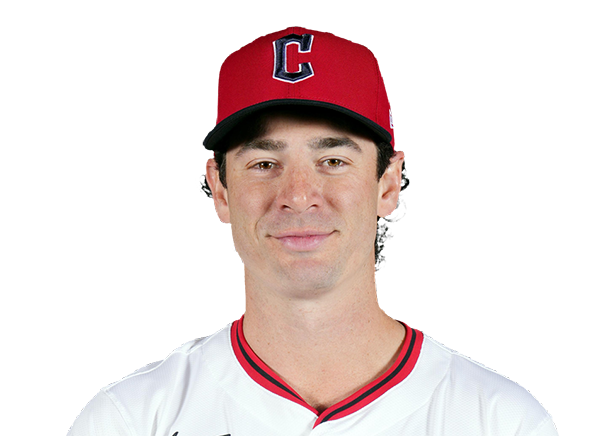 Matt Festa | 1.2 | 2 | 1 | 1 | 0 | 2 | 0 | 28-16 | 4.60 | 28 |
 Franco Aleman | 0.2 | 1 | 0 | 0 | 1 | 3 | 0 | 21-14 | 1.54 | 21 |
 Tim Herrin | 1.0 | 2 | 1 | 1 | 0 | 1 | 0 | 16-11 | 3.24 | 16 |
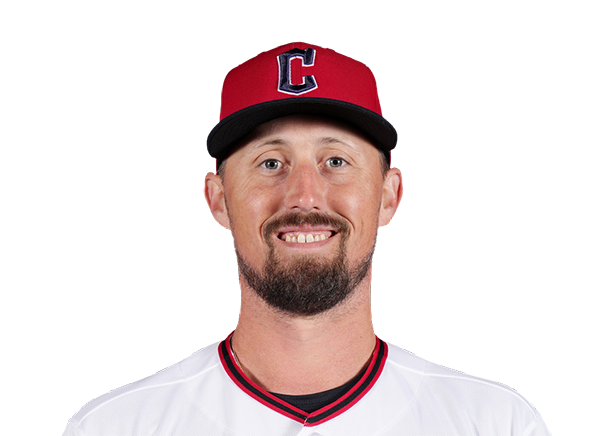 Shawn Armstrong | 0.2 | 1 | 3 | 3 | 2 | 0 | 0 | 23-12 | 4.91 | 23 |
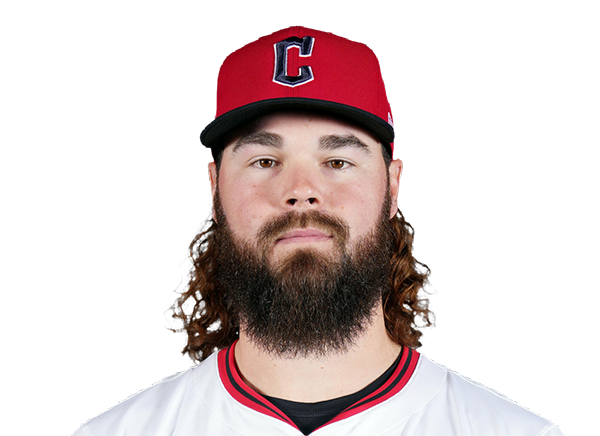 Hunter Gaddis | 0.1 | 1 | 1 | 1 | 0 | 0 | 1 | 6-3 | 2.94 | 6 |
Tampa Bay Rays
| Player | IP | H | R | ER | BB | K | HR | PC-ST | ERA | PC |
|---|---|---|---|---|---|---|---|---|---|---|
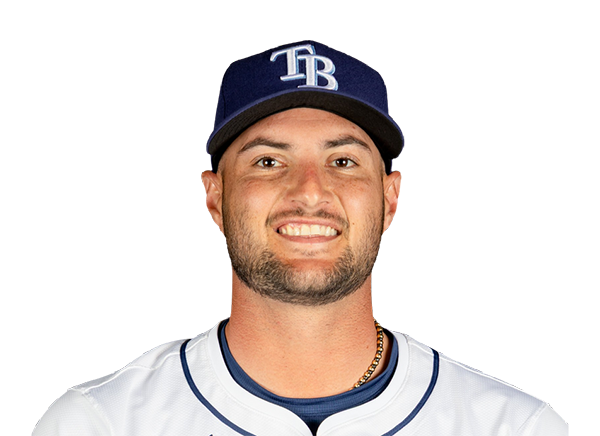 Shane McClanahan | 5.0 | 2 | 1 | 1 | 2 | 3 | 0 | 71-45 | 3.09 | 71 |
 Cole Sulser | 1.0 | 1 | 0 | 0 | 0 | 2 | 0 | 15-9 | 4.96 | 15 |
 Chris Roycroft | 3.0 | 4 | 2 | 2 | 0 | 2 | 1 | 38-28 | 8.35 | 38 |
H2H / Season Series
TB1–0
CLE
TB3–0
CLE
TB11–3
CLE
CLE3–1
TB
CLE0–1
TB
CLE2–3
TB
Last 5 Games
| Date | Opponent | Result |
|---|---|---|
| Aug 21 |  @ COL | W9–1 |
| Aug 20 |  vs SF | W5–2 |
| Aug 19 | vs SF | L0–1 |
| Aug 18 | vs SF | W8–1 |
| Aug 16 |  vs SD | L0–5 |
| Date | Opponent | Result |
|---|---|---|
| Aug 21 |  @ BAL | L3–5 |
| Aug 20 |  vs TOR | L1–5 |
| Aug 19 | vs TOR | W7–6 |
| Aug 18 | vs TOR | L5–10 |
| Aug 17 | vs BAL | W7–6 |
Standings
American League
| Team | W | L | PCT | GB | DIFF | STRK |
|---|---|---|---|---|---|---|
| 1Rays | 76 | 52 | .594 | - | +43 | L2 |
2 White Sox | 67 | 61 | .523 | 9 | +47 | W1 |
3 Astros | 65 | 64 | .504 | 11.5 | -42 | W1 |
4 Yankees | 73 | 56 | .566 | 3.5 | +95 | L1 |
5 Red Sox | 69 | 59 | .539 | 7 | +97 | W1 |
6 Rangers | 64 | 65 | .496 | 12.5 | -45 | W2 |
| 7Blue Jays | 64 | 67 | .489 | 13.5 | -50 | W1 |
8 Twins | 63 | 66 | .488 | 13.5 | -45 | L1 |
| 9Guardians | 63 | 66 | .488 | 13.5 | -15 | W2 |
| 10Orioles | 62 | 67 | .481 | 14.5 | -34 | W1 |
11 Tigers | 61 | 67 | .477 | 15 | +79 | L3 |
12 Mariners | 61 | 68 | .473 | 15.5 | -45 | W1 |
13 Royals | 56 | 74 | .431 | 21 | -97 | W6 |
14 Angels | 51 | 78 | .395 | 25.5 | -71 | L1 |
15 Athletics | 49 | 80 | .380 | 27.5 | -189 | L5 |
National League
| Team | W | L | PCT | GB | DIFF | STRK |
|---|---|---|---|---|---|---|
1 Brewers | 81 | 49 | .623 | - | +163 | W3 |
2 Dodgers | 78 | 51 | .605 | 2.5 | +146 | W4 |
3 Braves | 75 | 55 | .577 | 6 | +108 | L2 |
4 Cubs | 74 | 55 | .574 | 6.5 | +99 | L2 |
5 Phillies | 71 | 58 | .550 | 9.5 | +16 | W7 |
| 6Padres | 69 | 60 | .535 | 11.5 | +7 | W1 |
7 Diamondbacks | 68 | 61 | .527 | 12.5 | +13 | W2 |
8 Cardinals | 66 | 64 | .508 | 15 | +9 | L1 |
9 Marlins | 65 | 64 | .504 | 15.5 | +15 | W1 |
10 Pirates | 63 | 67 | .485 | 18 | +30 | L1 |
11 Reds | 61 | 68 | .473 | 19.5 | -98 | L2 |
12 Nationals | 61 | 69 | .469 | 20 | +16 | L2 |
13 Mets | 58 | 71 | .450 | 22.5 | -44 | L1 |
| 14Giants | 52 | 76 | .406 | 28 | -78 | L2 |
| 15Rockies | 50 | 78 | .391 | 30 | -130 | L4 |
CLE
VS
TB
Pitchers
Joey Cantillo
Matt Festa
Franco Aleman
Tim Herrin
Shawn Armstrong
Hunter Gaddis
Catchers
Austin Hedges
Infielders
Rhys Hoskins
Brayan Rocchio
Travis Bazzana
Gabriel Arias
Outfielders
Angel Martinez
David Fry
Petey Halpin
Designated Hitters
Chase DeLauter
Pitchers
Shane McClanahan
Cole Sulser
Chris Roycroft
Catchers
Nick Fortes
Infielders
Jonathan Aranda
Junior Caminero
Ryan Vilade
Richie Palacios
Ben Williamson
Outfielders
Cedric Mullins
Jonny DeLuca
Chandler Simpson
Designated Hitters
Yandy Diaz
Guardians
VS
Rays
Batting
129
Team Games Played
128
4289
At Bats
4303
1005
Hits
1123
493
Runs Batted In
554
122
Home Runs
134
124
Stolen Bases
128
.234
Batting Average
.261
516
Runs
582
194
Doubles
181
11
Triples
20
1587
Total Bases
1746
469
Walks
413
1051
Strikeouts
909
.314
On Base Percentage
.330
.370
Slugging Percentage
.406
.684
OBP Pct + SLG Pct
.736
129
Games Played
128
129
Games Started
128
42
Hit By Pitch
47
0.0
Wins Above Replacement
0.0
0.0
Offensive Wins Above Replacement
0.0
25
Caught Stealing
41
1
Is Qualified
1
526.6
Runs Created
586.5
4.1
Runs Created Per 27 Outs
4.7
.097
Walks Per Plate Appearance
.085
0.45
Walk To Strikeout Ratio
0.45
.136
Isolated Power
.145
.268
Secondary Average
.261
3.95
Pitches Per Plate Appearance
3.78
327
Extra Base Hits
335
4858
Plate Appearances
4837
35.2
At Bats Per Home Run
32.1
23
Sacrifice Hit
36
33
Sacrifice Flies
35
Pitching
129
Team Games Played
128
45
Quality Starts
39
63
Wins
76
66
Losses
52
36
Saves
50
96
Holds
96
1020
Hits
1006
478
Earned runs
491
147
Home Runs
165
428
Walks
328
1205
Strikeouts
1047
9.5
Strikeouts Per 9 Innings
8.3
147.8
Pitches Per Start
139.8
1.27
Walks Plus Hits Per Inning Pitched
1.17
3.76
Earned Run Average
3.87
66
Losses
52
1142.2
Innings pitched
1142.0
.488
Win Percentage
.594
50
Save Opportunities
64
.237
Opponent Batting Average
.234
.311
Opponent's On-base pct.
.293
.392
Opponent's Slugging pct.
.401
.703
Opponent's OPB Pct + SLG Pct
.695
4303
At Bats
4296
196
Doubles
197
15
Triples
13
50
Batters Hit
48
88
Stolen Bases
109
129
Games Played
128
0
Complete Games
1
4
Shutouts
11
49
Wild Pitches
35
506
Runs Batted In
515
2
Balks
2
1142.2
Innings pitched
1142.0
9.5
Strikeouts Per 9 Innings
8.3
18
Caught Stealing
29
129
Games Started
128
0.0
Wins Above Replacement
0.0
1
Is Qualified
1
531
Runs
539
478
Earned Runs
491
1687
Total Bases
1724
Fielding
129
Team Games Played
128
1143
Full Innings
1142
4501
Total Chances
4513
3428
Putouts
3426
1005
Assists
1010
68
Errors
77
194
Double Plays
181
0.985
Fielding Percentage
0.983
34.9
Range Factor
35.0
0.0
Zone Rating
0.0
129
Games Played
128
0
Games Started
0
0.0
Defensive Wins Above Replacement
0.0
1
Qualified
1