

Guardians vs Red Sox Live Score (23 Sep, 2026)
Game Information
Stage
STD
Season
2026
First Pitch
Wed, Sep 23, 7:00 pm
Venue
Fenway Park
Location
Boston, Massachusetts
Venue Type
Outdoor
Broadcast
ESPN
Attendance
36,360
Live Situation
0Balls
3Strikes
0Outs
—Pitcher
—At Bat
Pitch Sequence
1
STRIKE FOUL
Sinker
98 MPH
2
STRIKE SWINGING
Splitter
90 MPH
3
STRIKE SWINGING
Splitter
90 MPH
Injury Report



Team Stats
 CLE
BOS


0
Runs
1
5
Hits
12
1
Errors
0
0
Home Runs
0
3
Walks
0
9
Strikeouts
10
Player Box Score
Cleveland Guardians
| Player | H-AB | AB | R | H | RBI | HR | BB | K | #P | AVG | OBP | SLG |
|---|---|---|---|---|---|---|---|---|---|---|---|---|
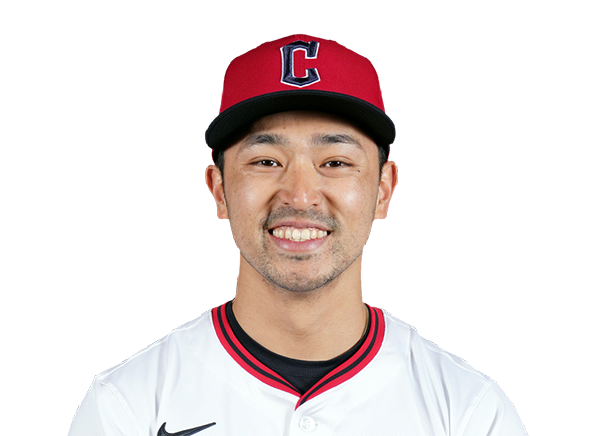 Steven Kwan | 2-4 | 4 | 0 | 2 | 0 | 0 | 0 | 0 | 17 | .282 | .379 | .346 |
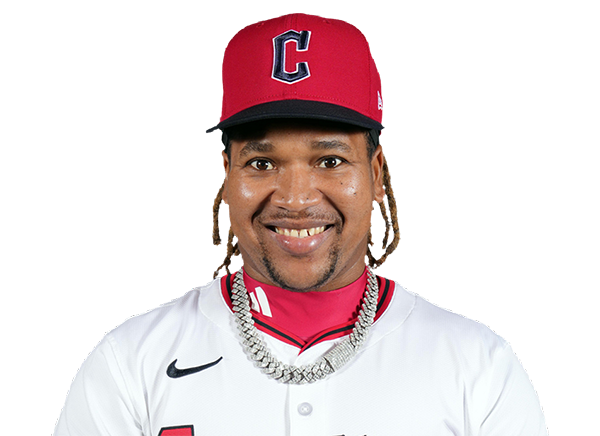 Jose Ramirez | 0-3 | 3 | 0 | 0 | 0 | 0 | 1 | 0 | 20 | .235 | .322 | .372 |
 Chase DeLauter | 0-4 | 4 | 0 | 0 | 0 | 0 | 0 | 1 | 13 | .290 | .364 | .455 |
 Jo Adell | 0-3 | 3 | 0 | 0 | 0 | 0 | 1 | 1 | 15 | .240 | .296 | .398 |
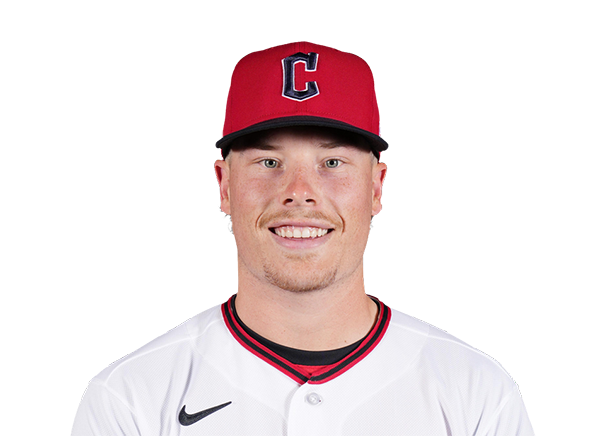 Travis Bazzana | 0-2 | 2 | 0 | 0 | 0 | 0 | 1 | 2 | 20 | .245 | .337 | .404 |
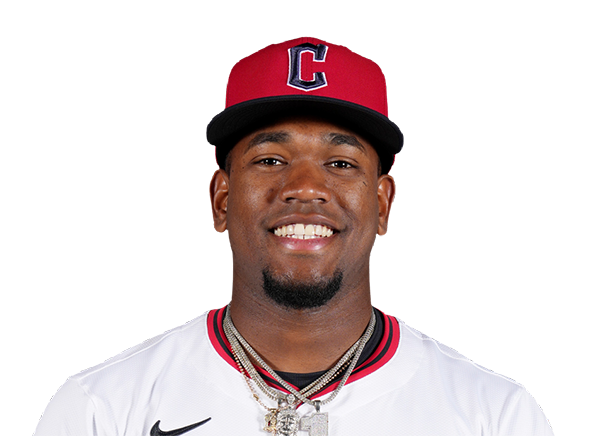 Angel Martinez | 0-1 | 1 | 0 | 0 | 0 | 0 | 0 | 1 | 4 | .258 | .293 | .468 |
 Nathaniel Lowe | 0-3 | 3 | 0 | 0 | 0 | 0 | 0 | 1 | 9 | .251 | .317 | .447 |
 Angel Genao | 0-1 | 1 | 0 | 0 | 0 | 0 | 0 | 1 | 3 | .211 | .276 | .293 |
 Patrick Bailey | 1-3 | 3 | 0 | 1 | 0 | 0 | 0 | 1 | 8 | .207 | .272 | .320 |
 Petey Halpin | 1-3 | 3 | 0 | 1 | 0 | 0 | 0 | 1 | 11 | .224 | .261 | .328 |
 Brayan Rocchio | 1-3 | 3 | 0 | 1 | 0 | 0 | 0 | 0 | 11 | .250 | .311 | .379 |
Boston Red Sox
| Player | H-AB | AB | R | H | RBI | HR | BB | K | #P | AVG | OBP | SLG |
|---|---|---|---|---|---|---|---|---|---|---|---|---|
 Roman Anthony | 1-4 | 4 | 0 | 1 | 0 | 0 | 0 | 1 | 11 | .235 | .328 | .373 |
 Nick Sogard | 2-4 | 4 | 0 | 2 | 0 | 0 | 0 | 1 | 16 | .258 | .344 | .396 |
 Jahmai Jones | 2-4 | 4 | 0 | 2 | 0 | 0 | 0 | 2 | 18 | .213 | .303 | .381 |
 Wilyer Abreu | 2-4 | 4 | 0 | 2 | 0 | 0 | 0 | 1 | 16 | .253 | .332 | .454 |
 Adley Rutschman | 1-4 | 4 | 0 | 1 | 0 | 0 | 0 | 1 | 11 | .240 | .313 | .421 |
 Ceddanne Rafaela | 1-1 | 1 | 0 | 1 | 0 | 0 | 0 | 0 | 2 | .284 | .319 | .444 |
 Jarren Duran | 2-3 | 3 | 1 | 2 | 0 | 0 | 0 | 1 | 7 | .207 | .265 | .364 |
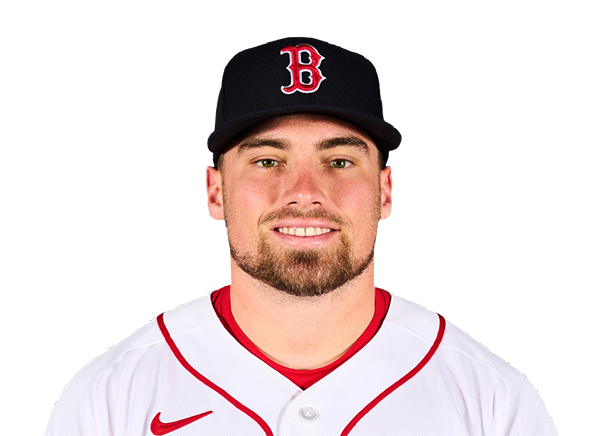 Caleb Durbin | 0-4 | 4 | 0 | 0 | 0 | 0 | 0 | 0 | 17 | .252 | .336 | .384 |
 Trevor Story | 0-4 | 4 | 0 | 0 | 0 | 0 | 0 | 2 | 12 | .243 | .273 | .362 |
 Andruw Monasterio | 1-3 | 3 | 0 | 1 | 1 | 0 | 0 | 1 | 8 | .238 | .299 | .380 |
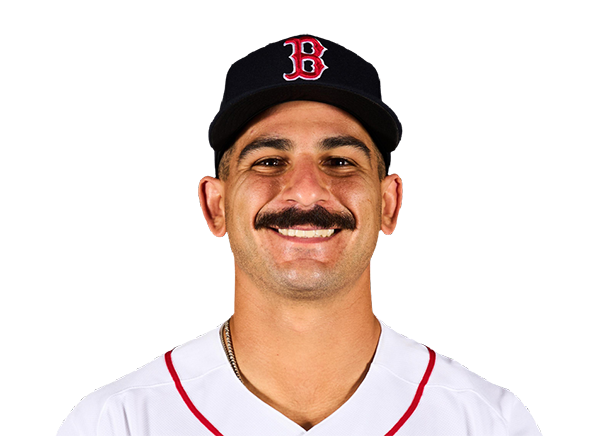 Mickey Gasper | 0-1 | 1 | 0 | 0 | 0 | 0 | 0 | 0 | 1 | .258 | .362 | .478 |
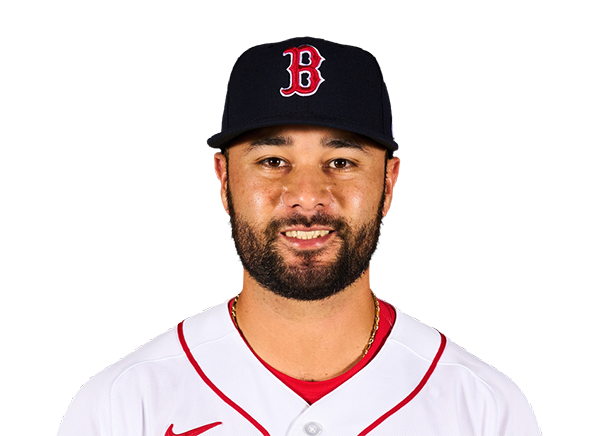 Isiah Kiner-Falefa | 0-0 | 0 | 0 | 0 | 0 | 0 | 0 | 0 | 0 | .242 | .318 | .314 |
Cleveland Guardians
| Player | IP | H | R | ER | BB | K | HR | PC-ST | ERA | PC |
|---|---|---|---|---|---|---|---|---|---|---|
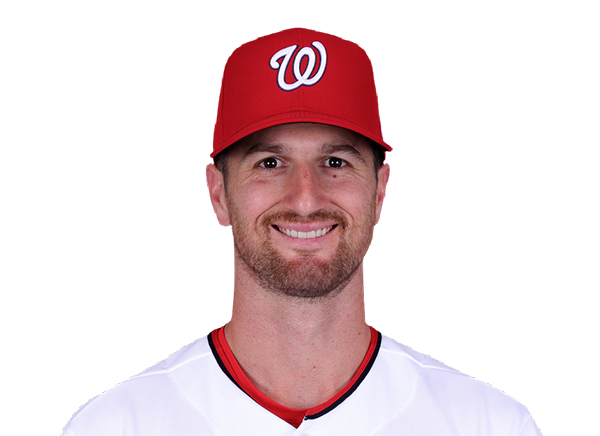 Foster Griffin | 6.0 | 10 | 1 | 1 | 0 | 7 | 0 | 83-65 | 3.60 | 83 |
 Tim Herrin | 1.0 | 1 | 0 | 0 | 0 | 3 | 0 | 21-15 | 2.89 | 21 |
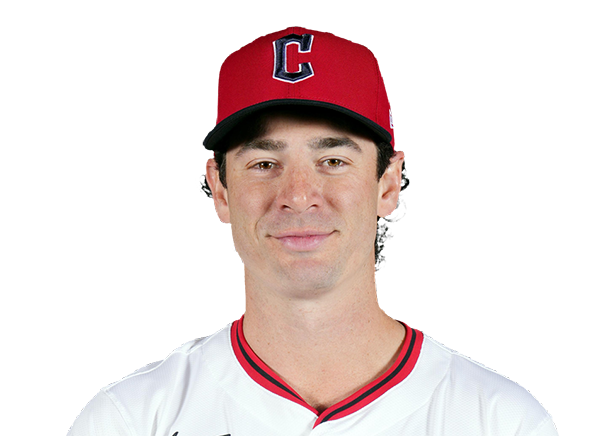 Matt Festa | 0.2 | 1 | 0 | 0 | 0 | 0 | 0 | 14-11 | 3.56 | 14 |
 Shawn Armstrong | 0.1 | 0 | 0 | 0 | 0 | 0 | 0 | 1-1 | 4.86 | 1 |
Boston Red Sox
| Player | IP | H | R | ER | BB | K | HR | PC-ST | ERA | PC |
|---|---|---|---|---|---|---|---|---|---|---|
 Sonny Gray | 6.0 | 4 | 0 | 0 | 1 | 3 | 0 | 77-52 | 2.72 | 77 |
 Tyron Guerrero | 1.0 | 0 | 0 | 0 | 1 | 3 | 0 | 22-17 | 3.10 | 22 |
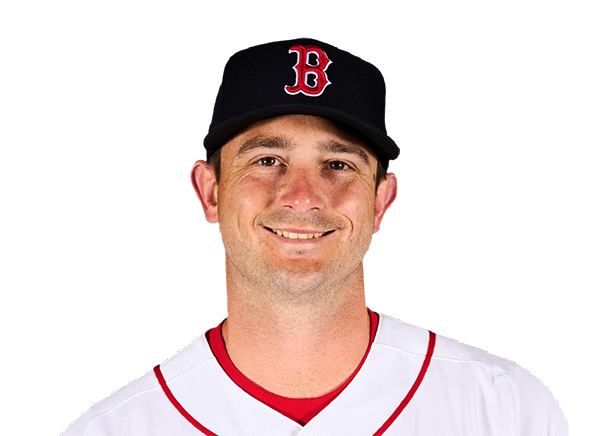 Garrett Whitlock | 1.0 | 1 | 0 | 0 | 1 | 0 | 0 | 20-14 | 1.72 | 20 |
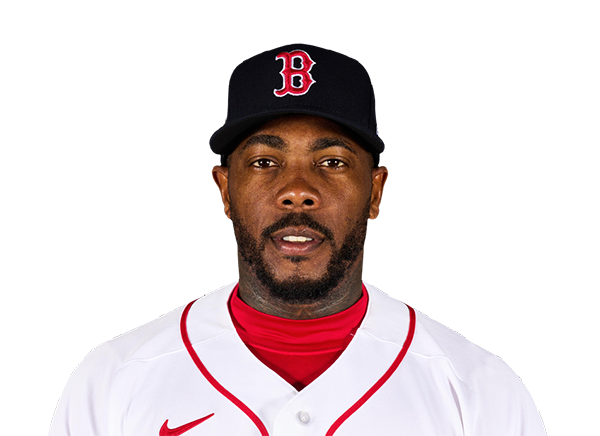 Aroldis Chapman | 1.0 | 0 | 0 | 0 | 0 | 3 | 0 | 12-10 | 1.92 | 12 |
H2H / Season Series
BOS1–0
CLE
BOS2–3
CLE
CLE4–9
BOS
CLE1–9
BOS
CLE4–3
BOS
Last 5 Games
| Date | Opponent | Result |
|---|---|---|
| Sep 23 | @ BOS | L0–1 |
| Sep 22 | @ BOS | W3–2 |
| Sep 20 |  vs ATH | W1–0 |
| Sep 19 | vs ATH | W12–6 |
| Sep 18 | vs ATH | W5–3 |
| Date | Opponent | Result |
|---|---|---|
| Sep 23 | vs CLE | W1–0 |
| Sep 22 | vs CLE | L2–3 |
| Sep 20 |  @ TB | L1–5 |
| Sep 19 | @ TB | L1–2 |
| Sep 18 | @ TB | W4–2 |
Standings
American League
| Team | W | L | PCT | GB | DIFF | STRK |
|---|---|---|---|---|---|---|
| 1Rays | 96 | 62 | .608 | - | +79 | L1 |
| 2Guardians | 82 | 76 | .519 | 14 | +2 | L1 |
3 Astros | 78 | 80 | .494 | 18 | -53 | L1 |
4 Yankees | 91 | 67 | .576 | 5 | +141 | W1 |
| 5Red Sox | 85 | 73 | .538 | 11 | +80 | W1 |
6 White Sox | 81 | 77 | .513 | 15 | +44 | L1 |
7 Rangers | 78 | 80 | .494 | 18 | -42 | L3 |
8 Orioles | 78 | 81 | .491 | 18.5 | -26 | W3 |
9 Blue Jays | 77 | 82 | .484 | 19.5 | -47 | L3 |
10 Twins | 75 | 84 | .472 | 21.5 | -64 | W2 |
11 Mariners | 74 | 84 | .468 | 22 | -62 | W1 |
12 Tigers | 74 | 85 | .465 | 22.5 | +71 | L2 |
13 Royals | 68 | 90 | .430 | 28 | -104 | W1 |
| 14Athletics | 63 | 95 | .399 | 33 | -217 | W2 |
15 Angels | 60 | 98 | .380 | 36 | -93 | L3 |
National League
| Team | W | L | PCT | GB | DIFF | STRK |
|---|---|---|---|---|---|---|
1 Brewers | 99 | 59 | .627 | - | +203 | W1 |
2 Dodgers | 97 | 61 | .614 | 2 | +196 | L1 |
3 Braves | 93 | 65 | .589 | 6 | +117 | W1 |
4 Padres | 88 | 70 | .557 | 11 | +38 | W1 |
5 Cubs | 87 | 71 | .551 | 12 | +145 | L2 |
6 Phillies | 87 | 71 | .551 | 12 | +28 | L1 |
7 Diamondbacks | 84 | 74 | .532 | 15 | +6 | W4 |
8 Pirates | 80 | 78 | .506 | 19 | +27 | L1 |
9 Marlins | 78 | 80 | .494 | 21 | +4 | W2 |
10 Cardinals | 77 | 81 | .487 | 22 | -21 | W1 |
11 Nationals | 75 | 84 | .472 | 24.5 | +9 | W2 |
12 Reds | 73 | 85 | .462 | 26 | -160 | L1 |
13 Mets | 73 | 85 | .462 | 26 | -33 | W2 |
14 Giants | 65 | 94 | .409 | 34.5 | -84 | L2 |
15 Rockies | 57 | 101 | .361 | 42 | -184 | L3 |
CLE
VS
BOS
Pitchers
Foster Griffin
Catchers
Patrick Bailey
Infielders
Jose Ramirez
Travis Bazzana
Nathaniel Lowe
Brayan Rocchio
Outfielders
Steven Kwan
Jo Adell
Petey Halpin
Designated Hitters
Chase DeLauter
Pitchers
Sonny Gray
Catchers
Adley Rutschman
Infielders
Nick Sogard
Caleb Durbin
Trevor Story
Andruw Monasterio
Outfielders
Roman Anthony
Wilyer Abreu
Ceddanne Rafaela
Designated Hitters
Jahmai Jones
Guardians
VS
Red Sox
Batting
158
Team Games Played
158
5270
At Bats
5296
1255
Hits
1306
624
Runs Batted In
651
152
Home Runs
162
143
Stolen Bases
105
.238
Batting Average
.247
652
Runs
681
243
Doubles
281
14
Triples
25
1982
Total Bases
2123
555
Walks
501
1251
Strikeouts
1293
.315
On Base Percentage
.320
.376
Slugging Percentage
.401
.691
OBP Pct + SLG Pct
.721
158
Games Played
158
158
Games Started
158
58
Hit By Pitch
94
0.0
Wins Above Replacement
0.0
0.0
Offensive Wins Above Replacement
0.0
30
Caught Stealing
39
1
Is Qualified
1
653.6
Runs Created
696.2
4.2
Runs Created Per 27 Outs
4.5
.093
Walks Per Plate Appearance
.084
0.44
Walk To Strikeout Ratio
0.39
.138
Isolated Power
.154
.265
Secondary Average
.261
3.94
Pitches Per Plate Appearance
3.85
409
Extra Base Hits
468
5954
Plate Appearances
5977
34.7
At Bats Per Home Run
32.7
27
Sacrifice Hit
36
42
Sacrifice Flies
46
Pitching
158
Team Games Played
158
58
Quality Starts
64
82
Wins
85
76
Losses
73
45
Saves
45
111
Holds
94
1252
Hits
1276
585
Earned runs
556
170
Home Runs
150
517
Walks
460
1498
Strikeouts
1370
9.6
Strikeouts Per 9 Innings
8.8
148.3
Pitches Per Start
140.5
1.26
Walks Plus Hits Per Inning Pitched
1.24
3.75
Earned Run Average
3.56
76
Losses
73
1402.2
Innings pitched
1404.0
.519
Win Percentage
.538
62
Save Opportunities
59
.237
Opponent Batting Average
.241
.311
Opponent's On-base pct.
.308
.386
Opponent's Slugging pct.
.376
.697
Opponent's OPB Pct + SLG Pct
.684
5282
At Bats
5287
243
Doubles
246
17
Triples
9
73
Batters Hit
64
101
Stolen Bases
110
158
Games Played
158
0
Complete Games
0
5
Shutouts
17
55
Wild Pitches
35
618
Runs Batted In
575
2
Balks
3
1402.2
Innings pitched
1404.0
9.6
Strikeouts Per 9 Innings
8.8
22
Caught Stealing
22
158
Games Started
158
0.0
Wins Above Replacement
0.0
1
Is Qualified
1
650
Runs
601
585
Earned Runs
556
2039
Total Bases
1990
Fielding
158
Team Games Played
158
1403
Full Innings
1404
5518
Total Chances
5672
4208
Putouts
4212
1228
Assists
1380
82
Errors
80
243
Double Plays
281
0.985
Fielding Percentage
0.986
34.9
Range Factor
35.8
0.0
Zone Rating
0.0
158
Games Played
158
0
Games Started
0
0.0
Defensive Wins Above Replacement
0.0
1
Qualified
1