

Guardians vs Royals Live Score (25 Sep, 2026)
Game Information
Stage
STD
Season
2026
First Pitch
Fri, Sep 25, 7:40 pm
Venue
Kauffman Stadium
Location
Kansas City, Missouri
Venue Type
Outdoor
Broadcast
MLB.TV
Attendance
26,034
Live Situation
0Balls
0Strikes
0Outs
—Pitcher
—At Bat
Pitch Sequence
1
BALL IN PLAY
Sweeper
84 MPH
Injury Report

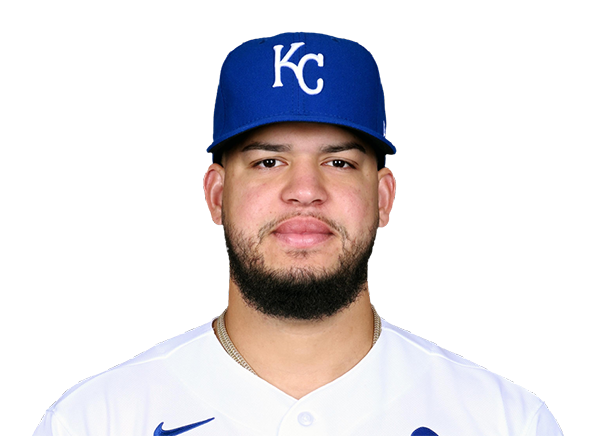
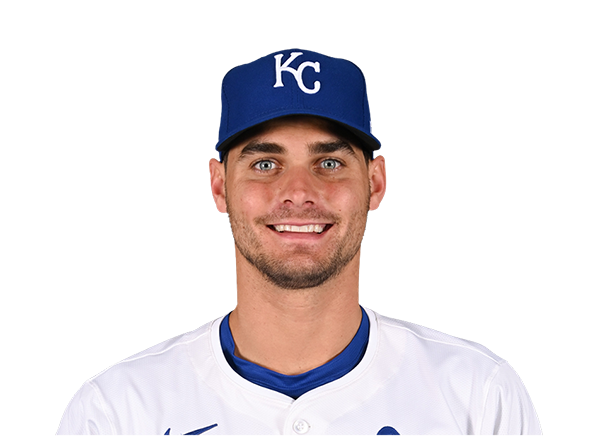
Team Stats
 CLE
KC


12
Runs
9
9
Hits
13
2
Errors
1
2
Home Runs
3
13
Walks
5
3
Strikeouts
6
Player Box Score
Cleveland Guardians
| Player | H-AB | AB | R | H | RBI | HR | BB | K | #P | AVG | OBP | SLG |
|---|---|---|---|---|---|---|---|---|---|---|---|---|
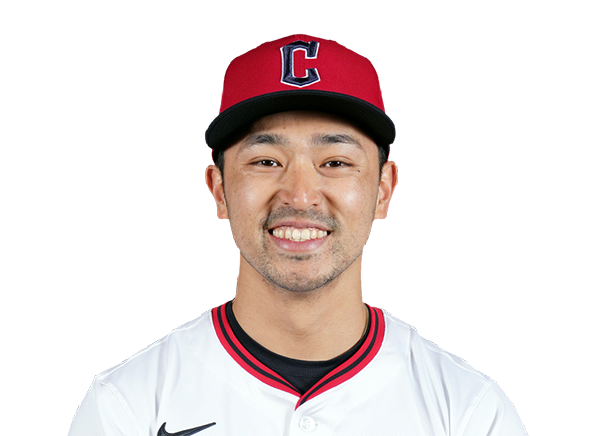 Steven Kwan | 0-3 | 3 | 2 | 0 | 0 | 0 | 2 | 0 | 26 | .279 | .379 | .342 |
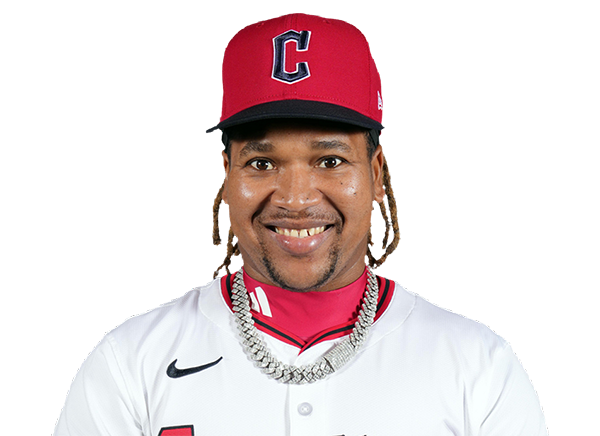 Jose Ramirez | 1-4 | 4 | 2 | 1 | 2 | 0 | 1 | 0 | 18 | .237 | .323 | .372 |
 Chase DeLauter | 1-4 | 4 | 1 | 1 | 1 | 0 | 2 | 1 | 25 | .287 | .363 | .452 |
 Jo Adell | 1-3 | 3 | 1 | 1 | 0 | 0 | 2 | 0 | 18 | .239 | .296 | .397 |
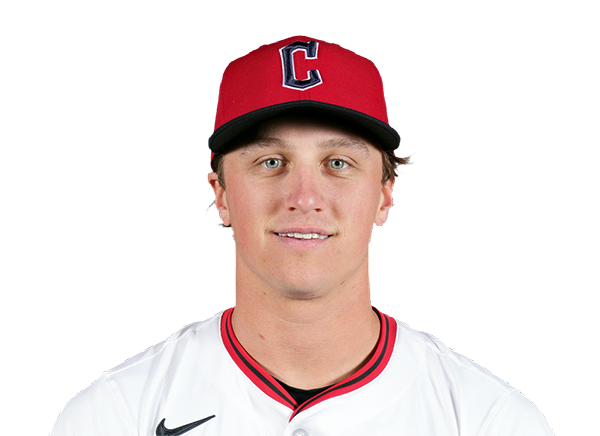 Petey Halpin | 0-0 | 0 | 0 | 0 | 1 | 0 | 1 | 0 | 4 | .224 | .265 | .328 |
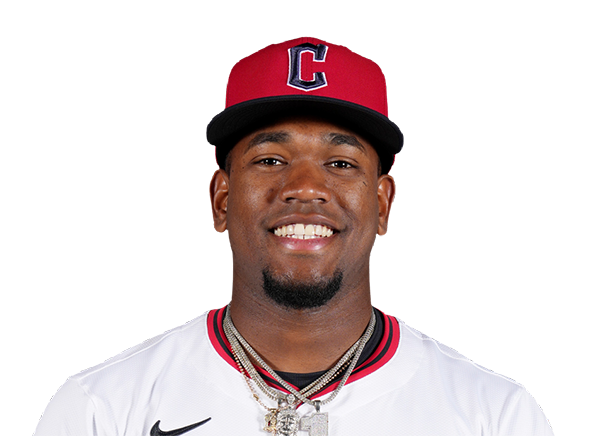 Angel Martinez | 2-5 | 5 | 0 | 2 | 4 | 0 | 1 | 0 | 19 | .260 | .296 | .475 |
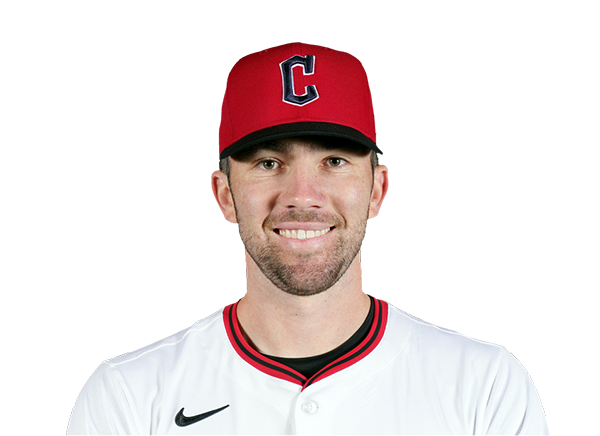 David Fry | 1-4 | 4 | 1 | 1 | 2 | 1 | 0 | 0 | 12 | .194 | .310 | .361 |
 Nathaniel Lowe | 0-0 | 0 | 0 | 0 | 0 | 0 | 1 | 0 | 4 | .251 | .319 | .447 |
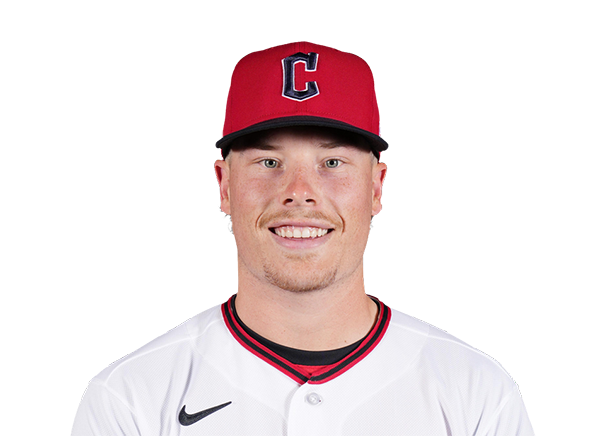 Travis Bazzana | 1-5 | 5 | 1 | 1 | 0 | 0 | 0 | 1 | 25 | .243 | .334 | .401 |
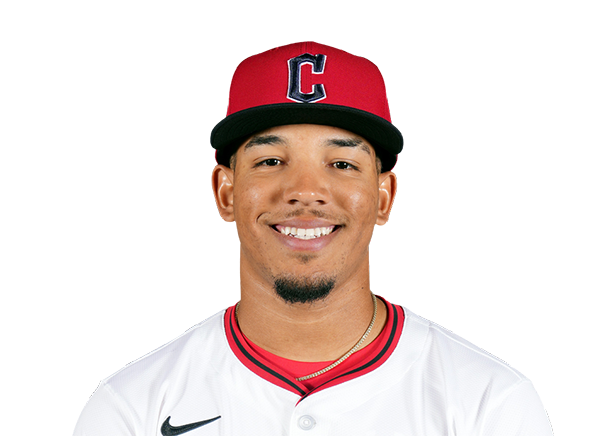 Angel Genao | 0-0 | 0 | 0 | 0 | 0 | 0 | 0 | 0 | 0 | .211 | .276 | .293 |
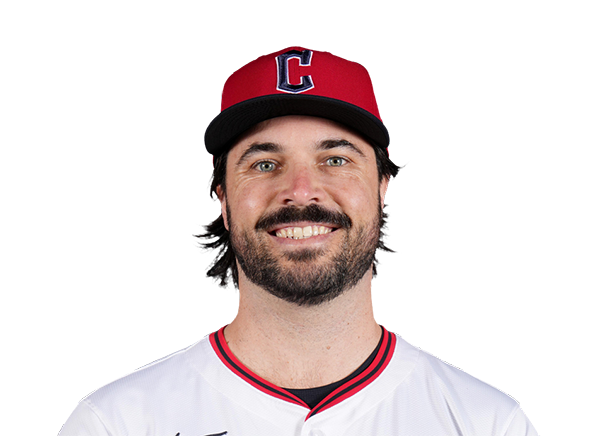 Austin Hedges | 1-3 | 3 | 2 | 1 | 1 | 1 | 1 | 0 | 11 | .249 | .328 | .380 |
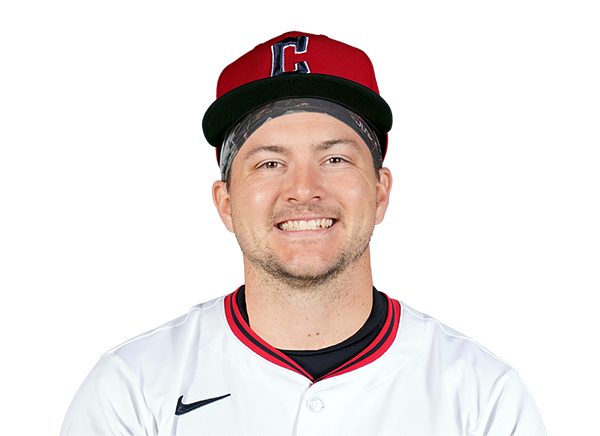 Patrick Bailey | 0-0 | 0 | 1 | 0 | 0 | 0 | 1 | 0 | 4 | .205 | .272 | .317 |
 Brayan Rocchio | 1-4 | 4 | 1 | 1 | 1 | 0 | 1 | 1 | 16 | .249 | .310 | .375 |
Kansas City Royals
| Player | H-AB | AB | R | H | RBI | HR | BB | K | #P | AVG | OBP | SLG |
|---|---|---|---|---|---|---|---|---|---|---|---|---|
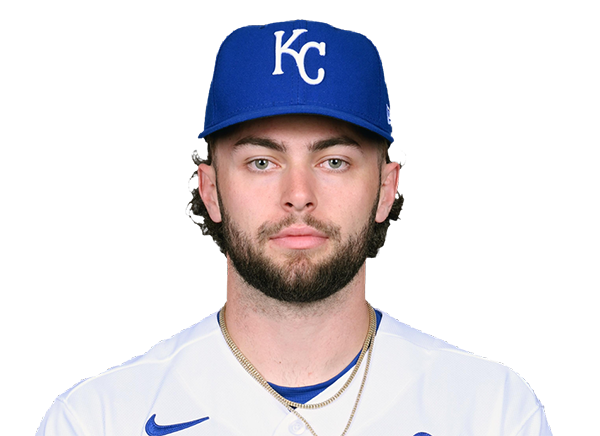 Carter Jensen | 2-4 | 4 | 2 | 2 | 5 | 2 | 0 | 1 | 16 | .237 | .321 | .463 |
 Bobby Witt Jr. | 1-4 | 4 | 2 | 1 | 0 | 0 | 1 | 1 | 19 | .282 | .361 | .442 |
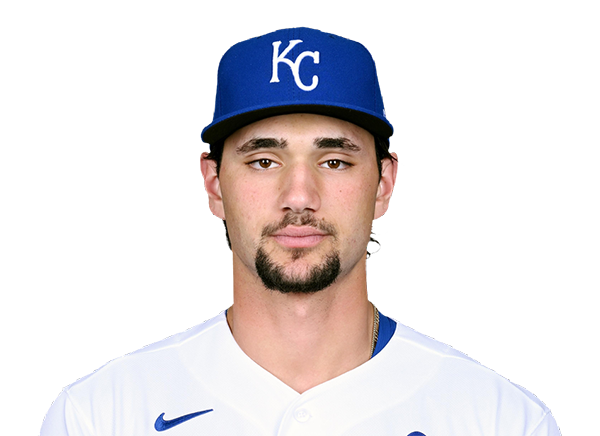 Jac Caglianone | 3-5 | 5 | 0 | 3 | 2 | 0 | 0 | 1 | 19 | .286 | .338 | .488 |
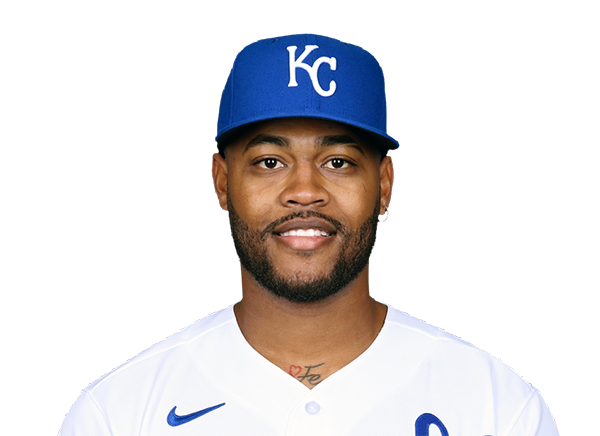 Maikel Garcia | 2-4 | 4 | 1 | 2 | 0 | 0 | 1 | 0 | 23 | .266 | .329 | .380 |
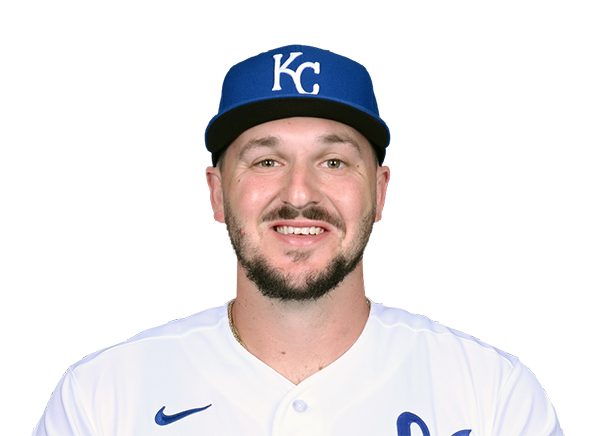 Vinnie Pasquantino | 1-4 | 4 | 0 | 1 | 0 | 0 | 1 | 1 | 19 | .246 | .330 | .413 |
 Salvador Perez | 1-4 | 4 | 1 | 1 | 2 | 1 | 1 | 0 | 26 | .229 | .273 | .382 |
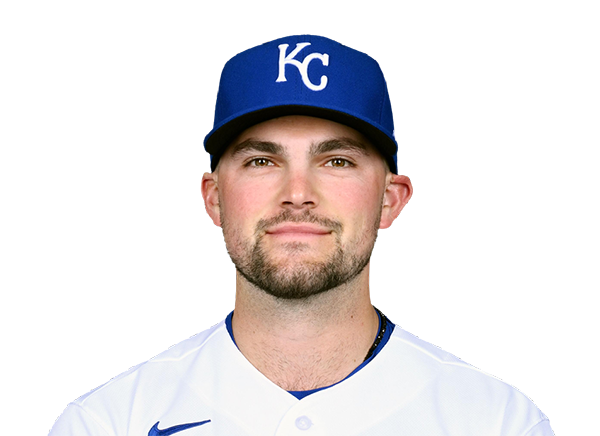 Michael Massey | 1-5 | 5 | 0 | 1 | 0 | 0 | 0 | 2 | 27 | .272 | .303 | .430 |
 John Rave | 1-3 | 3 | 2 | 1 | 0 | 0 | 1 | 0 | 14 | .232 | .316 | .435 |
 Kyle Isbel | 1-3 | 3 | 1 | 1 | 0 | 0 | 0 | 0 | 13 | .221 | .265 | .321 |
Cleveland Guardians
| Player | IP | H | R | ER | BB | K | HR | PC-ST | ERA | PC |
|---|---|---|---|---|---|---|---|---|---|---|
 Gavin Williams | 3.1 | 5 | 4 | 4 | 4 | 4 | 1 | 74-46 | 3.76 | 74 |
 Tim Herrin | 0.2 | 3 | 1 | 1 | 0 | 0 | 0 | 18-12 | 3.02 | 18 |
 Shawn Armstrong | 1.0 | 0 | 0 | 0 | 0 | 0 | 0 | 19-13 | 4.72 | 19 |
 Daniel Espino | 1.0 | 0 | 0 | 0 | 0 | 1 | 0 | 13-9 | 4.11 | 13 |
 Erik Sabrowski | 1.0 | 1 | 0 | 0 | 0 | 1 | 0 | 18-11 | 2.61 | 18 |
 Hunter Gaddis | 1.0 | 3 | 2 | 2 | 0 | 0 | 1 | 13-11 | 2.98 | 13 |
 Matt Festa | 1.0 | 1 | 2 | 2 | 1 | 0 | 1 | 21-13 | 3.78 | 21 |
Kansas City Royals
| Player | IP | H | R | ER | BB | K | HR | PC-ST | ERA | PC |
|---|---|---|---|---|---|---|---|---|---|---|
 Noah Cameron | 5.0 | 7 | 7 | 6 | 4 | 3 | 2 | 101-56 | 4.11 | 101 |
 Connor Thomas | 2.0 | 1 | 0 | 0 | 0 | 0 | 0 | 22-16 | 7.40 | 22 |
 Lucas Erceg | 1.0 | 0 | 0 | 0 | 3 | 0 | 0 | 25-10 | 5.70 | 25 |
 Nate Pearson | 0.2 | 0 | 4 | 4 | 4 | 0 | 0 | 23-5 | 4.17 | 23 |
 Nolan Hoffman | 0.1 | 1 | 1 | 1 | 2 | 0 | 0 | 11-3 | 3.77 | 11 |
H2H / Season Series
KC9–12
CLE
CLE11–1
KC
CLE3–8
KC
CLE0–3
KC
KC5–8
CLE
KC1–3
CLE
KC5–3
CLE
KC6–2
CLE
CLE10–2
KC
CLE2–1
KC
Last 5 Games
| Date | Opponent | Result |
|---|---|---|
| Sep 25 | @ KC | W12–9 |
| Sep 24 |  @ BOS | W1–0 |
| Sep 23 | @ BOS | L0–1 |
| Sep 22 | @ BOS | W3–2 |
| Sep 20 |  vs ATH | W1–0 |
| Date | Opponent | Result |
|---|---|---|
| Sep 25 | vs CLE | L9–12 |
| Sep 24 |  vs CHW | L1–9 |
| Sep 23 | vs CHW | W5–4 |
| Sep 22 | vs CHW | L11–14 |
| Sep 20 |  @ PIT | L3–4 |
Standings
American League
| Team | W | L | PCT | GB | DIFF | STRK |
|---|---|---|---|---|---|---|
1 Rays | 97 | 63 | .606 | - | +79 | W1 |
| 2Guardians | 84 | 76 | .525 | 13 | +6 | W2 |
3 Astros | 79 | 81 | .494 | 18 | -52 | L1 |
4 Yankees | 93 | 68 | .578 | 4.5 | +138 | W1 |
| 5Red Sox | 87 | 74 | .540 | 10.5 | +82 | W2 |
| 6White Sox | 83 | 77 | .519 | 14 | +57 | W2 |
7 Rangers | 79 | 81 | .494 | 18 | -48 | L1 |
8 Orioles | 79 | 82 | .491 | 18.5 | -21 | L1 |
9 Blue Jays | 78 | 82 | .488 | 19 | -46 | W1 |
10 Twins | 76 | 84 | .475 | 21 | -56 | W3 |
11 Tigers | 75 | 85 | .469 | 22 | +72 | W1 |
12 Mariners | 74 | 86 | .463 | 23 | -66 | L2 |
| 13Royals | 68 | 92 | .425 | 29 | -115 | L2 |
| 14Athletics | 64 | 96 | .400 | 33 | -218 | W1 |
15 Angels | 62 | 98 | .388 | 35 | -89 | W2 |
National League
| Team | W | L | PCT | GB | DIFF | STRK |
|---|---|---|---|---|---|---|
1 Brewers | 101 | 59 | .631 | - | +211 | W3 |
2 Dodgers | 98 | 62 | .613 | 3 | +196 | W1 |
3 Braves | 93 | 67 | .581 | 8 | +113 | L2 |
4 Padres | 89 | 71 | .556 | 12 | +33 | L1 |
5 Cubs | 88 | 73 | .547 | 13.5 | +143 | L2 |
6 Phillies | 87 | 73 | .544 | 14 | +22 | L3 |
7 Diamondbacks | 86 | 74 | .538 | 15 | +17 | W6 |
| 8Pirates | 81 | 79 | .506 | 20 | +27 | L1 |
9 Marlins | 79 | 81 | .494 | 22 | +6 | W1 |
10 Cardinals | 77 | 83 | .481 | 24 | -26 | L2 |
11 Nationals | 76 | 84 | .475 | 25 | +10 | W3 |
12 Reds | 74 | 86 | .463 | 27 | -160 | L1 |
13 Mets | 73 | 87 | .456 | 28 | -36 | L2 |
14 Giants | 65 | 95 | .406 | 36 | -86 | L3 |
15 Rockies | 57 | 103 | .356 | 44 | -193 | L5 |
CLE
VS
KC
Pitchers
Gavin Williams
Catchers
Austin Hedges
Infielders
Jose Ramirez
David Fry
Travis Bazzana
Brayan Rocchio
Outfielders
Steven Kwan
Jo Adell
Angel Martinez
Designated Hitters
Chase DeLauter
Pitchers
Noah Cameron
Catchers
Carter Jensen
Infielders
Bobby Witt Jr.
Maikel Garcia
Vinnie Pasquantino
Michael Massey
Outfielders
Jac Caglianone
John Rave
Kyle Isbel
Designated Hitters
Salvador Perez
Guardians
VS
Royals
Batting
160
Team Games Played
160
5337
At Bats
5371
1268
Hits
1326
637
Runs Batted In
649
155
Home Runs
168
144
Stolen Bases
129
.238
Batting Average
.247
665
Runs
682
247
Doubles
286
14
Triples
19
2008
Total Bases
2154
569
Walks
508
1262
Strikeouts
1258
.315
On Base Percentage
.316
.376
Slugging Percentage
.401
.692
OBP Pct + SLG Pct
.717
160
Games Played
160
160
Games Started
160
58
Hit By Pitch
56
0.0
Wins Above Replacement
0.0
0.0
Offensive Wins Above Replacement
0.0
30
Caught Stealing
32
1
Is Qualified
1
663.7
Runs Created
698.5
4.2
Runs Created Per 27 Outs
4.4
.094
Walks Per Plate Appearance
.085
0.45
Walk To Strikeout Ratio
0.40
.139
Isolated Power
.154
.267
Secondary Average
.267
3.94
Pitches Per Plate Appearance
3.81
416
Extra Base Hits
473
6037
Plate Appearances
6011
34.4
At Bats Per Home Run
32.0
28
Sacrifice Hit
28
43
Sacrifice Flies
46
Pitching
160
Team Games Played
160
58
Quality Starts
61
84
Wins
68
76
Losses
92
46
Saves
37
116
Holds
83
1267
Hits
1401
594
Earned runs
746
173
Home Runs
203
526
Walks
577
1516
Strikeouts
1164
9.6
Strikeouts Per 9 Innings
7.4
148.4
Pitches Per Start
147.2
1.26
Walks Plus Hits Per Inning Pitched
1.41
3.76
Earned Run Average
4.77
76
Losses
92
1420.2
Innings pitched
1406.1
.525
Win Percentage
.425
64
Save Opportunities
63
.237
Opponent Batting Average
.260
.312
Opponent's On-base pct.
.338
.386
Opponent's Slugging pct.
.436
.698
Opponent's OPB Pct + SLG Pct
.773
5347
At Bats
5383
244
Doubles
291
17
Triples
22
73
Batters Hit
71
104
Stolen Bases
73
160
Games Played
160
0
Complete Games
2
6
Shutouts
8
56
Wild Pitches
52
627
Runs Batted In
763
2
Balks
3
1420.2
Innings pitched
1406.1
9.6
Strikeouts Per 9 Innings
7.4
22
Caught Stealing
35
160
Games Started
160
0.0
Wins Above Replacement
0.0
1
Is Qualified
1
659
Runs
797
594
Earned Runs
746
2064
Total Bases
2345
Fielding
160
Team Games Played
160
1421
Full Innings
1406
5591
Total Chances
5740
4262
Putouts
4219
1244
Assists
1447
85
Errors
74
247
Double Plays
286
0.985
Fielding Percentage
0.987
34.9
Range Factor
36.3
0.0
Zone Rating
0.0
160
Games Played
160
0
Games Started
0
0.0
Defensive Wins Above Replacement
0.0
1
Qualified
1