

Guardians vs Royals Live Score (27 Sep, 2026)
Game Information
Stage
STD
Season
2026
First Pitch
Sun, Sep 27, 3:10 pm
Venue
Kauffman Stadium
Location
Kansas City, Missouri
Venue Type
Outdoor
Broadcast
ESPN Unlmtd
Attendance
22,827
Live Situation
2Balls
2Strikes
0Outs
—Pitcher
—At Bat
Pitch Sequence
1
STRIKE FOUL
Sinker
99 MPH
2
STRIKE SWINGING
Changeup
91 MPH
3
BALL
Four-seam FB
99 MPH
4
STRIKE FOUL
Changeup
92 MPH
5
BALL
Slider
87 MPH
6
STRIKE FOUL
Slider
86 MPH
7
BALL IN PLAY
Four-seam FB
99 MPH
Injury Report

Team Stats
 CLE
KC


2
Runs
3
9
Hits
9
0
Errors
2
2
Home Runs
2
1
Walks
3
5
Strikeouts
7
Player Box Score
Cleveland Guardians
| Player | H-AB | AB | R | H | RBI | HR | BB | K | #P | AVG | OBP | SLG |
|---|---|---|---|---|---|---|---|---|---|---|---|---|
 Angel Martinez | 0-4 | 4 | 0 | 0 | 0 | 0 | 0 | 1 | 11 | .254 | .290 | .465 |
 Travis Bazzana | 0-4 | 4 | 0 | 0 | 0 | 0 | 0 | 0 | 24 | .245 | .335 | .408 |
 Jo Adell | 2-3 | 3 | 1 | 2 | 1 | 1 | 1 | 0 | 14 | .240 | .298 | .401 |
 Nathaniel Lowe | 1-4 | 4 | 0 | 1 | 0 | 0 | 0 | 0 | 12 | .252 | .317 | .444 |
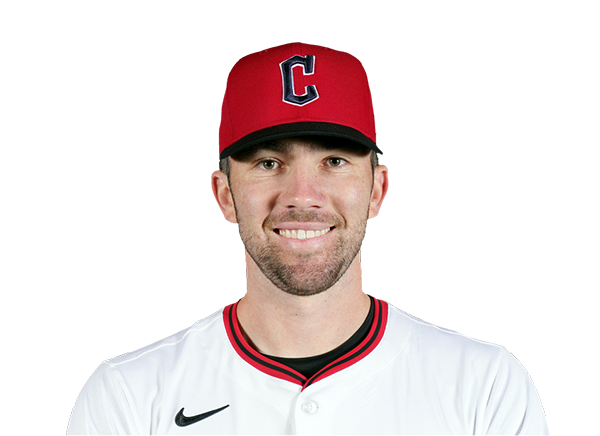 David Fry | 2-4 | 4 | 0 | 2 | 0 | 0 | 0 | 1 | 12 | .201 | .313 | .364 |
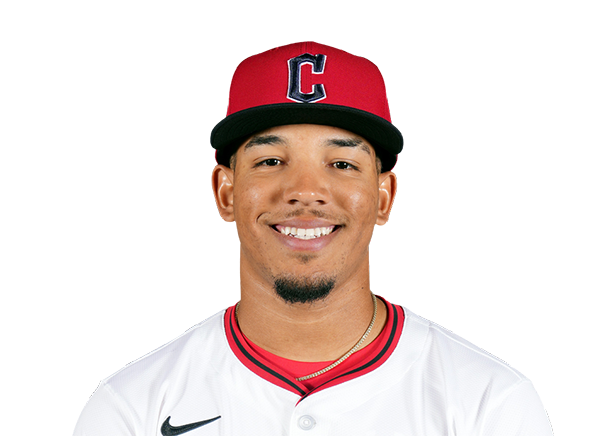 Angel Genao | 1-4 | 4 | 0 | 1 | 0 | 0 | 0 | 0 | 8 | .213 | .281 | .291 |
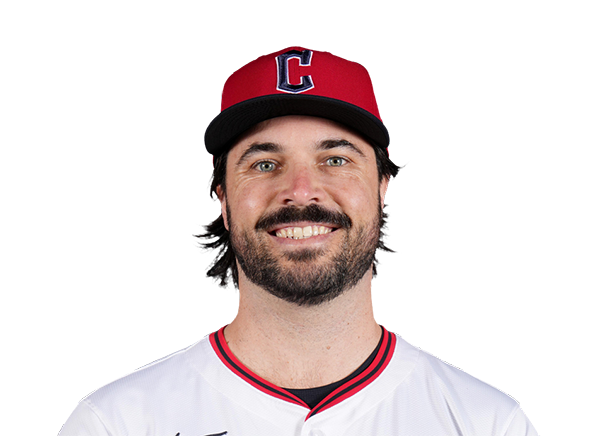 Austin Hedges | 0-2 | 2 | 0 | 0 | 0 | 0 | 0 | 1 | 8 | .247 | .325 | .377 |
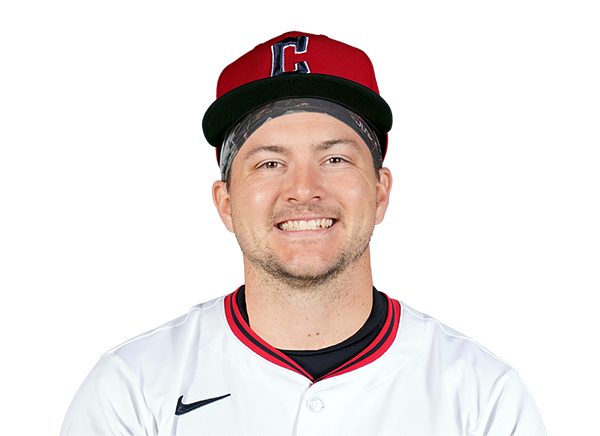 Patrick Bailey | 0-2 | 2 | 0 | 0 | 0 | 0 | 0 | 2 | 8 | .206 | .272 | .335 |
 Daniel Schneemann | 2-4 | 4 | 1 | 2 | 1 | 1 | 0 | 0 | 10 | .210 | .276 | .332 |
 Petey Halpin | 1-4 | 4 | 0 | 1 | 0 | 0 | 0 | 0 | 13 | .225 | .268 | .326 |
Kansas City Royals
| Player | H-AB | AB | R | H | RBI | HR | BB | K | #P | AVG | OBP | SLG |
|---|---|---|---|---|---|---|---|---|---|---|---|---|
 Maikel Garcia | 1-2 | 2 | 1 | 1 | 0 | 0 | 2 | 0 | 18 | .268 | .334 | .381 |
 Bobby Witt Jr. | 0-4 | 4 | 0 | 0 | 0 | 0 | 0 | 1 | 15 | .281 | .359 | .441 |
 Jac Caglianone | 2-4 | 4 | 0 | 2 | 0 | 0 | 0 | 1 | 17 | .289 | .340 | .494 |
 Salvador Perez | 1-3 | 3 | 0 | 1 | 1 | 0 | 0 | 0 | 8 | .229 | .274 | .383 |
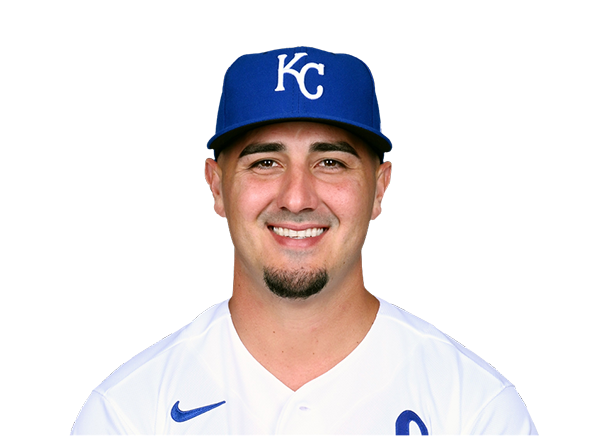 Josh Rojas | 0-1 | 1 | 0 | 0 | 0 | 0 | 0 | 1 | 6 | .226 | .265 | .321 |
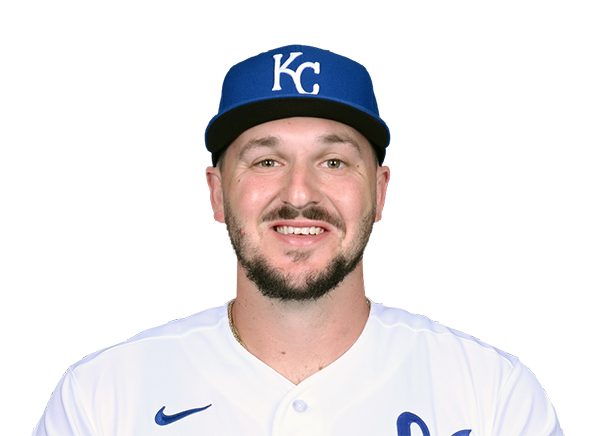 Vinnie Pasquantino | 2-4 | 4 | 2 | 2 | 2 | 2 | 0 | 1 | 14 | .249 | .333 | .428 |
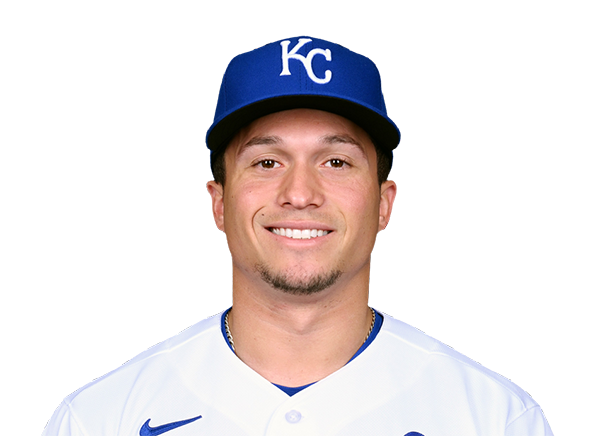 Isaac Collins | 1-3 | 3 | 0 | 1 | 0 | 0 | 1 | 0 | 24 | .213 | .320 | .321 |
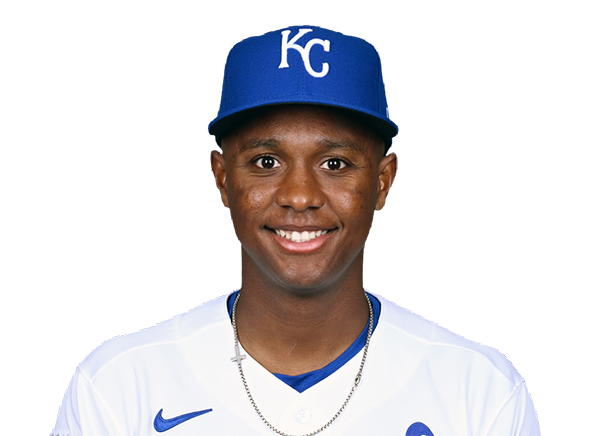 Tyler Tolbert | 0-4 | 4 | 0 | 0 | 0 | 0 | 0 | 2 | 11 | .285 | .347 | .392 |
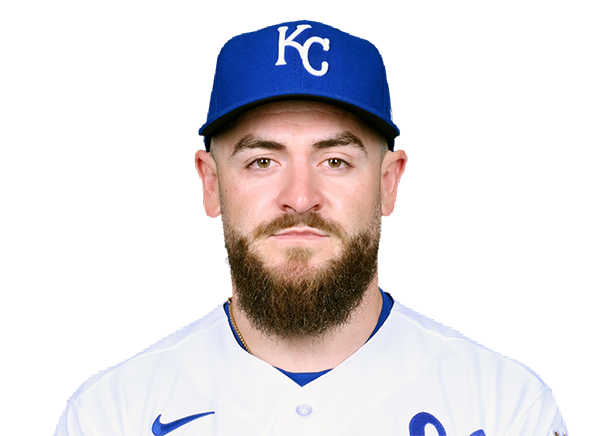 Kyle Isbel | 2-4 | 4 | 0 | 2 | 0 | 0 | 0 | 1 | 13 | .224 | .268 | .323 |
 Luke Maile | 0-3 | 3 | 0 | 0 | 0 | 0 | 0 | 0 | 12 | .159 | .229 | .273 |
Cleveland Guardians
| Player | IP | H | R | ER | BB | K | HR | PC-ST | ERA | PC |
|---|---|---|---|---|---|---|---|---|---|---|
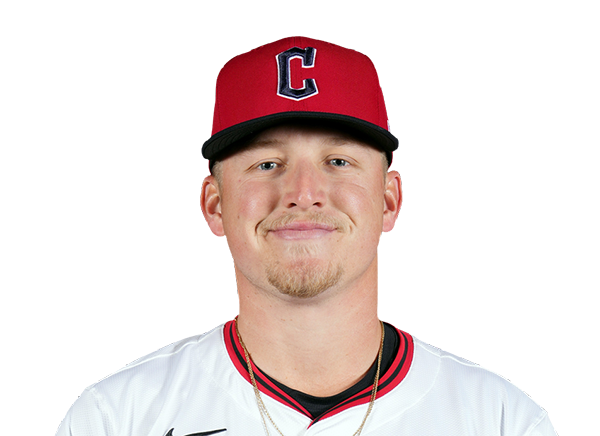 Parker Messick | 3.0 | 6 | 1 | 1 | 1 | 2 | 0 | 64-42 | 2.56 | 64 |
 Austin Peterson | 5.0 | 3 | 2 | 2 | 2 | 5 | 2 | 74-45 | 2.57 | 74 |
Kansas City Royals
| Player | IP | H | R | ER | BB | K | HR | PC-ST | ERA | PC |
|---|---|---|---|---|---|---|---|---|---|---|
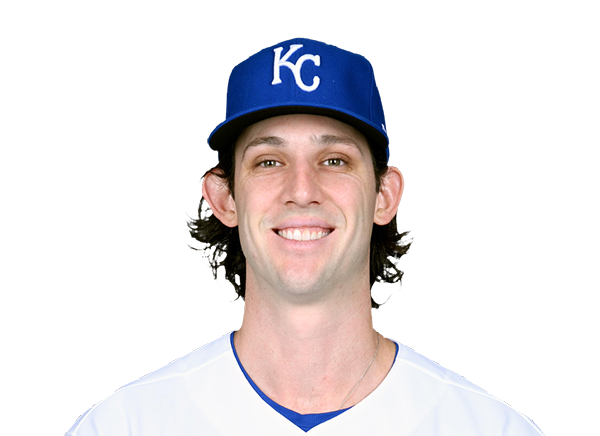 Daniel Lynch IV | 5.1 | 7 | 2 | 2 | 0 | 2 | 2 | 76-53 | 4.08 | 76 |
 Nolan Hoffman | 0.2 | 1 | 0 | 0 | 0 | 1 | 0 | 7-5 | 3.60 | 7 |
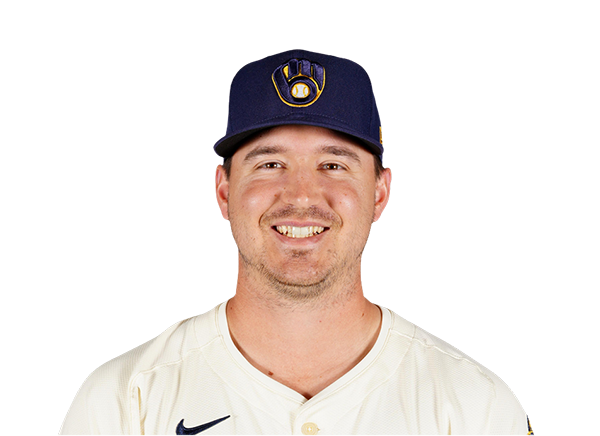 Connor Thomas | 1.1 | 0 | 0 | 0 | 0 | 1 | 0 | 11-10 | 7.01 | 11 |
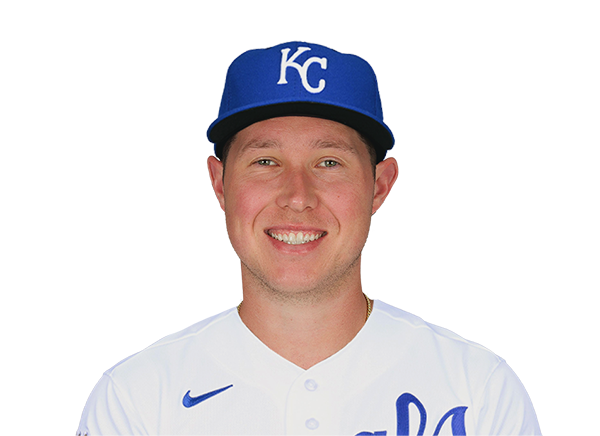 Nate Pearson | 0.2 | 0 | 0 | 0 | 1 | 0 | 0 | 9-5 | 4.11 | 9 |
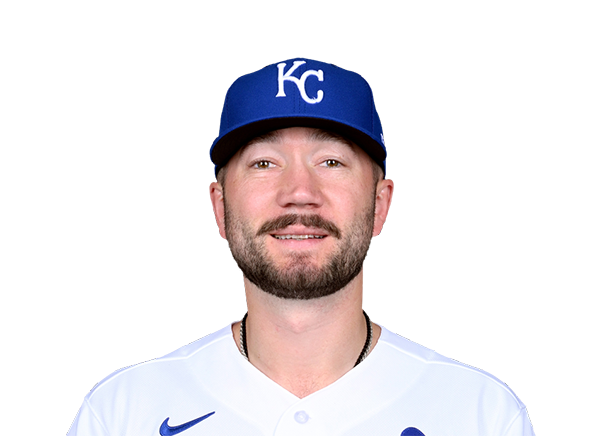 Lucas Erceg | 1.0 | 1 | 0 | 0 | 0 | 1 | 0 | 17-13 | 5.59 | 17 |
H2H / Season Series
KC3–2
CLE
KC5–11
CLE
KC9–12
CLE
CLE11–1
KC
CLE3–8
KC
CLE0–3
KC
KC5–8
CLE
KC1–3
CLE
KC5–3
CLE
KC6–2
CLE
Last 5 Games
| Date | Opponent | Result |
|---|---|---|
| Sep 27 | @ KC | L2–3 |
| Sep 26 | @ KC | W11–5 |
| Sep 25 | @ KC | W12–9 |
| Sep 24 |  @ BOS | W1–0 |
| Sep 23 | @ BOS | L0–1 |
| Date | Opponent | Result |
|---|---|---|
| Sep 27 | vs CLE | W3–2 |
| Sep 26 | vs CLE | L5–11 |
| Sep 25 | vs CLE | L9–12 |
| Sep 24 |  vs CHW | L1–9 |
| Sep 23 | vs CHW | W5–4 |
Standings
American League
| Team | W | L | PCT | GB | DIFF | STRK |
|---|---|---|---|---|---|---|
1 Rays | 98 | 64 | .605 | - | +86 | L1 |
| 2Guardians | 85 | 77 | .525 | 13 | +11 | L1 |
3 Astros | 81 | 81 | .500 | 17 | -32 | W2 |
4 Yankees | 93 | 68 | .578 | 4.5 | +138 | W1 |
| 5Red Sox | 87 | 75 | .537 | 11 | +78 | L1 |
| 6White Sox | 84 | 78 | .519 | 14 | +56 | W1 |
7 Rangers | 80 | 82 | .494 | 18 | -46 | L1 |
8 Orioles | 79 | 82 | .491 | 18.5 | -21 | L1 |
9 Blue Jays | 79 | 83 | .488 | 19 | -46 | W1 |
10 Twins | 77 | 85 | .475 | 21 | -58 | W1 |
11 Tigers | 76 | 86 | .469 | 22 | +71 | L1 |
12 Mariners | 76 | 86 | .469 | 22 | -58 | W2 |
| 13Royals | 69 | 93 | .426 | 29 | -120 | W1 |
14 Athletics | 64 | 98 | .395 | 34 | -238 | L2 |
15 Angels | 62 | 100 | .383 | 36 | -97 | L2 |
National League
| Team | W | L | PCT | GB | DIFF | STRK |
|---|---|---|---|---|---|---|
1 Brewers | 103 | 59 | .636 | - | +214 | W5 |
2 Dodgers | 100 | 62 | .617 | 3 | +201 | W3 |
3 Braves | 94 | 68 | .580 | 9 | +116 | L1 |
4 Padres | 91 | 71 | .562 | 12 | +41 | W2 |
5 Cubs | 89 | 73 | .549 | 14 | +147 | W1 |
6 Phillies | 88 | 74 | .543 | 15 | +15 | W1 |
7 Diamondbacks | 86 | 76 | .531 | 17 | +9 | L2 |
8 Pirates | 82 | 80 | .506 | 21 | +28 | W1 |
9 Marlins | 80 | 82 | .494 | 23 | +3 | W1 |
10 Cardinals | 77 | 85 | .475 | 26 | -29 | L4 |
11 Nationals | 77 | 85 | .475 | 26 | +6 | W1 |
12 Reds | 75 | 87 | .463 | 28 | -160 | L1 |
13 Mets | 74 | 88 | .457 | 29 | -32 | L1 |
14 Giants | 65 | 97 | .401 | 38 | -91 | L5 |
15 Rockies | 58 | 104 | .358 | 45 | -192 | L1 |
CLE
VS
KC
Pitchers
Parker Messick
Catchers
David Fry
Infielders
Travis Bazzana
Nathaniel Lowe
Angel Genao
Daniel Schneemann
Outfielders
Angel Martinez
Jo Adell
Petey Halpin
Designated Hitters
Austin Hedges
Pitchers
Daniel Lynch IV
Catchers
Luke Maile
Infielders
Maikel Garcia
Bobby Witt Jr.
Vinnie Pasquantino
Tyler Tolbert
Outfielders
Jac Caglianone
Isaac Collins
Kyle Isbel
Designated Hitters
Salvador Perez
Guardians
VS
Royals
Batting
162
Team Games Played
162
5410
At Bats
5438
1291
Hits
1345
650
Runs Batted In
656
162
Home Runs
170
146
Stolen Bases
130
.239
Batting Average
.247
678
Runs
690
249
Doubles
293
16
Triples
19
2058
Total Bases
2186
574
Walks
512
1271
Strikeouts
1272
.316
On Base Percentage
.316
.380
Slugging Percentage
.402
.696
OBP Pct + SLG Pct
.718
162
Games Played
162
162
Games Started
162
58
Hit By Pitch
57
0.0
Wins Above Replacement
0.0
0.0
Offensive Wins Above Replacement
0.0
31
Caught Stealing
32
1
Is Qualified
1
679.7
Runs Created
708.7
4.2
Runs Created Per 27 Outs
4.4
.094
Walks Per Plate Appearance
.084
0.45
Walk To Strikeout Ratio
0.40
.142
Isolated Power
.155
.269
Secondary Average
.267
3.93
Pitches Per Plate Appearance
3.81
427
Extra Base Hits
482
6117
Plate Appearances
6083
33.4
At Bats Per Home Run
32.0
28
Sacrifice Hit
28
45
Sacrifice Flies
46
Pitching
162
Team Games Played
162
59
Quality Starts
62
85
Wins
69
77
Losses
93
46
Saves
38
117
Holds
83
1286
Hits
1424
602
Earned runs
755
175
Home Runs
210
530
Walks
582
1530
Strikeouts
1173
9.6
Strikeouts Per 9 Innings
7.4
148.2
Pitches Per Start
147.1
1.26
Walks Plus Hits Per Inning Pitched
1.41
3.77
Earned Run Average
4.77
77
Losses
93
1437.2
Innings pitched
1424.1
.525
Win Percentage
.426
64
Save Opportunities
64
.238
Opponent Batting Average
.261
.312
Opponent's On-base pct.
.338
.387
Opponent's Slugging pct.
.439
.699
Opponent's OPB Pct + SLG Pct
.777
5414
At Bats
5456
251
Doubles
293
17
Triples
24
74
Batters Hit
71
105
Stolen Bases
75
162
Games Played
162
0
Complete Games
2
6
Shutouts
8
57
Wild Pitches
52
634
Runs Batted In
776
2
Balks
3
1437.2
Innings pitched
1424.1
9.6
Strikeouts Per 9 Innings
7.4
22
Caught Stealing
36
162
Games Started
162
0.0
Wins Above Replacement
0.0
1
Is Qualified
1
667
Runs
810
602
Earned Runs
755
2096
Total Bases
2395
Fielding
162
Team Games Played
162
1438
Full Innings
1424
5661
Total Chances
5817
4313
Putouts
4273
1262
Assists
1466
86
Errors
78
249
Double Plays
293
0.985
Fielding Percentage
0.987
34.9
Range Factor
36.3
0.0
Zone Rating
0.0
162
Games Played
162
0
Games Started
0
0.0
Defensive Wins Above Replacement
0.0
1
Qualified
1