

Guardians vs Tigers Live Score (11 Aug, 2026)
Game Information
Stage
Standard
Season
2026
First Pitch
Tue, Aug 11, 6:40 pm
Venue
Comerica Park
Location
Detroit, Michigan
Attendance
30,709
Home Runs
Rhys Hoskins
13 HR
.182 AVG
38 RBI

Dillon Dingler
26 HR
.272 AVG
80 RBI

Batting Average
Chase DeLauter
.277 AVG
.354 OBP
.433 SLG

Kevin McGonigle
.286 AVG
.390 OBP
.428 SLG

Runs Batted In
Chase DeLauter
56 RBI
12 HR
.277 AVG
Dillon Dingler
80 RBI
26 HR
.272 AVG
Earned Run Average
Parker Messick
2.57 ERA
9 W
136 K

Keider Montero
3.38 ERA
8 W
86 K
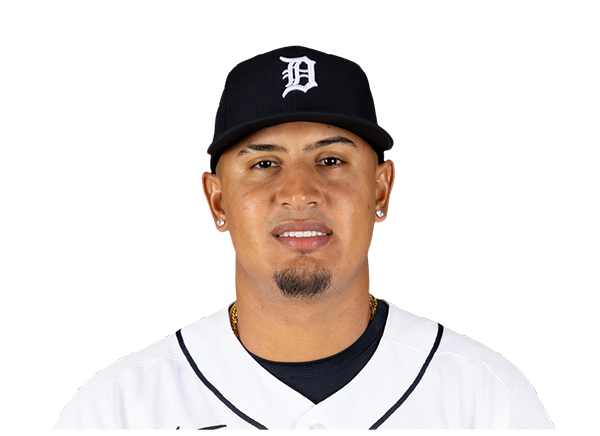
Wins
Gavin Williams
11 W
3.55 ERA
185 K

Keider Montero
8 W
3.38 ERA
86 K
Strikeouts
Gavin Williams
185 K
11 W
3.55 ERA
Framber Valdez
103 K
7 W
4.17 ERA
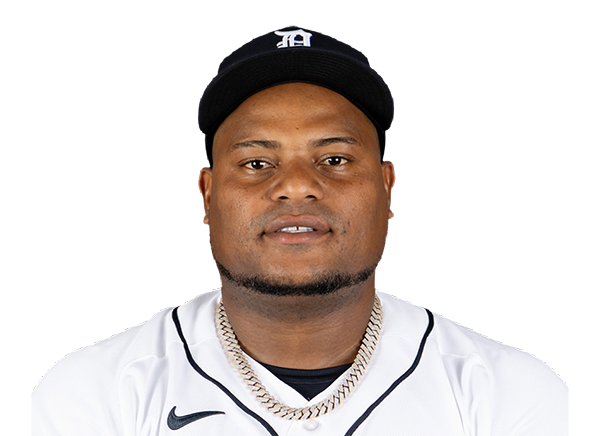
Injury Report




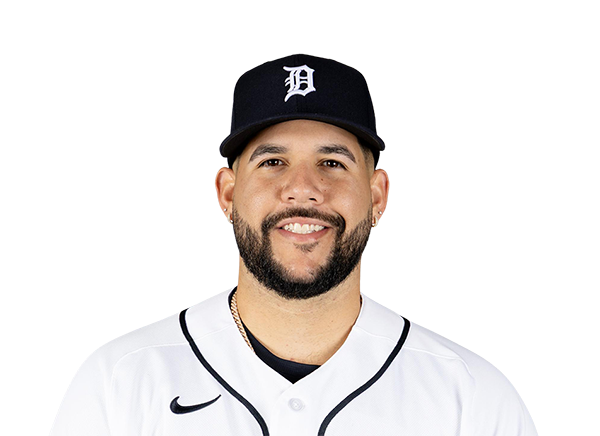

Team Stats
 CLE
DET


Array
Runs
Array
9
Hits
6
1
Errors
0
—
Home Runs
—
—
Walks
—
—
Strikeouts
—
Standings
American League
| Team | W | L | PCT | GB | DIFF | STRK |
|---|---|---|---|---|---|---|
1 Rays | 76 | 53 | .589 | - | +42 | L3 |
2 White Sox | 67 | 62 | .519 | 9 | +42 | L1 |
3 Astros | 65 | 65 | .500 | 11.5 | -43 | L1 |
4 Yankees | 73 | 56 | .566 | 3 | +95 | L1 |
5 Red Sox | 70 | 59 | .543 | 6 | +98 | W2 |
6 Rangers | 64 | 66 | .492 | 12.5 | -48 | L1 |
| 7Guardians | 64 | 66 | .492 | 12.5 | -14 | W3 |
8 Blue Jays | 64 | 67 | .489 | 13 | -50 | W1 |
9 Twins | 63 | 67 | .485 | 13.5 | -47 | L2 |
10 Orioles | 63 | 67 | .485 | 13.5 | -33 | W2 |
11 Mariners | 62 | 68 | .477 | 14.5 | -44 | W2 |
| 12Tigers | 61 | 68 | .473 | 15 | +77 | L4 |
13 Royals | 57 | 74 | .435 | 20 | -95 | W7 |
14 Angels | 52 | 78 | .400 | 24.5 | -68 | W1 |
15 Athletics | 50 | 80 | .385 | 26.5 | -188 | W1 |
National League
| Team | W | L | PCT | GB | DIFF | STRK |
|---|---|---|---|---|---|---|
1 Brewers | 81 | 49 | .623 | - | +163 | W3 |
2 Dodgers | 79 | 51 | .608 | 2 | +147 | W5 |
3 Braves | 75 | 55 | .577 | 6 | +108 | L2 |
4 Cubs | 74 | 56 | .569 | 7 | +98 | L3 |
5 Phillies | 72 | 58 | .554 | 9 | +25 | W8 |
6 Padres | 70 | 60 | .538 | 11 | +9 | W2 |
7 Diamondbacks | 68 | 62 | .523 | 13 | +7 | L1 |
8 Marlins | 66 | 64 | .508 | 15 | +17 | W2 |
9 Cardinals | 66 | 65 | .504 | 15.5 | 0 | L2 |
10 Pirates | 63 | 68 | .481 | 18.5 | +29 | L2 |
11 Reds | 62 | 68 | .477 | 19 | -92 | W1 |
12 Nationals | 61 | 70 | .466 | 20.5 | +14 | L3 |
13 Mets | 59 | 71 | .454 | 22 | -39 | W1 |
14 Giants | 52 | 77 | .403 | 28.5 | -79 | L3 |
15 Rockies | 50 | 79 | .388 | 30.5 | -131 | L5 |
CLE
VS
DET
Pitchers

Tanner Bibee
Catchers

Patrick Bailey
Infielders
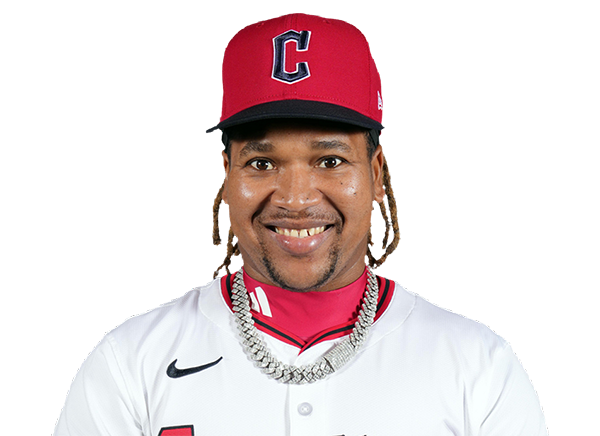
Jose Ramirez

Nathaniel Lowe

Travis Bazzana

Brayan Rocchio
Outfielders

Steven Kwan
Chase DeLauter

Angel Martinez
Designated Hitters

Jo Adell
Pitchers

Drew Anderson
Catchers
Dillon Dingler
Infielders
Kevin McGonigle
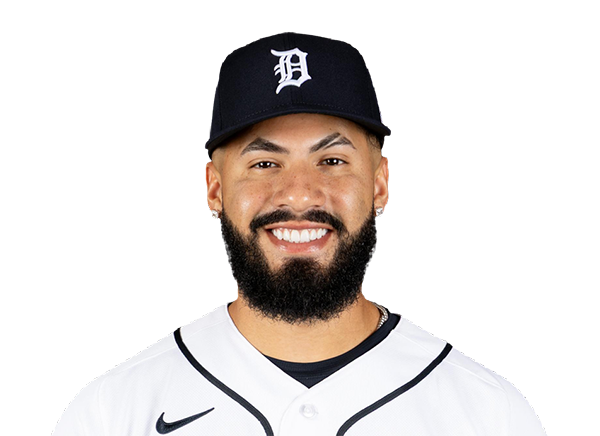
Gleyber Torres

Spencer Torkelson
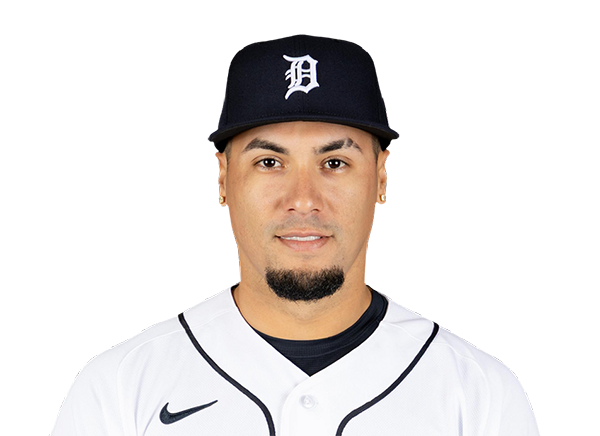
Javier Baez
Outfielders
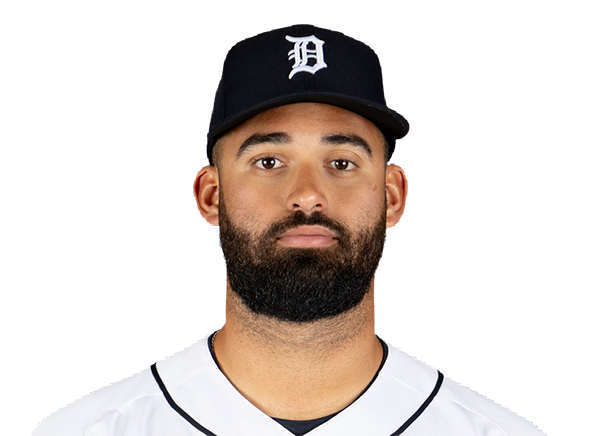
Riley Greene

Max Clark

Zach McKinstry
Designated Hitters

Colt Keith
Guardians
VS
Tigers
Batting
120
Team Games Played
119
3979
At Bats
4018
926
Hits
978
458
Runs Batted In
519
116
Home Runs
144
117
Stolen Bases
35
.233
Batting Average
.243
477
Runs
545
174
Doubles
181
11
Triples
24
1470
Total Bases
1639
440
Walks
426
995
Strikeouts
1024
.313
On Base Percentage
.320
.369
Slugging Percentage
.408
.683
OBP Pct + SLG Pct
.728
120
Games Played
119
120
Games Started
119
41
Hit By Pitch
45
0.0
Wins Above Replacement
0.0
0.0
Offensive Wins Above Replacement
0.0
23
Caught Stealing
18
1
Is Qualified
1
487.8
Runs Created
533.6
4.1
Runs Created Per 27 Outs
4.5
.097
Walks Per Plate Appearance
.094
0.44
Walk To Strikeout Ratio
0.42
.137
Isolated Power
.165
.271
Secondary Average
.275
3.97
Pitches Per Plate Appearance
3.93
301
Extra Base Hits
349
4516
Plate Appearances
4536
34.3
At Bats Per Home Run
27.9
23
Sacrifice Hit
6
31
Sacrifice Flies
36
Pitching
120
Team Games Played
119
41
Quality Starts
47
58
Wins
59
62
Losses
60
34
Saves
24
88
Holds
54
959
Hits
905
455
Earned runs
408
137
Home Runs
115
395
Walks
362
1112
Strikeouts
989
9.4
Strikeouts Per 9 Innings
8.4
147.7
Pitches Per Start
141.6
1.27
Walks Plus Hits Per Inning Pitched
1.20
3.85
Earned Run Average
3.48
62
Losses
60
1062.2
Innings pitched
1054.2
.483
Win Percentage
.496
48
Save Opportunities
50
.239
Opponent Batting Average
.230
.312
Opponent's On-base pct.
.301
.395
Opponent's Slugging pct.
.370
.707
Opponent's OPB Pct + SLG Pct
.671
4011
At Bats
3939
185
Doubles
173
15
Triples
17
45
Batters Hit
50
86
Stolen Bases
68
120
Games Played
119
0
Complete Games
0
4
Shutouts
13
44
Wild Pitches
26
483
Runs Batted In
436
2
Balks
3
1062.2
Innings pitched
1054.2
9.4
Strikeouts Per 9 Innings
8.4
16
Caught Stealing
24
120
Games Started
119
0.0
Wins Above Replacement
0.0
1
Is Qualified
1
506
Runs
456
455
Earned Runs
408
1585
Total Bases
1457
Fielding
120
Team Games Played
119
1063
Full Innings
1055
4189
Total Chances
4254
3188
Putouts
3164
935
Assists
1038
66
Errors
52
174
Double Plays
181
0.984
Fielding Percentage
0.988
34.9
Range Factor
35.9
0.0
Zone Rating
0.0
120
Games Played
119
0
Games Started
0
0.0
Defensive Wins Above Replacement
0.0
1
Qualified
1