

Guardians vs Twins Live Score (13 Sep, 2026)
Game Information
Stage
STD
Season
2026
First Pitch
Sun, Sep 13, 2:10 pm
Venue
Target Field
Location
Minneapolis, Minnesota
Venue Type
Outdoor
Broadcast
MLB.TV
Attendance
17,676
Live Situation
3Balls
3Strikes
0Outs
—Pitcher
—At Bat
Pitch Sequence
1
BALL
Sweeper
85 MPH
2
STRIKE LOOKING
Sweeper
85 MPH
3
STRIKE LOOKING
Four-seam FB
91 MPH
4
BALL
Sweeper
85 MPH
5
BALL
Sweeper
83 MPH
6
STRIKE FOUL
Sweeper
84 MPH
7
STRIKE LOOKING
Four-seam FB
91 MPH
Injury Report



Team Stats
 CLE
MIN


9
Runs
2
14
Hits
6
1
Errors
1
3
Home Runs
1
4
Walks
2
4
Strikeouts
11
Player Box Score
Cleveland Guardians
| Player | H-AB | AB | R | H | RBI | HR | BB | K | #P | AVG | OBP | SLG |
|---|---|---|---|---|---|---|---|---|---|---|---|---|
 Steven Kwan | 3-4 | 4 | 2 | 3 | 2 | 1 | 1 | 0 | 16 | .278 | .375 | .346 |
 Chase DeLauter | 1-4 | 4 | 0 | 1 | 0 | 0 | 1 | 0 | 20 | .291 | .363 | .456 |
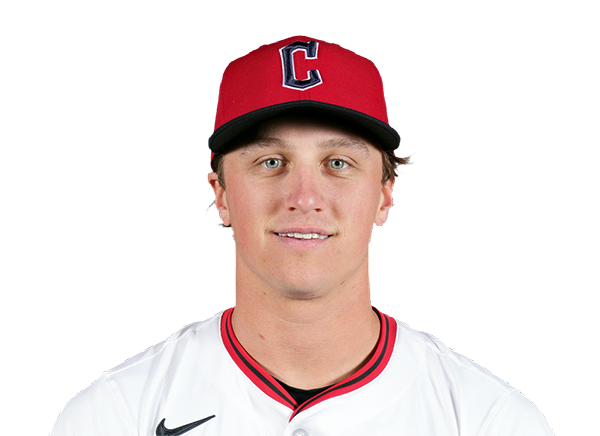 Petey Halpin | 0-0 | 0 | 1 | 0 | 0 | 0 | 0 | 0 | 0 | .215 | .256 | .310 |
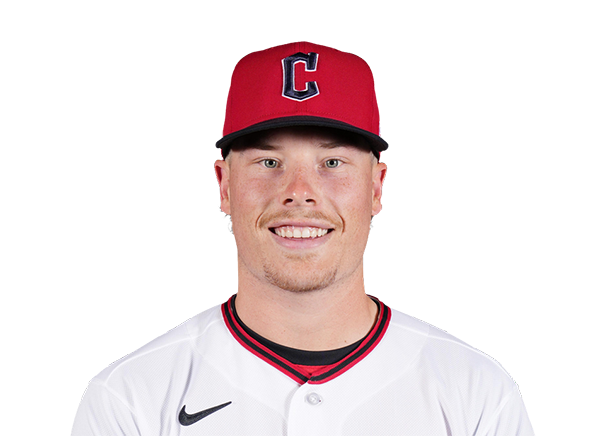 Travis Bazzana | 2-4 | 4 | 2 | 2 | 3 | 1 | 1 | 0 | 21 | .249 | .344 | .395 |
 Jo Adell | 2-5 | 5 | 2 | 2 | 2 | 1 | 0 | 0 | 12 | .239 | .294 | .400 |
 Nathaniel Lowe | 2-4 | 4 | 0 | 2 | 1 | 0 | 0 | 0 | 19 | .253 | .321 | .457 |
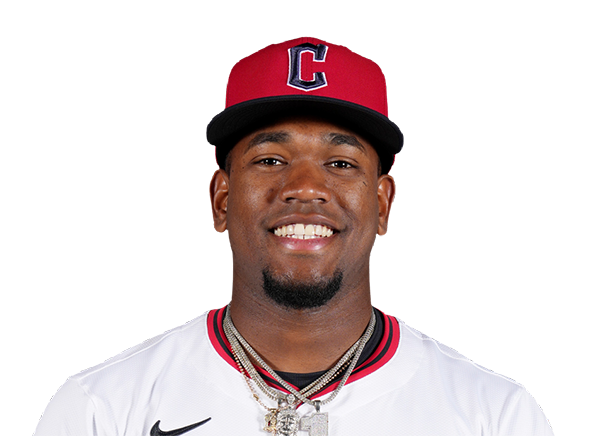 Angel Martinez | 2-5 | 5 | 0 | 2 | 1 | 0 | 0 | 1 | 15 | .250 | .287 | .447 |
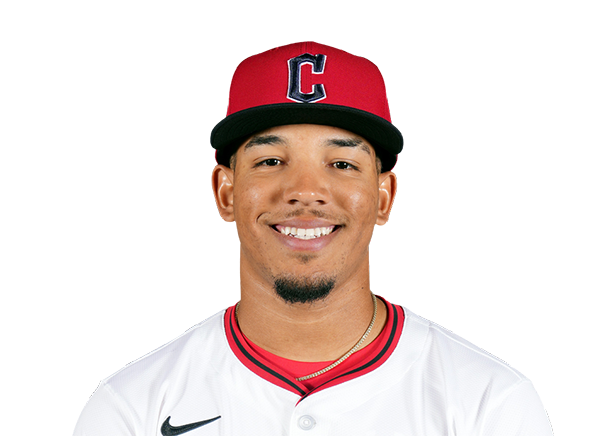 Angel Genao | 0-4 | 4 | 0 | 0 | 0 | 0 | 1 | 0 | 17 | .236 | .300 | .327 |
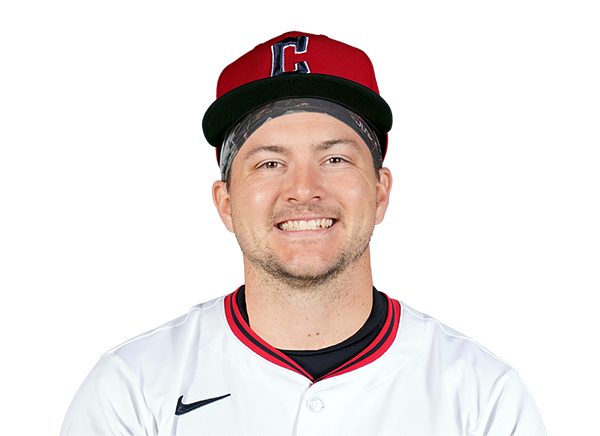 Patrick Bailey | 1-5 | 5 | 0 | 1 | 0 | 0 | 0 | 2 | 20 | .208 | .275 | .329 |
 Brayan Rocchio | 1-4 | 4 | 2 | 1 | 0 | 0 | 0 | 1 | 23 | .246 | .306 | .374 |
Minnesota Twins
| Player | H-AB | AB | R | H | RBI | HR | BB | K | #P | AVG | OBP | SLG |
|---|---|---|---|---|---|---|---|---|---|---|---|---|
 Luke Keaschall | 2-4 | 4 | 1 | 2 | 0 | 0 | 0 | 0 | 10 | .273 | .365 | .385 |
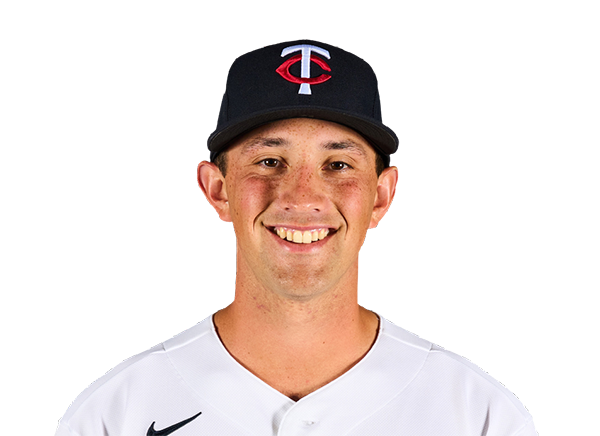 Brooks Lee | 0-4 | 4 | 0 | 0 | 0 | 0 | 0 | 2 | 12 | .247 | .296 | .430 |
 Kody Clemens | 1-3 | 3 | 0 | 1 | 1 | 0 | 1 | 1 | 12 | .243 | .305 | .474 |
 Ryan Jeffers | 0-4 | 4 | 0 | 0 | 0 | 0 | 0 | 2 | 19 | .266 | .366 | .490 |
 Trevor Larnach | 2-3 | 3 | 1 | 2 | 1 | 1 | 1 | 0 | 10 | .269 | .352 | .436 |
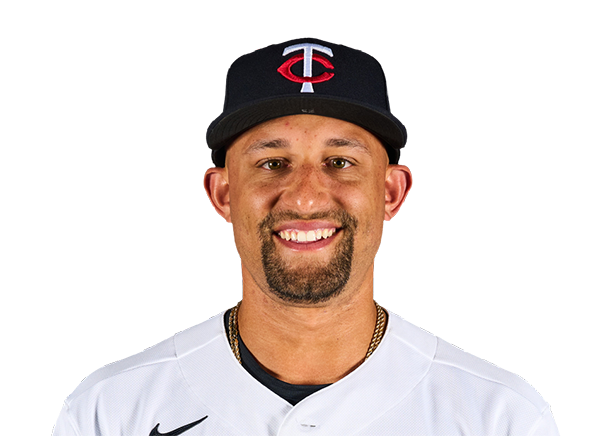 Royce Lewis | 0-2 | 2 | 0 | 0 | 0 | 0 | 0 | 0 | 9 | .230 | .297 | .391 |
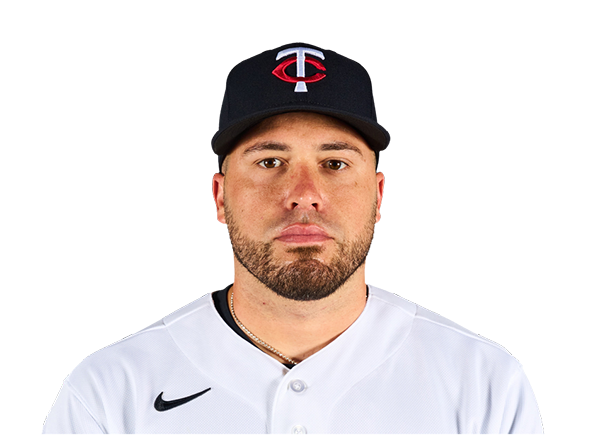 Victor Caratini | 0-2 | 2 | 0 | 0 | 0 | 0 | 0 | 0 | 12 | .219 | .314 | .319 |
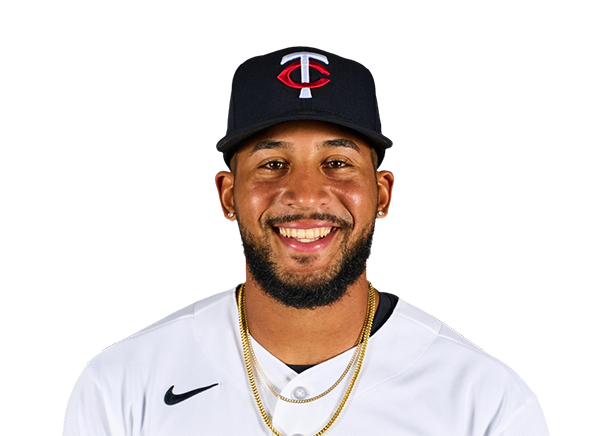 Emmanuel Rodriguez | 1-4 | 4 | 0 | 1 | 0 | 0 | 0 | 2 | 16 | .250 | .250 | .625 |
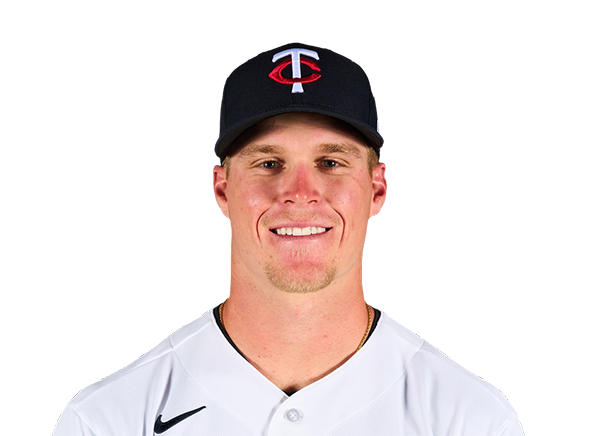 Walker Jenkins | 0-4 | 4 | 0 | 0 | 0 | 0 | 0 | 3 | 21 | .098 | .229 | .220 |
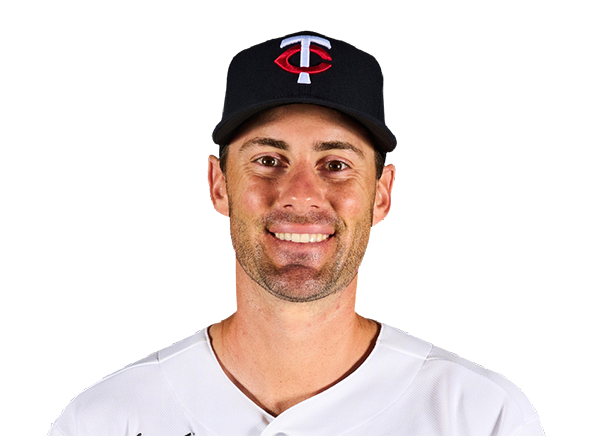 Ryan Kreidler | 0-3 | 3 | 0 | 0 | 0 | 0 | 0 | 1 | 9 | .217 | .279 | .367 |
Cleveland Guardians
| Player | IP | H | R | ER | BB | K | HR | PC-ST | ERA | PC |
|---|---|---|---|---|---|---|---|---|---|---|
 Tanner Bibee | 6.2 | 4 | 2 | 2 | 2 | 7 | 1 | 96-59 | 4.16 | 96 |
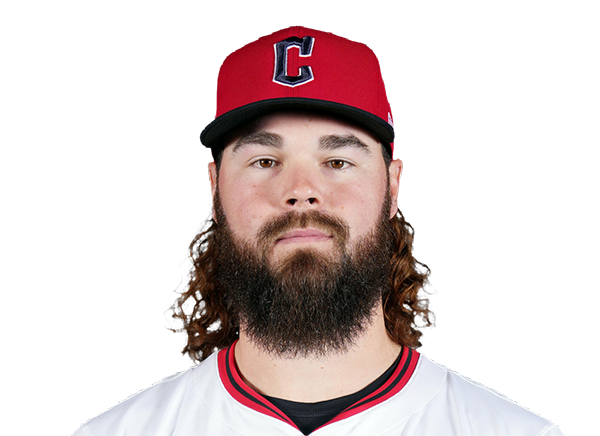 Hunter Gaddis | 0.2 | 1 | 0 | 0 | 0 | 1 | 0 | 8-7 | 2.68 | 8 |
 Erik Sabrowski | 0.2 | 0 | 0 | 0 | 0 | 1 | 0 | 5-4 | 2.89 | 5 |
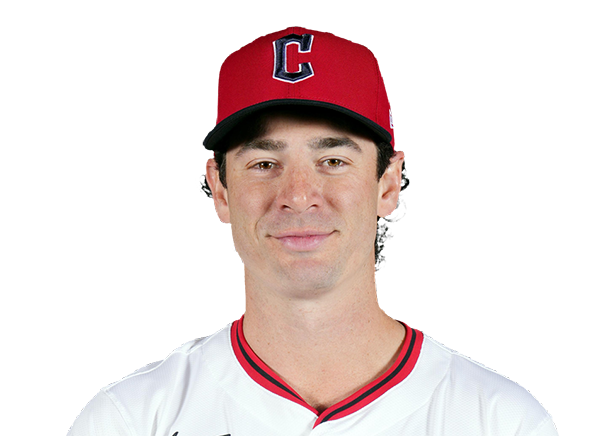 Matt Festa | 1.0 | 1 | 0 | 0 | 0 | 2 | 0 | 21-16 | 3.68 | 21 |
Minnesota Twins
| Player | IP | H | R | ER | BB | K | HR | PC-ST | ERA | PC |
|---|---|---|---|---|---|---|---|---|---|---|
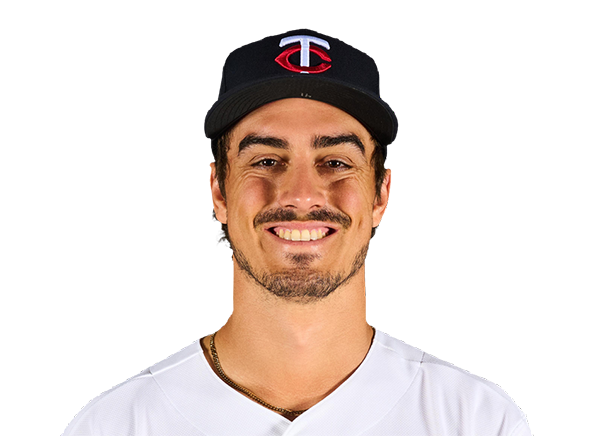 Joe Ryan | 4.0 | 7 | 4 | 4 | 1 | 1 | 2 | 84-51 | 3.84 | 84 |
 Travis Adams | 3.0 | 4 | 2 | 2 | 1 | 0 | 1 | 36-19 | 5.26 | 36 |
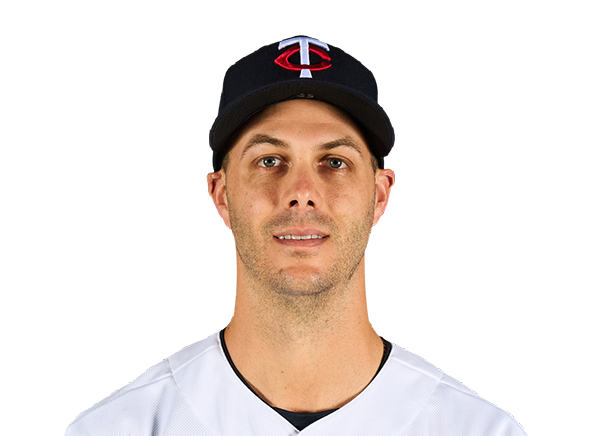 Taylor Rogers | 1.0 | 1 | 2 | 2 | 1 | 1 | 0 | 22-13 | 4.86 | 22 |
 Tommy Nance | 1.0 | 2 | 1 | 1 | 1 | 2 | 0 | 21-13 | 4.09 | 21 |
H2H / Season Series
MIN2–9
CLE
MIN4–3
CLE
MIN2–5
CLE
CLE1–3
MIN
CLE6–10
MIN
CLE5–2
MIN
CLE13–4
MIN
MIN2–5
CLE
MIN6–5
CLE
MIN3–1
CLE
Last 5 Games
| Date | Opponent | Result |
|---|---|---|
| Sep 13 | @ MIN | W9–2 |
| Sep 12 | @ MIN | L3–4 |
| Sep 11 | @ MIN | W5–2 |
| Sep 9 |  @ BAL | L5–9 |
| Sep 8 | @ BAL | W9–5 |
| Date | Opponent | Result |
|---|---|---|
| Sep 13 | vs CLE | L2–9 |
| Sep 12 | vs CLE | W4–3 |
| Sep 11 | vs CLE | L2–5 |
| Sep 9 |  @ DET | L2–7 |
| Sep 8 | @ DET | W3–2 |
Standings
American League
| Team | W | L | PCT | GB | DIFF | STRK |
|---|---|---|---|---|---|---|
1 Rays | 90 | 59 | .604 | - | +69 | W3 |
2 White Sox | 76 | 73 | .510 | 14 | +34 | L1 |
3 Astros | 75 | 75 | .500 | 15.5 | -53 | L3 |
4 Yankees | 86 | 63 | .577 | 4 | +125 | W1 |
5 Red Sox | 82 | 68 | .547 | 8.5 | +88 | W2 |
| 6Guardians | 76 | 74 | .507 | 14.5 | -7 | W1 |
7 Blue Jays | 75 | 75 | .500 | 15.5 | -31 | W2 |
8 Rangers | 74 | 76 | .493 | 16.5 | -44 | W2 |
| 9Orioles | 72 | 78 | .480 | 18.5 | -35 | L2 |
| 10Twins | 70 | 79 | .470 | 20 | -62 | L1 |
| 11Tigers | 70 | 79 | .470 | 20 | +70 | W4 |
12 Mariners | 70 | 80 | .467 | 20.5 | -58 | L1 |
13 Royals | 66 | 84 | .440 | 24.5 | -94 | L2 |
14 Athletics | 61 | 89 | .407 | 29.5 | -203 | W1 |
15 Angels | 56 | 93 | .376 | 34 | -76 | L3 |
National League
| Team | W | L | PCT | GB | DIFF | STRK |
|---|---|---|---|---|---|---|
1 Brewers | 93 | 57 | .620 | - | +195 | L1 |
2 Dodgers | 90 | 59 | .604 | 2.5 | +170 | L2 |
3 Braves | 88 | 62 | .587 | 5 | +116 | L1 |
4 Cubs | 83 | 67 | .553 | 10 | +138 | L1 |
5 Phillies | 83 | 67 | .553 | 10 | +31 | W1 |
6 Padres | 81 | 68 | .544 | 11.5 | +22 | W7 |
7 Diamondbacks | 79 | 71 | .527 | 14 | +2 | L2 |
8 Pirates | 75 | 75 | .500 | 18 | +26 | W1 |
9 Marlins | 74 | 76 | .493 | 19 | +6 | W2 |
10 Cardinals | 74 | 76 | .493 | 19 | -7 | W1 |
11 Reds | 70 | 79 | .470 | 22.5 | -145 | W1 |
12 Nationals | 70 | 81 | .464 | 23.5 | +3 | W3 |
13 Mets | 69 | 80 | .463 | 23.5 | -34 | L1 |
14 Giants | 62 | 88 | .413 | 31 | -77 | L3 |
15 Rockies | 55 | 94 | .369 | 37.5 | -169 | L7 |
CLE
VS
MIN
Pitchers
Tanner Bibee
Catchers
Patrick Bailey
Infielders
Travis Bazzana
Nathaniel Lowe
Angel Genao
Brayan Rocchio
Outfielders
Steven Kwan
Chase DeLauter
Angel Martinez
Designated Hitters
Jo Adell
Pitchers
Joe Ryan
Catchers
Ryan Jeffers
Infielders
Brooks Lee
Kody Clemens
Royce Lewis
Ryan Kreidler
Outfielders
Luke Keaschall
Emmanuel Rodriguez
Walker Jenkins
Designated Hitters
Trevor Larnach
Guardians
VS
Twins
Batting
150
Team Games Played
149
5004
At Bats
5012
1186
Hits
1223
590
Runs Batted In
653
142
Home Runs
174
136
Stolen Bases
83
.237
Batting Average
.244
615
Runs
683
231
Doubles
243
14
Triples
20
1871
Total Bases
2028
530
Walks
477
1197
Strikeouts
1188
.315
On Base Percentage
.318
.374
Slugging Percentage
.405
.688
OBP Pct + SLG Pct
.723
150
Games Played
149
0
Games Started
0
55
Hit By Pitch
88
0.0
Wins Above Replacement
0.0
0.0
Offensive Wins Above Replacement
0.0
28
Caught Stealing
33
1
Is Qualified
1
617.7
Runs Created
655.1
4.2
Runs Created Per 27 Outs
4.5
.094
Walks Per Plate Appearance
.085
0.44
Walk To Strikeout Ratio
0.40
.137
Isolated Power
.161
.264
Secondary Average
.266
3.95
Pitches Per Plate Appearance
3.86
387
Extra Base Hits
437
5659
Plate Appearances
5629
35.2
At Bats Per Home Run
28.8
27
Sacrifice Hit
9
41
Sacrifice Flies
42
Pitching
150
Team Games Played
149
55
Quality Starts
47
76
Wins
70
74
Losses
79
41
Saves
41
103
Holds
98
1186
Hits
1266
560
Earned runs
684
165
Home Runs
173
492
Walks
543
1415
Strikeouts
1246
9.6
Strikeouts Per 9 Innings
8.5
0.0
Pitches Per Start
0.0
1.26
Walks Plus Hits Per Inning Pitched
1.38
3.78
Earned Run Average
4.69
74
Losses
79
1331.2
Innings pitched
1313.2
.507
Win Percentage
.470
56
Save Opportunities
58
.236
Opponent Batting Average
.251
.311
Opponent's On-base pct.
.329
.387
Opponent's Slugging pct.
.414
.698
Opponent's OPB Pct + SLG Pct
.743
5015
At Bats
5047
232
Doubles
267
15
Triples
19
67
Batters Hit
65
96
Stolen Bases
122
150
Games Played
149
0
Complete Games
1
0
Shutouts
1
54
Wild Pitches
43
0
Runs Batted In
0
2
Balks
7
1331.2
Innings pitched
1313.2
9.6
Strikeouts Per 9 Innings
8.5
20
Caught Stealing
21
150
Games Started
149
0.0
Wins Above Replacement
0.0
1
Is Qualified
1
622
Runs
745
558
Earned Runs
675
1943
Total Bases
2090
Fielding
150
Team Games Played
149
1332
Full Innings
1314
5231
Total Chances
5144
3995
Putouts
3941
1157
Assists
1135
79
Errors
68
231
Double Plays
243
0.985
Fielding Percentage
0.987
34.8
Range Factor
34.8
0.0
Zone Rating
0.0
150
Games Played
149
0
Games Started
0
0.0
Defensive Wins Above Replacement
0.0
1
Qualified
1