

Guardians vs White Sox Live Score (8 Aug, 2026)
Game Information
Stage
Standard
Season
2026
First Pitch
Sat, Aug 8, 7:15 pm
Venue
Rate Field
Location
Chicago, Illinois
Attendance
38,227
Home Runs
Kyle Manzardo
13 HR
.215 AVG
39 RBI

Munetaka Murakami
25 HR
.236 AVG
52 RBI
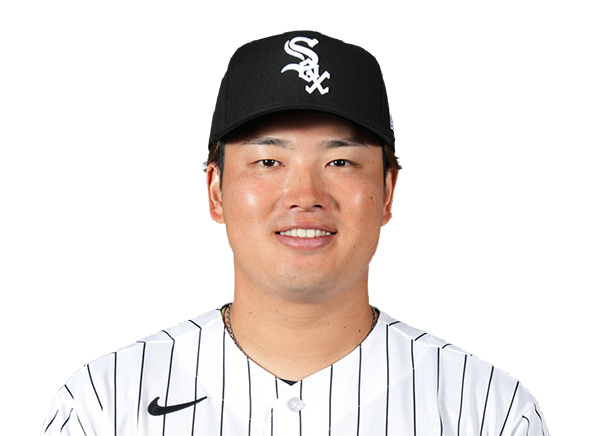
Batting Average
Chase DeLauter
.280 AVG
.356 OBP
.439 SLG

Sam Antonacci
.277 AVG
.365 OBP
.409 SLG
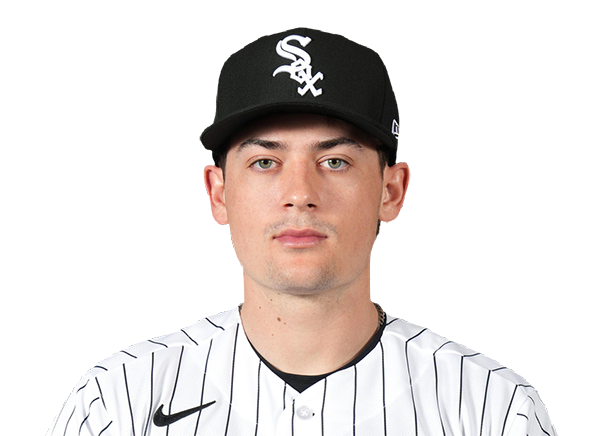
Runs Batted In
Chase DeLauter
56 RBI
12 HR
.280 AVG
Miguel Vargas
67 RBI
24 HR
.234 AVG
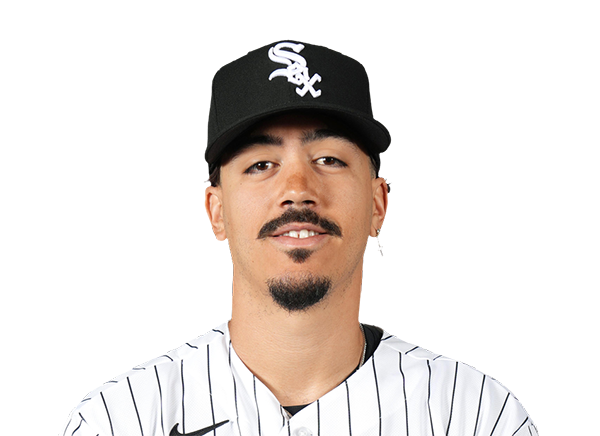
Earned Run Average
Parker Messick
2.57 ERA
9 W
136 K
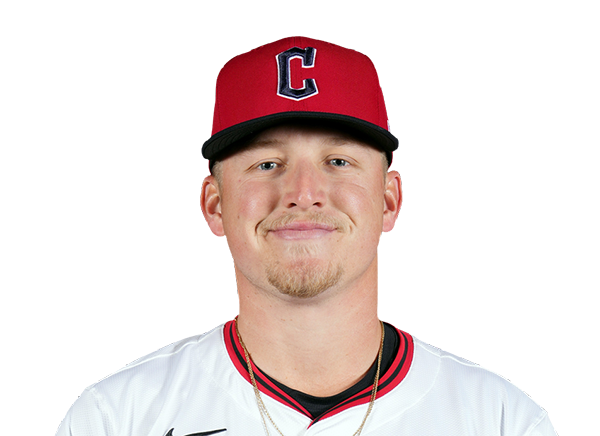
Sean Burke
3.08 ERA
7 W
144 K

Wins
Gavin Williams
11 W
3.56 ERA
178 K
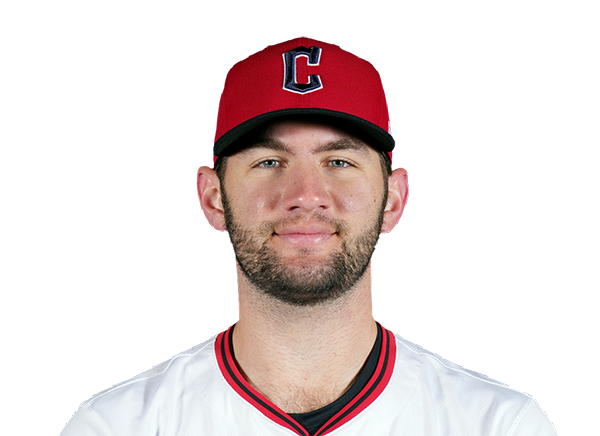
Davis Martin
9 W
4.13 ERA
107 K

Strikeouts
Gavin Williams
178 K
11 W
3.56 ERA
Sean Burke
144 K
7 W
3.08 ERA
Injury Report



Team Stats
 CLE
CHW


Array
Runs
Array
11
Hits
7
1
Errors
0
—
Home Runs
—
—
Walks
—
—
Strikeouts
—
Standings
American League
| Team | W | L | PCT | GB | DIFF | STRK |
|---|---|---|---|---|---|---|
1 Rays | 76 | 53 | .589 | - | +42 | L3 |
| 2White Sox | 67 | 62 | .519 | 9 | +42 | L1 |
3 Astros | 65 | 65 | .500 | 11.5 | -43 | L1 |
4 Yankees | 73 | 56 | .566 | 3 | +95 | L1 |
5 Red Sox | 70 | 59 | .543 | 6 | +98 | W2 |
6 Rangers | 64 | 66 | .492 | 12.5 | -48 | L1 |
| 7Guardians | 64 | 66 | .492 | 12.5 | -14 | W3 |
8 Blue Jays | 64 | 67 | .489 | 13 | -50 | W1 |
9 Twins | 63 | 67 | .485 | 13.5 | -47 | L2 |
10 Orioles | 63 | 67 | .485 | 13.5 | -33 | W2 |
11 Mariners | 62 | 68 | .477 | 14.5 | -44 | W2 |
12 Tigers | 61 | 68 | .473 | 15 | +77 | L4 |
13 Royals | 57 | 74 | .435 | 20 | -95 | W7 |
14 Angels | 52 | 78 | .400 | 24.5 | -68 | W1 |
15 Athletics | 50 | 80 | .385 | 26.5 | -188 | W1 |
National League
| Team | W | L | PCT | GB | DIFF | STRK |
|---|---|---|---|---|---|---|
1 Brewers | 81 | 49 | .623 | - | +163 | W3 |
2 Dodgers | 79 | 51 | .608 | 2 | +147 | W5 |
3 Braves | 75 | 55 | .577 | 6 | +108 | L2 |
4 Cubs | 74 | 56 | .569 | 7 | +98 | L3 |
5 Phillies | 72 | 58 | .554 | 9 | +25 | W8 |
6 Padres | 70 | 60 | .538 | 11 | +9 | W2 |
7 Diamondbacks | 68 | 62 | .523 | 13 | +7 | L1 |
8 Marlins | 66 | 64 | .508 | 15 | +17 | W2 |
9 Cardinals | 66 | 65 | .504 | 15.5 | 0 | L2 |
10 Pirates | 63 | 68 | .481 | 18.5 | +29 | L2 |
11 Reds | 62 | 68 | .477 | 19 | -92 | W1 |
12 Nationals | 61 | 70 | .466 | 20.5 | +14 | L3 |
13 Mets | 59 | 71 | .454 | 22 | -39 | W1 |
14 Giants | 52 | 77 | .403 | 28.5 | -79 | L3 |
15 Rockies | 50 | 79 | .388 | 30.5 | -131 | L5 |
CLE
VS
CHW
Pitchers
Gavin Williams
Catchers
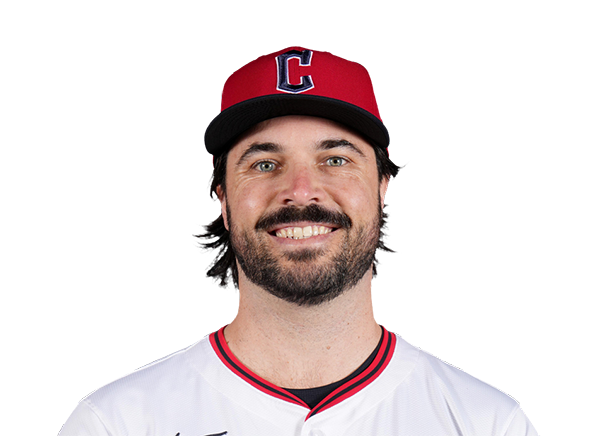
Austin Hedges
Infielders

Rhys Hoskins

Brayan Rocchio
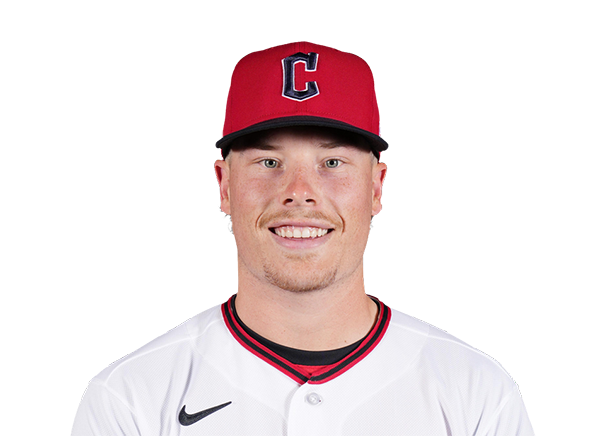
Travis Bazzana
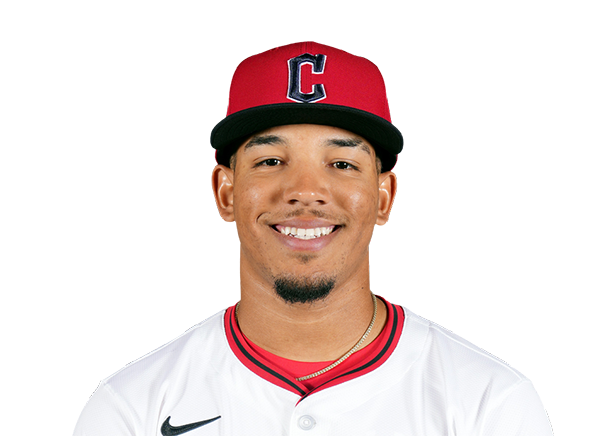
Angel Genao
Outfielders

Steven Kwan

Jo Adell
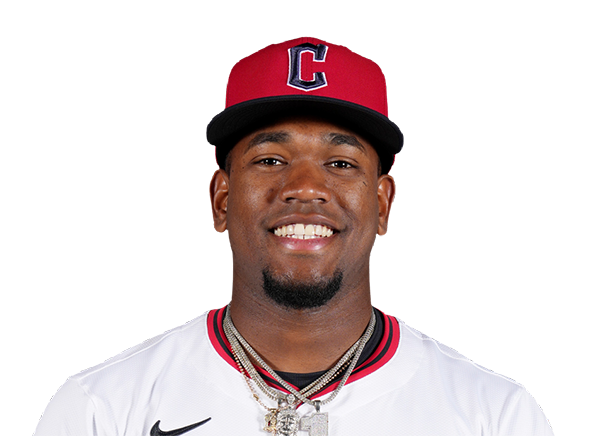
Angel Martinez
Designated Hitters
Chase DeLauter
Pitchers
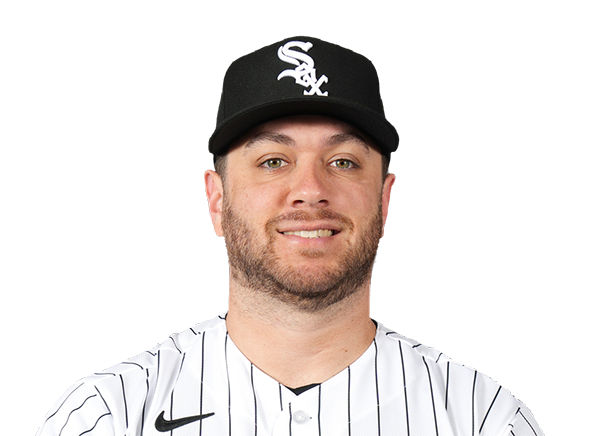
Anthony Kay
Catchers
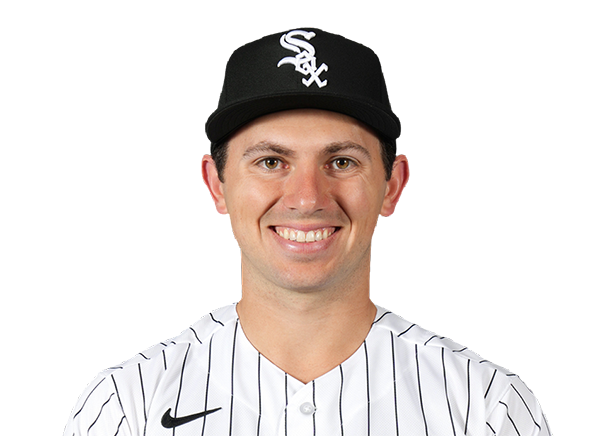
Drew Romo
Infielders
Munetaka Murakami
Miguel Vargas

Colson Montgomery
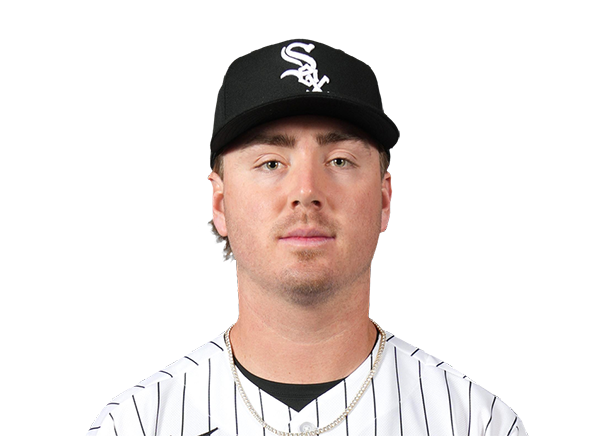
Chase Meidroth
Outfielders
Sam Antonacci
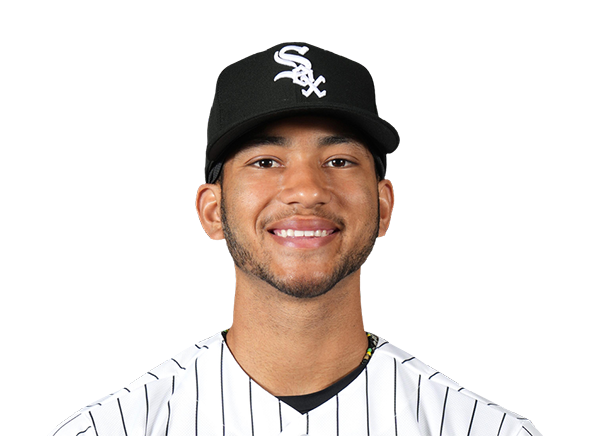
Braden Montgomery
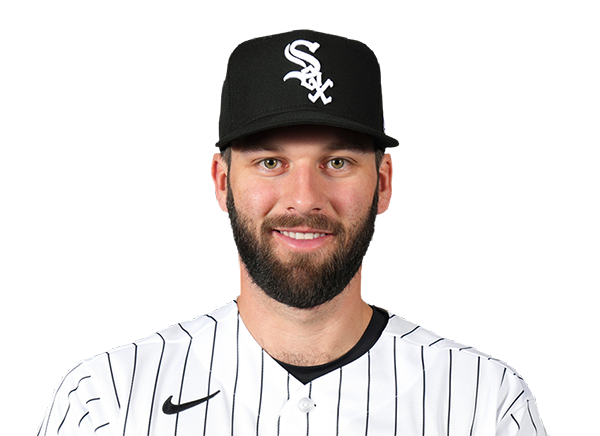
Tristan Peters
Designated Hitters
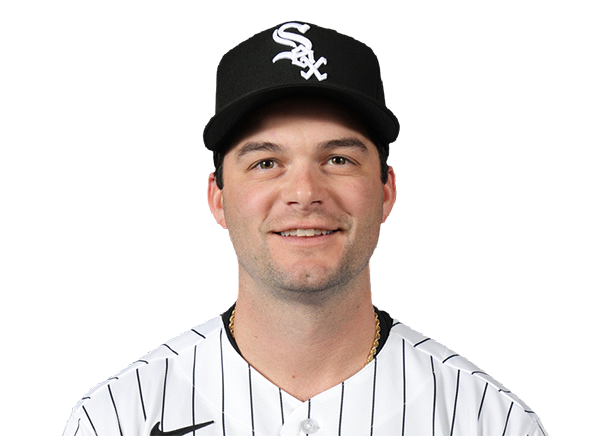
Andrew Benintendi
Guardians
VS
White Sox
Batting
118
Team Games Played
116
3915
At Bats
3896
912
Hits
924
452
Runs Batted In
526
114
Home Runs
151
115
Stolen Bases
67
.233
Batting Average
.237
470
Runs
552
174
Doubles
176
11
Triples
11
1450
Total Bases
1575
425
Walks
392
981
Strikeouts
1057
.313
On Base Percentage
.316
.370
Slugging Percentage
.404
.683
OBP Pct + SLG Pct
.720
118
Games Played
116
118
Games Started
116
41
Hit By Pitch
68
0.0
Wins Above Replacement
0.0
0.0
Offensive Wins Above Replacement
0.0
22
Caught Stealing
29
1
Is Qualified
1
478.6
Runs Created
512.7
4.1
Runs Created Per 27 Outs
4.5
.096
Walks Per Plate Appearance
.089
0.43
Walk To Strikeout Ratio
0.37
.137
Isolated Power
.167
.270
Secondary Average
.277
3.96
Pitches Per Plate Appearance
3.85
299
Extra Base Hits
338
4434
Plate Appearances
4411
34.3
At Bats Per Home Run
25.8
23
Sacrifice Hit
24
28
Sacrifice Flies
29
Pitching
118
Team Games Played
116
41
Quality Starts
29
58
Wins
60
60
Losses
56
34
Saves
29
88
Holds
45
947
Hits
932
445
Earned runs
474
136
Home Runs
127
383
Walks
419
1096
Strikeouts
979
9.4
Strikeouts Per 9 Innings
8.5
147.8
Pitches Per Start
150.9
1.27
Walks Plus Hits Per Inning Pitched
1.31
3.83
Earned Run Average
4.12
60
Losses
56
1046.2
Innings pitched
1034.1
.492
Win Percentage
.517
47
Save Opportunities
51
.240
Opponent Batting Average
.240
.311
Opponent's On-base pct.
.323
.396
Opponent's Slugging pct.
.393
.707
Opponent's OPB Pct + SLG Pct
.716
3953
At Bats
3878
179
Doubles
176
15
Triples
17
42
Batters Hit
72
85
Stolen Bases
97
118
Games Played
116
0
Complete Games
0
4
Shutouts
7
42
Wild Pitches
49
473
Runs Batted In
497
1
Balks
8
1046.2
Innings pitched
1034.1
9.4
Strikeouts Per 9 Innings
8.5
14
Caught Stealing
32
118
Games Started
116
0.0
Wins Above Replacement
0.0
1
Is Qualified
1
495
Runs
517
445
Earned Runs
474
1564
Total Bases
1523
Fielding
118
Team Games Played
116
1047
Full Innings
1034
4126
Total Chances
4124
3140
Putouts
3103
921
Assists
957
65
Errors
64
174
Double Plays
176
0.984
Fielding Percentage
0.984
34.9
Range Factor
35.3
0.0
Zone Rating
0.0
118
Games Played
116
0
Games Started
0
0.0
Defensive Wins Above Replacement
0.0
1
Qualified
1