

Guardians vs White Sox Live Score (9 Aug, 2026)
Game Information
Stage
Standard
Season
2026
First Pitch
Sun, Aug 9, 2:10 pm
Venue
Rate Field
Location
Chicago, Illinois
Attendance
31,263
Inning Scores
Home Runs
Rhys Hoskins
13 HR
.183 AVG
38 RBI

Munetaka Murakami
26 HR
.237 AVG
53 RBI

Batting Average
Chase DeLauter
.279 AVG
.354 OBP
.436 SLG

Sam Antonacci
.274 AVG
.361 OBP
.404 SLG

Runs Batted In
Chase DeLauter
56 RBI
12 HR
.279 AVG
Miguel Vargas
67 RBI
24 HR
.234 AVG
Earned Run Average
Parker Messick
2.57 ERA
9 W
136 K

Sean Burke
3.08 ERA
7 W
144 K

Wins
Gavin Williams
11 W
3.55 ERA
185 K

Davis Martin
9 W
4.13 ERA
107 K

Strikeouts
Gavin Williams
185 K
11 W
3.55 ERA
Sean Burke
144 K
7 W
3.08 ERA
Injury Report




Team Stats
 CLE
CHW

Array
Runs
Array
5
Hits
6
0
Errors
1
—
Home Runs
—
—
Walks
—
—
Strikeouts
—
Standings
American League
| Team | W | L | PCT | GB | DIFF | STRK |
|---|---|---|---|---|---|---|
1 Rays | 76 | 53 | .589 | - | +42 | L3 |
| 2White Sox | 67 | 62 | .519 | 9 | +42 | L1 |
3 Astros | 65 | 65 | .500 | 11.5 | -43 | L1 |
4 Yankees | 73 | 56 | .566 | 3 | +95 | L1 |
5 Red Sox | 70 | 59 | .543 | 6 | +98 | W2 |
6 Rangers | 64 | 66 | .492 | 12.5 | -48 | L1 |
7 Blue Jays | 64 | 67 | .489 | 13 | -50 | W1 |
8 Twins | 63 | 66 | .488 | 13 | -45 | L1 |
| 9Guardians | 63 | 66 | .488 | 13 | -15 | W2 |
10 Orioles | 63 | 67 | .485 | 13.5 | -33 | W2 |
11 Mariners | 62 | 68 | .477 | 14.5 | -44 | W2 |
12 Tigers | 61 | 68 | .473 | 15 | +77 | L4 |
13 Royals | 57 | 74 | .435 | 20 | -95 | W7 |
14 Angels | 52 | 78 | .400 | 24.5 | -68 | W1 |
15 Athletics | 50 | 80 | .385 | 26.5 | -188 | W1 |
National League
| Team | W | L | PCT | GB | DIFF | STRK |
|---|---|---|---|---|---|---|
1 Brewers | 81 | 49 | .623 | - | +163 | W3 |
2 Dodgers | 79 | 51 | .608 | 2 | +147 | W5 |
3 Braves | 75 | 55 | .577 | 6 | +108 | L2 |
4 Cubs | 74 | 56 | .569 | 7 | +98 | L3 |
5 Phillies | 72 | 58 | .554 | 9 | +25 | W8 |
6 Padres | 69 | 60 | .535 | 11.5 | +7 | W1 |
7 Diamondbacks | 68 | 61 | .527 | 12.5 | +13 | W2 |
8 Marlins | 66 | 64 | .508 | 15 | +17 | W2 |
9 Cardinals | 66 | 65 | .504 | 15.5 | 0 | L2 |
10 Pirates | 63 | 68 | .481 | 18.5 | +29 | L2 |
11 Reds | 61 | 68 | .473 | 19.5 | -98 | L2 |
12 Nationals | 61 | 70 | .466 | 20.5 | +14 | L3 |
13 Mets | 59 | 71 | .454 | 22 | -39 | W1 |
14 Giants | 52 | 77 | .403 | 28.5 | -79 | L3 |
15 Rockies | 50 | 78 | .391 | 30 | -130 | L4 |
CLE
VS
CHW
Pitchers
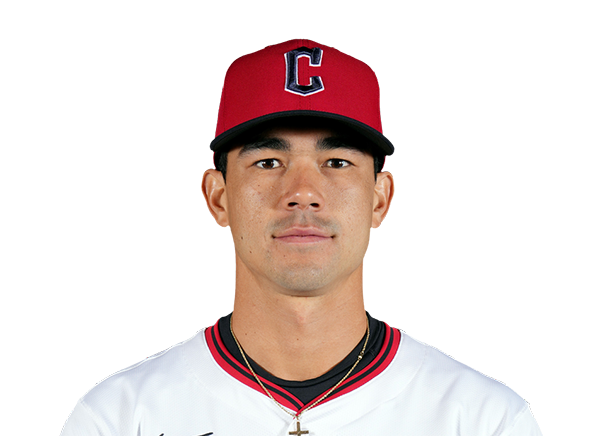
Joey Cantillo
Catchers

Patrick Bailey
Infielders
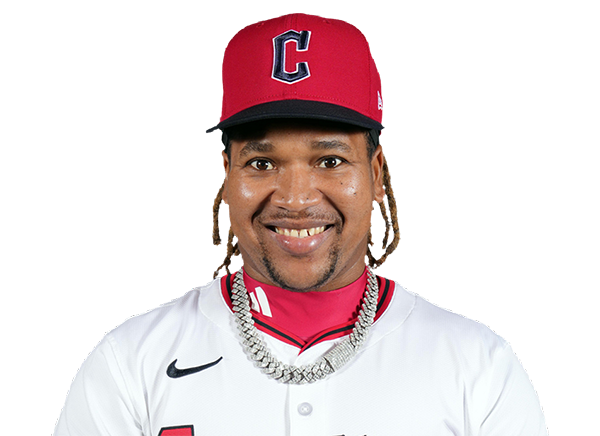
Jose Ramirez

Nathaniel Lowe

Brayan Rocchio
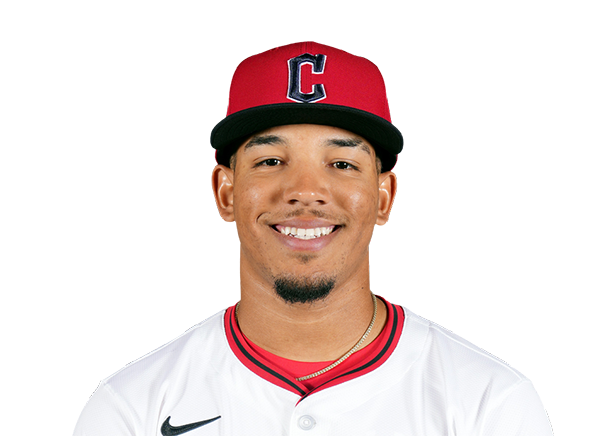
Angel Genao
Outfielders

Steven Kwan
Chase DeLauter

Jo Adell
Designated Hitters

Travis Bazzana
Pitchers
Davis Martin
Catchers
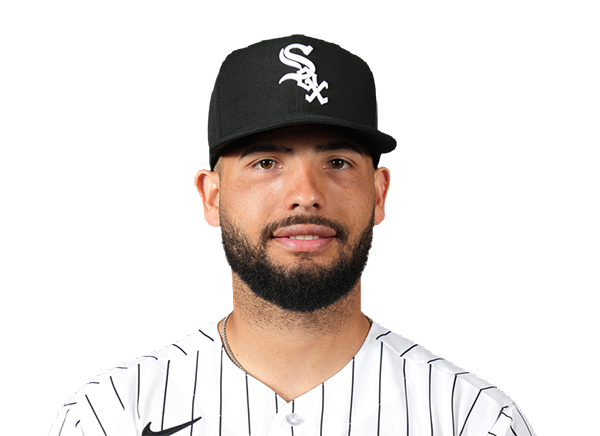
Edgar Quero
Infielders
Munetaka Murakami
Miguel Vargas
Sam Antonacci
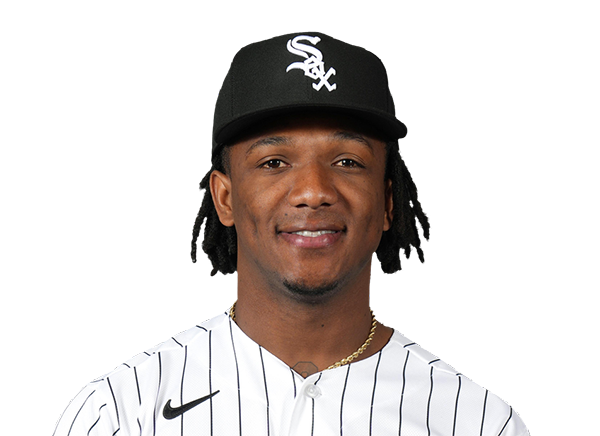
Luisangel Acuna
Outfielders

Brenton Doyle
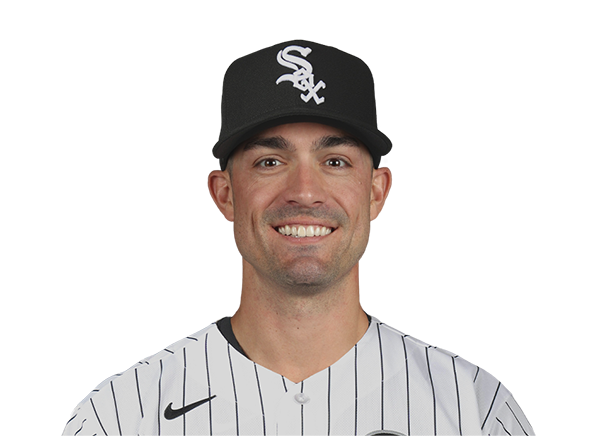
Randal Grichuk
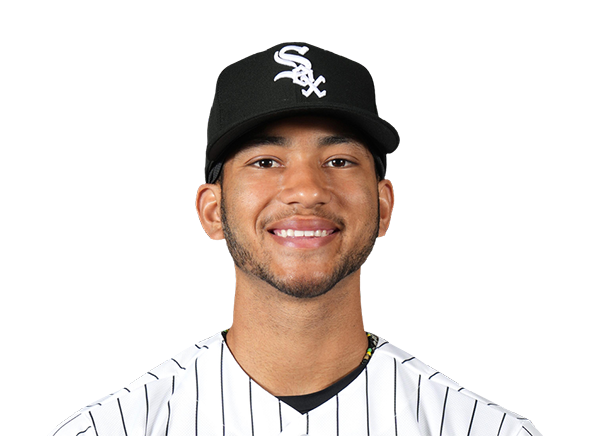
Braden Montgomery
Designated Hitters

Colson Montgomery
Guardians
VS
White Sox
Batting
119
Team Games Played
117
3945
At Bats
3924
917
Hits
930
454
Runs Batted In
531
114
Home Runs
152
116
Stolen Bases
68
.232
Batting Average
.237
473
Runs
557
174
Doubles
180
11
Triples
11
1455
Total Bases
1588
433
Walks
401
990
Strikeouts
1067
.313
On Base Percentage
.317
.369
Slugging Percentage
.405
.681
OBP Pct + SLG Pct
.721
119
Games Played
117
119
Games Started
117
41
Hit By Pitch
70
0.0
Wins Above Replacement
0.0
0.0
Offensive Wins Above Replacement
0.0
22
Caught Stealing
30
1
Is Qualified
1
481.6
Runs Created
519.2
4.1
Runs Created Per 27 Outs
4.5
.097
Walks Per Plate Appearance
.090
0.44
Walk To Strikeout Ratio
0.38
.136
Isolated Power
.168
.270
Secondary Average
.280
3.97
Pitches Per Plate Appearance
3.85
299
Extra Base Hits
343
4474
Plate Appearances
4450
34.6
At Bats Per Home Run
25.8
23
Sacrifice Hit
24
30
Sacrifice Flies
29
Pitching
119
Team Games Played
117
41
Quality Starts
29
58
Wins
61
61
Losses
56
34
Saves
30
88
Holds
49
953
Hits
937
450
Earned runs
476
137
Home Runs
127
392
Walks
427
1106
Strikeouts
988
9.4
Strikeouts Per 9 Innings
8.5
147.9
Pitches Per Start
151.1
1.28
Walks Plus Hits Per Inning Pitched
1.31
3.84
Earned Run Average
4.11
61
Losses
56
1054.2
Innings pitched
1043.1
.487
Win Percentage
.521
48
Save Opportunities
52
.239
Opponent Batting Average
.240
.312
Opponent's On-base pct.
.323
.396
Opponent's Slugging pct.
.391
.708
Opponent's OPB Pct + SLG Pct
.714
3981
At Bats
3908
183
Doubles
176
15
Triples
17
44
Batters Hit
72
86
Stolen Bases
98
119
Games Played
117
0
Complete Games
0
4
Shutouts
7
44
Wild Pitches
51
478
Runs Batted In
499
1
Balks
8
1054.2
Innings pitched
1043.1
9.4
Strikeouts Per 9 Innings
8.5
15
Caught Stealing
32
119
Games Started
117
0.0
Wins Above Replacement
0.0
1
Is Qualified
1
500
Runs
520
450
Earned Runs
476
1577
Total Bases
1528
Fielding
119
Team Games Played
117
1055
Full Innings
1043
4157
Total Chances
4154
3164
Putouts
3130
928
Assists
959
65
Errors
65
174
Double Plays
180
0.984
Fielding Percentage
0.984
34.9
Range Factor
35.3
0.0
Zone Rating
0.0
119
Games Played
117
0
Games Started
0
0.0
Defensive Wins Above Replacement
0.0
1
Qualified
1