

Mariners vs Astros Live Score (15 Aug, 2026)
Game Information
Stage
Standard
Season
2026
First Pitch
Sat, Aug 15, 7:10 pm
Venue
Daikin Park
Location
Houston, Texas
Attendance
34,664
Live Situation
2Balls
2Strikes
0Outs
—Pitcher
—At Bat
Pitch Sequence
1
STRIKE SWINGING
Four-seam FB
97 MPH
2
STRIKE SWINGING
Sinker
97 MPH
3
BALL
Splitter
86 MPH
4
BALL
Sweeper
85 MPH
5
BALL IN PLAY
Sinker
96 MPH
Injury Report

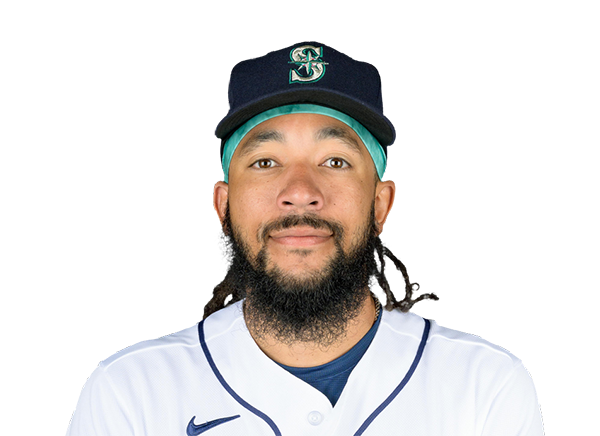
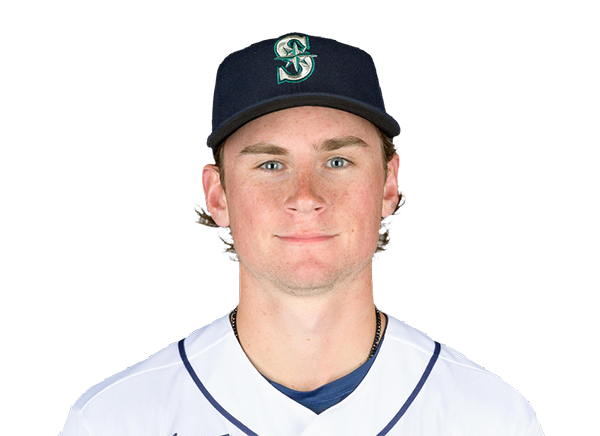
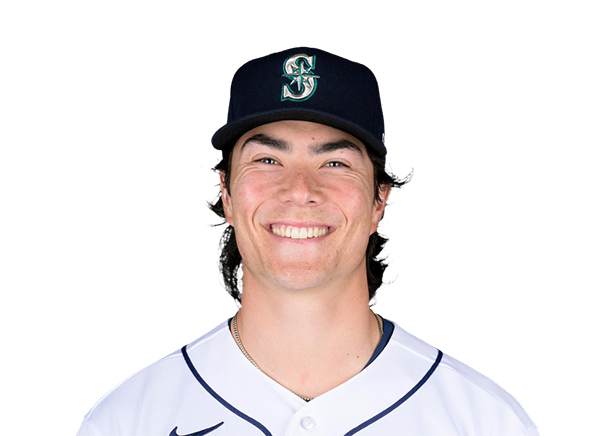

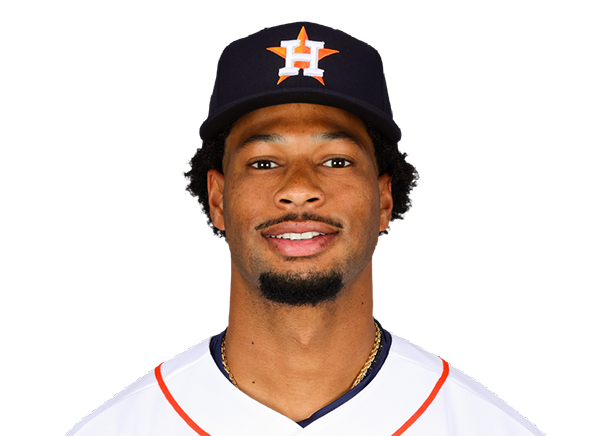
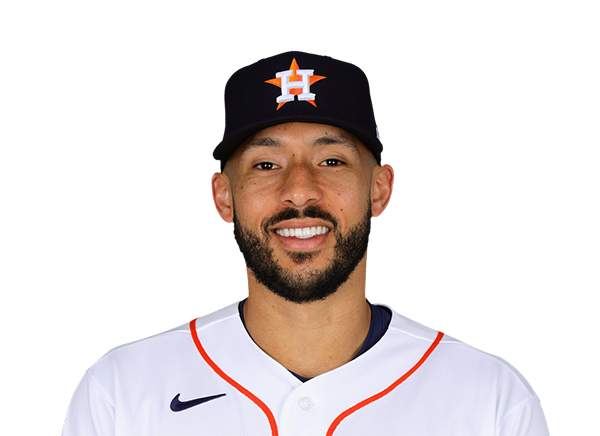
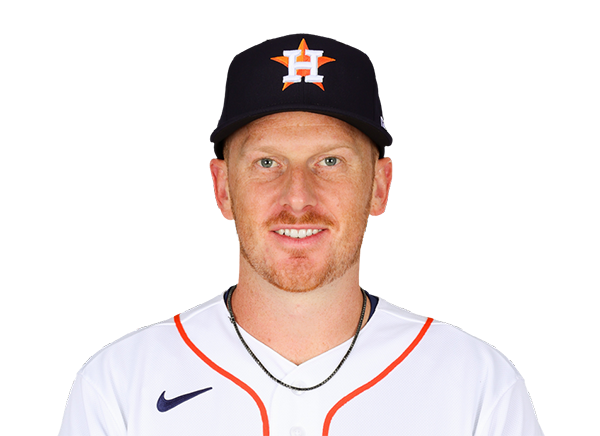
Team Stats
 SEA
HOU


10
Runs
5
15
Hits
8
0
Errors
2
1
Home Runs
2
2
Walks
2
10
Strikeouts
8
Player Box Score
Seattle Mariners
| Player | H-AB | AB | R | H | RBI | HR | BB | K | #P | AVG | OBP | SLG |
|---|---|---|---|---|---|---|---|---|---|---|---|---|
 Brendan Donovan | 3-5 | 5 | 0 | 3 | 3 | 0 | 0 | 0 | 23 | .263 | .353 | .398 |
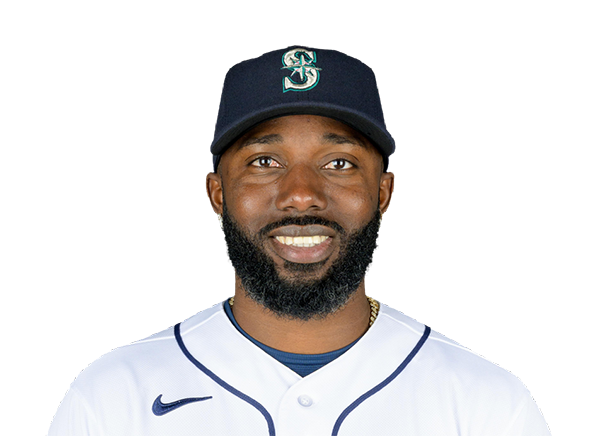 Randy Arozarena | 0-5 | 5 | 0 | 0 | 0 | 0 | 0 | 2 | 19 | .275 | .368 | .450 |
 Dominic Canzone | 2-5 | 5 | 0 | 2 | 0 | 0 | 0 | 1 | 20 | .257 | .332 | .492 |
 Julio Rodriguez | 2-5 | 5 | 2 | 2 | 0 | 0 | 0 | 0 | 14 | .259 | .325 | .426 |
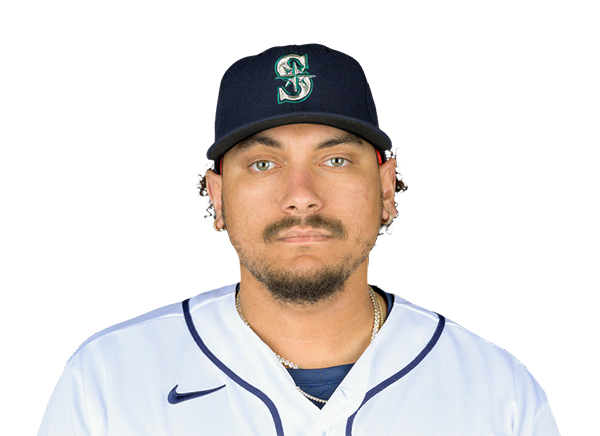 Josh Naylor | 2-5 | 5 | 2 | 2 | 0 | 0 | 0 | 3 | 19 | .267 | .332 | .375 |
 Cole Young | 3-5 | 5 | 3 | 3 | 4 | 1 | 0 | 0 | 14 | .262 | .319 | .407 |
 Cal Raleigh | 0-5 | 5 | 0 | 0 | 0 | 0 | 0 | 1 | 19 | .156 | .266 | .291 |
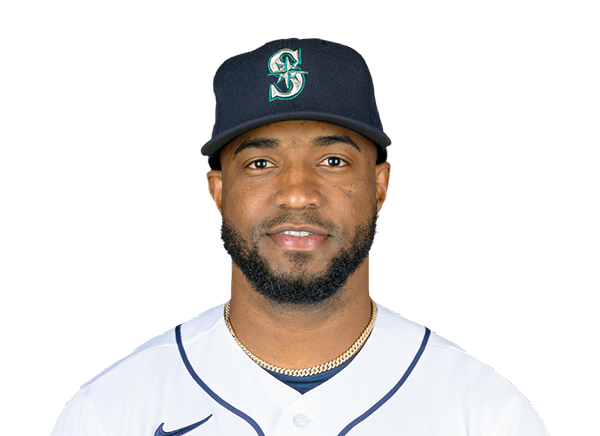 Victor Robles | 2-4 | 4 | 2 | 2 | 2 | 0 | 1 | 0 | 14 | .264 | .311 | .320 |
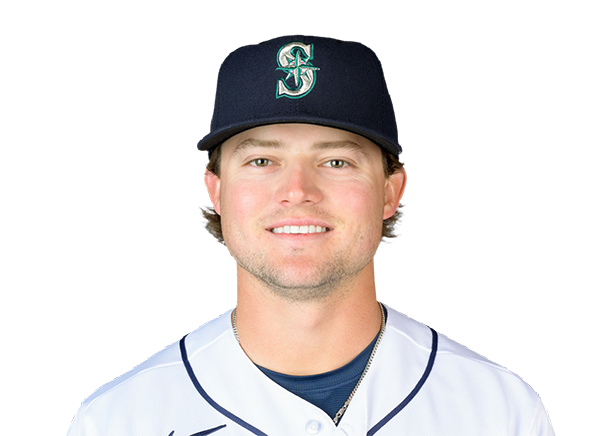 Brock Rodden | 1-4 | 4 | 1 | 1 | 1 | 0 | 1 | 3 | 22 | .250 | .300 | .500 |
Houston Astros
| Player | H-AB | AB | R | H | RBI | HR | BB | K | #P | AVG | OBP | SLG |
|---|---|---|---|---|---|---|---|---|---|---|---|---|
 Jeremy Pena | 1-4 | 4 | 1 | 1 | 0 | 0 | 0 | 0 | 12 | .288 | .344 | .470 |
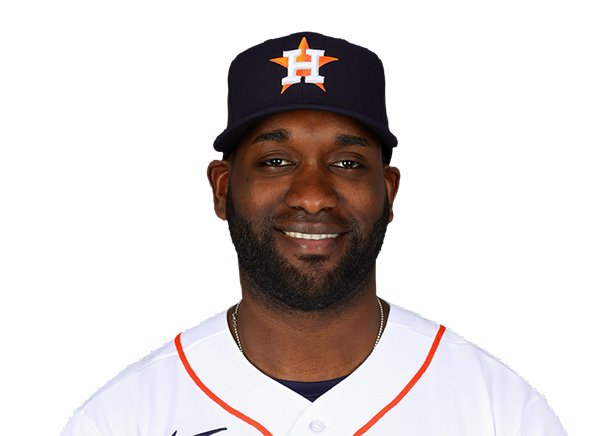 Yordan Alvarez | 0-3 | 3 | 1 | 0 | 0 | 0 | 1 | 0 | 9 | .321 | .436 | .622 |
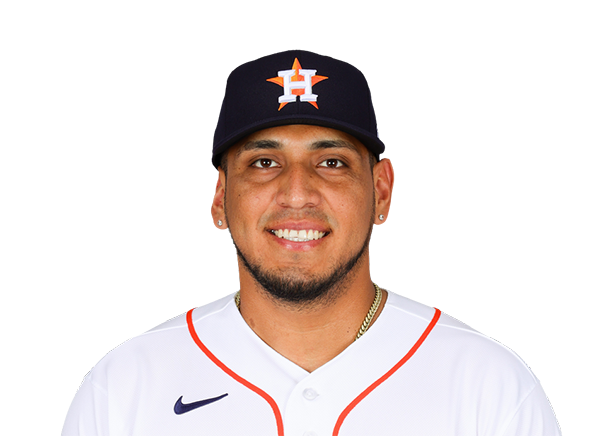 Isaac Paredes | 3-4 | 4 | 1 | 3 | 2 | 1 | 0 | 0 | 12 | .260 | .350 | .425 |
 Daulton Varsho | 1-4 | 4 | 0 | 1 | 0 | 0 | 0 | 1 | 13 | .150 | .261 | .225 |
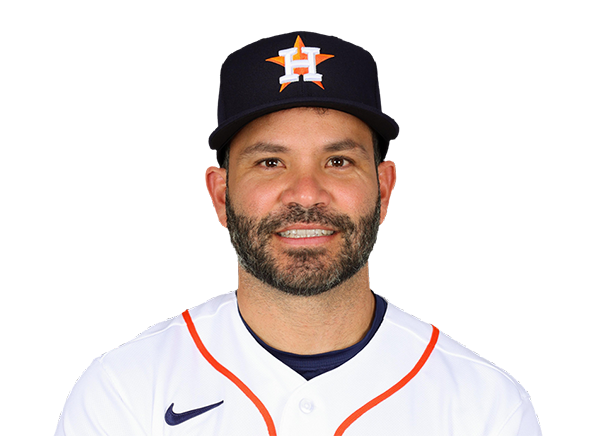 Jose Altuve | 2-4 | 4 | 1 | 2 | 1 | 0 | 0 | 1 | 11 | .245 | .307 | .397 |
 Christian Walker | 0-4 | 4 | 0 | 0 | 1 | 0 | 0 | 2 | 14 | .236 | .314 | .451 |
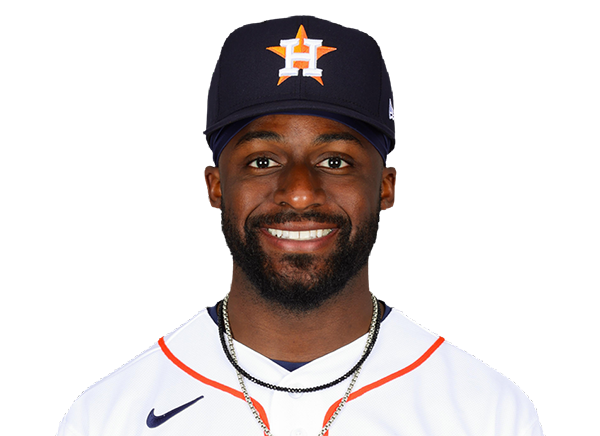 Taylor Trammell | 0-3 | 3 | 0 | 0 | 0 | 0 | 1 | 2 | 16 | .224 | .315 | .402 |
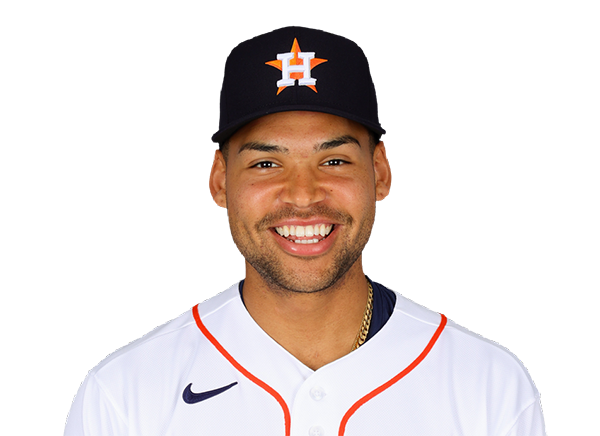 Cam Smith | 0-4 | 4 | 0 | 0 | 0 | 0 | 0 | 1 | 21 | .223 | .292 | .395 |
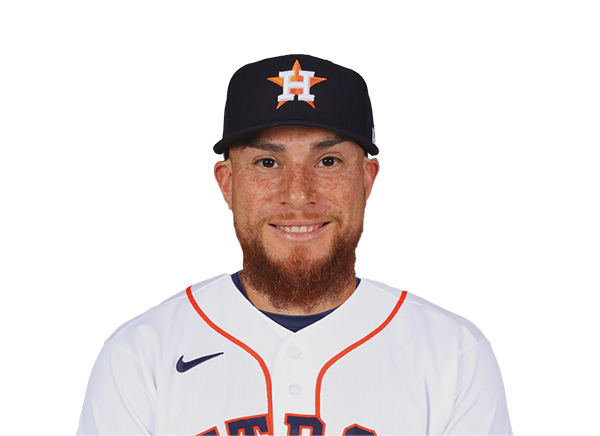 Christian Vazquez | 1-2 | 2 | 1 | 1 | 1 | 1 | 0 | 1 | 9 | .216 | .271 | .337 |
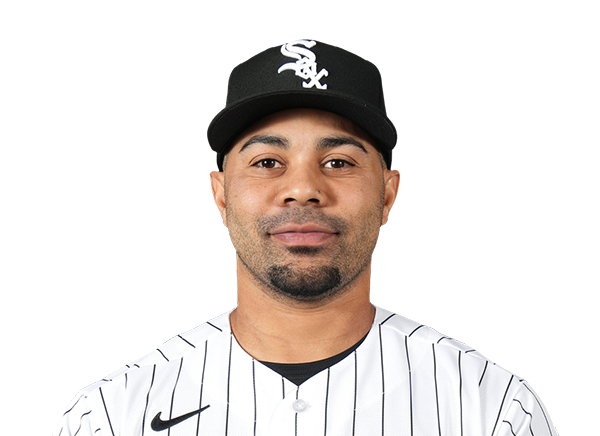 LaMonte Wade Jr. | 0-0 | 0 | 0 | 0 | 0 | 0 | 0 | 0 | 2 | .218 | .344 | .346 |
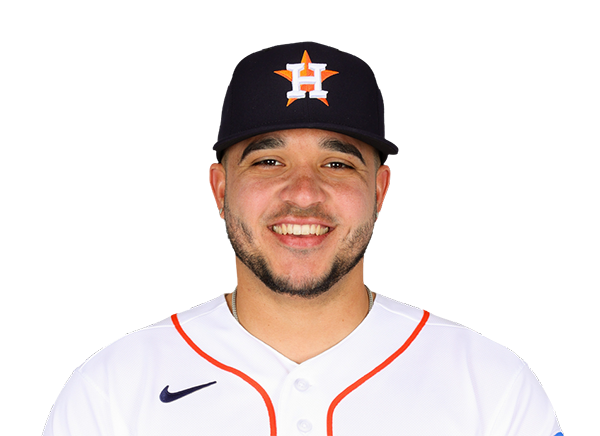 Yainer Diaz | 0-1 | 1 | 0 | 0 | 0 | 0 | 0 | 0 | 3 | .251 | .280 | .396 |
Seattle Mariners
| Player | IP | H | R | ER | BB | K | HR | PC-ST | ERA | PC |
|---|---|---|---|---|---|---|---|---|---|---|
 Emerson Hancock | 7.0 | 5 | 2 | 2 | 2 | 8 | 1 | 97-66 | 3.30 | 97 |
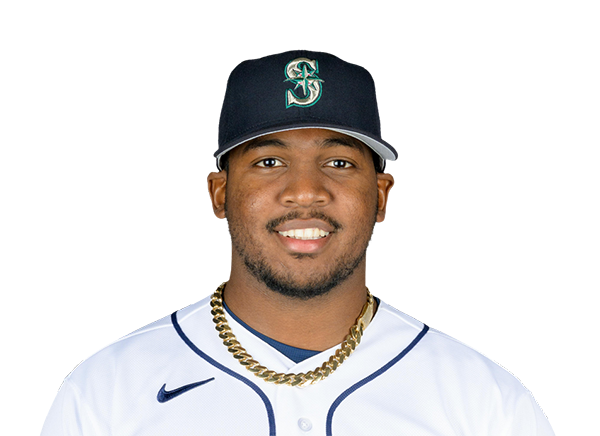 Jose Ferrer | 1.0 | 2 | 2 | 2 | 0 | 0 | 1 | 13-9 | 3.71 | 13 |
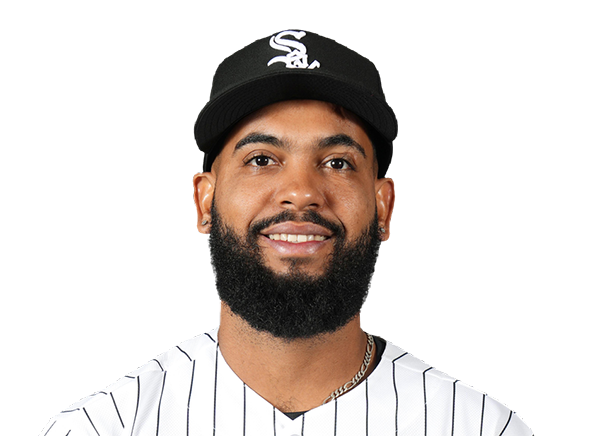 Seranthony Dominguez | 1.0 | 1 | 1 | 1 | 0 | 0 | 0 | 12-9 | 4.64 | 12 |
Houston Astros
| Player | IP | H | R | ER | BB | K | HR | PC-ST | ERA | PC |
|---|---|---|---|---|---|---|---|---|---|---|
 Hayden Wesneski | 4.0 | 7 | 5 | 5 | 1 | 6 | 0 | 81-52 | 5.16 | 81 |
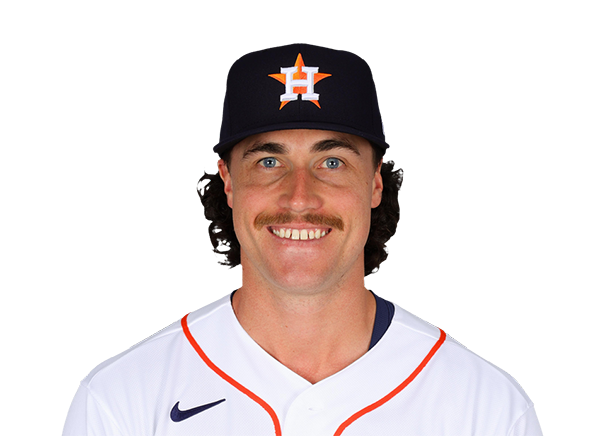 Bryan King | 1.0 | 1 | 0 | 0 | 0 | 1 | 0 | 24-17 | 3.88 | 24 |
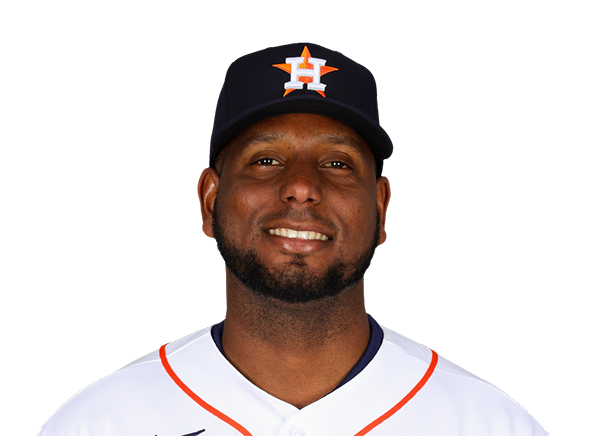 Ronel Blanco | 4.0 | 7 | 5 | 5 | 1 | 3 | 1 | 59-42 | 7.71 | 59 |
H2H / Season Series
HOU2–3
SEA
HOU5–10
SEA
HOU10–7
SEA
HOU3–8
SEA
HOU4–3
SEA
HOU2–10
SEA
HOU1–3
SEA
SEA6–2
HOU
SEA6–1
HOU
SEA8–7
HOU
Last 5 Games
| Date | Opponent | Result |
|---|---|---|
| Aug 22 |  vs CHC | W5–4 |
| Aug 21 | vs CHC | W6–5 |
| Aug 20 |  @ MIL | L4–7 |
| Aug 19 | @ MIL | W7–5 |
| Aug 18 | @ MIL | L0–22 |
| Date | Opponent | Result |
|---|---|---|
| Aug 22 |  vs ATH | L3–4 |
| Aug 21 | vs ATH | W4–0 |
| Aug 20 |  vs LAA | L3–18 |
| Aug 19 | vs LAA | W3–2 |
| Aug 18 | vs LAA | L1–3 |
Standings
American League
| Team | W | L | PCT | GB | DIFF | STRK |
|---|---|---|---|---|---|---|
1 Rays | 76 | 53 | .589 | - | +42 | L3 |
2 White Sox | 67 | 61 | .523 | 8.5 | +47 | W1 |
| 3Astros | 65 | 64 | .504 | 11 | -42 | W1 |
4 Yankees | 73 | 56 | .566 | 3 | +95 | L1 |
5 Red Sox | 69 | 59 | .539 | 6.5 | +97 | W1 |
6 Rangers | 64 | 66 | .492 | 12.5 | -48 | L1 |
7 Blue Jays | 64 | 67 | .489 | 13 | -50 | W1 |
8 Twins | 63 | 66 | .488 | 13 | -45 | L1 |
9 Guardians | 63 | 66 | .488 | 13 | -15 | W2 |
10 Orioles | 63 | 67 | .485 | 13.5 | -33 | W2 |
| 11Mariners | 62 | 68 | .477 | 14.5 | -44 | W2 |
12 Tigers | 61 | 68 | .473 | 15 | +77 | L4 |
13 Royals | 57 | 74 | .435 | 20 | -95 | W7 |
| 14Angels | 52 | 78 | .400 | 24.5 | -68 | W1 |
| 15Athletics | 49 | 80 | .380 | 27 | -189 | L5 |
National League
| Team | W | L | PCT | GB | DIFF | STRK |
|---|---|---|---|---|---|---|
| 1Brewers | 81 | 49 | .623 | - | +163 | W3 |
2 Dodgers | 78 | 51 | .605 | 2.5 | +146 | W4 |
3 Braves | 75 | 55 | .577 | 6 | +108 | L2 |
| 4Cubs | 74 | 56 | .569 | 7 | +98 | L3 |
5 Phillies | 72 | 58 | .554 | 9 | +25 | W8 |
6 Padres | 69 | 60 | .535 | 11.5 | +7 | W1 |
7 Diamondbacks | 68 | 61 | .527 | 12.5 | +13 | W2 |
8 Marlins | 66 | 64 | .508 | 15 | +17 | W2 |
9 Cardinals | 66 | 65 | .504 | 15.5 | 0 | L2 |
10 Pirates | 63 | 67 | .485 | 18 | +30 | L1 |
11 Reds | 61 | 68 | .473 | 19.5 | -98 | L2 |
12 Nationals | 61 | 70 | .466 | 20.5 | +14 | L3 |
13 Mets | 58 | 71 | .450 | 22.5 | -44 | L1 |
14 Giants | 52 | 76 | .406 | 28 | -78 | L2 |
15 Rockies | 50 | 78 | .391 | 30 | -130 | L4 |
SEA
VS
HOU
Pitchers
Emerson Hancock
Jose Ferrer
Seranthony Dominguez
Catchers
Cal Raleigh
Infielders
Brendan Donovan
Josh Naylor
Cole Young
Brock Rodden
Outfielders
Randy Arozarena
Julio Rodriguez
Victor Robles
Designated Hitters
Dominic Canzone
Pitchers
Hayden Wesneski
Bryan King
Ronel Blanco
Catchers
Christian Vazquez
Yainer Diaz
Infielders
Jeremy Pena
Isaac Paredes
Jose Altuve
Christian Walker
Outfielders
Daulton Varsho
Taylor Trammell
Cam Smith
Designated Hitters
Yordan Alvarez
Other Players
LaMonte Wade Jr.
Mariners
VS
Astros
Batting
123
Team Games Played
123
4059
At Bats
4148
928
Hits
1012
460
Runs Batted In
542
142
Home Runs
164
86
Stolen Bases
40
.229
Batting Average
.244
476
Runs
569
147
Doubles
182
11
Triples
12
1523
Total Bases
1710
404
Walks
414
1051
Strikeouts
994
.308
On Base Percentage
.319
.375
Slugging Percentage
.412
.683
OBP Pct + SLG Pct
.732
123
Games Played
123
123
Games Started
123
74
Hit By Pitch
59
0.0
Wins Above Replacement
0.0
0.0
Offensive Wins Above Replacement
0.0
31
Caught Stealing
16
1
Is Qualified
1
477.9
Runs Created
548.7
3.9
Runs Created Per 27 Outs
4.5
.088
Walks Per Plate Appearance
.089
0.38
Walk To Strikeout Ratio
0.42
.147
Isolated Power
.168
.260
Secondary Average
.274
3.91
Pitches Per Plate Appearance
3.88
300
Extra Base Hits
358
4577
Plate Appearances
4669
28.6
At Bats Per Home Run
25.3
9
Sacrifice Hit
16
30
Sacrifice Flies
30
Pitching
123
Team Games Played
123
55
Quality Starts
36
57
Wins
63
66
Losses
60
27
Saves
38
63
Holds
60
1004
Hits
970
465
Earned runs
552
133
Home Runs
164
309
Walks
508
1043
Strikeouts
1072
8.6
Strikeouts Per 9 Innings
8.8
141.3
Pitches Per Start
151.6
1.21
Walks Plus Hits Per Inning Pitched
1.35
3.85
Earned Run Average
4.55
66
Losses
60
1086.0
Innings pitched
1091.1
.463
Win Percentage
.512
47
Save Opportunities
46
.245
Opponent Batting Average
.238
.304
Opponent's On-base pct.
.331
.395
Opponent's Slugging pct.
.405
.699
Opponent's OPB Pct + SLG Pct
.736
4104
At Bats
4083
197
Doubles
156
11
Triples
18
53
Batters Hit
74
85
Stolen Bases
98
123
Games Played
123
1
Complete Games
0
9
Shutouts
7
27
Wild Pitches
40
477
Runs Batted In
565
4
Balks
5
1086.0
Innings pitched
1091.1
8.6
Strikeouts Per 9 Innings
8.8
27
Caught Stealing
30
123
Games Started
123
0.0
Wins Above Replacement
0.0
1
Is Qualified
1
505
Runs
593
465
Earned Runs
552
1622
Total Bases
1654
Fielding
123
Team Games Played
123
1086
Full Innings
1091
4316
Total Chances
4232
3258
Putouts
3274
998
Assists
905
60
Errors
53
147
Double Plays
182
0.986
Fielding Percentage
0.987
35.3
Range Factor
34.5
0.0
Zone Rating
0.0
123
Games Played
123
0
Games Started
0
0.0
Defensive Wins Above Replacement
0.0
1
Qualified
1