

Mariners vs Athletics Live Score (13 Sep, 2026)
Game Information
Stage
STD
Season
2026
First Pitch
Sun, Sep 13, 4:05 pm
Venue
Sutter Health Park
Location
Sacramento, California
Venue Type
Outdoor
Broadcast
MLB.TV
Attendance
9,171
Live Situation
3Balls
1Strikes
0Outs
—Pitcher
—At Bat
Pitch Sequence
1
BALL
Four-seam FB
100 MPH
2
BALL
Changeup
92 MPH
3
BALL
Four-seam FB
99 MPH
4
STRIKE LOOKING
Four-seam FB
100 MPH
5
BALL IN PLAY
Four-seam FB
101 MPH
Injury Report






Team Stats
 SEA
ATH


7
Runs
8
12
Hits
9
1
Errors
0
2
Home Runs
3
6
Walks
6
6
Strikeouts
7
Player Box Score
Seattle Mariners
| Player | H-AB | AB | R | H | RBI | HR | BB | K | #P | AVG | OBP | SLG |
|---|---|---|---|---|---|---|---|---|---|---|---|---|
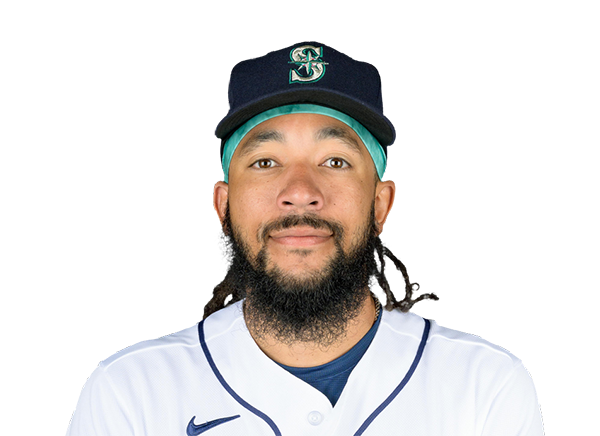 J.P. Crawford | 1-4 | 4 | 0 | 1 | 1 | 0 | 1 | 0 | 28 | .223 | .344 | .346 |
 Randy Arozarena | 3-5 | 5 | 2 | 3 | 4 | 2 | 0 | 0 | 19 | .276 | .373 | .476 |
 Dominic Canzone | 1-5 | 5 | 0 | 1 | 0 | 0 | 0 | 1 | 20 | .257 | .326 | .481 |
 Cal Raleigh | 1-5 | 5 | 1 | 1 | 0 | 0 | 0 | 2 | 24 | .180 | .295 | .365 |
 Julio Rodriguez | 1-5 | 5 | 0 | 1 | 0 | 0 | 0 | 1 | 25 | .242 | .302 | .396 |
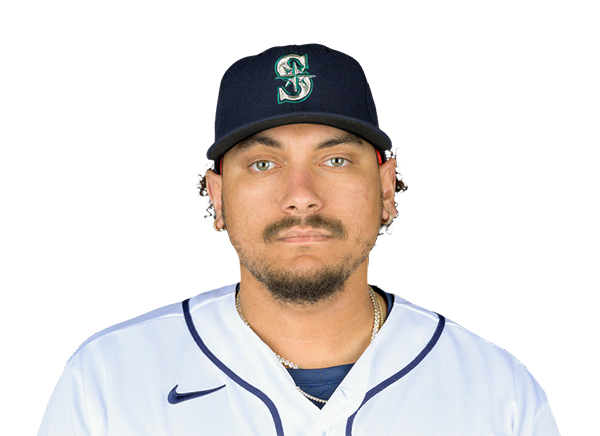 Josh Naylor | 2-4 | 4 | 1 | 2 | 0 | 0 | 1 | 0 | 17 | .271 | .328 | .364 |
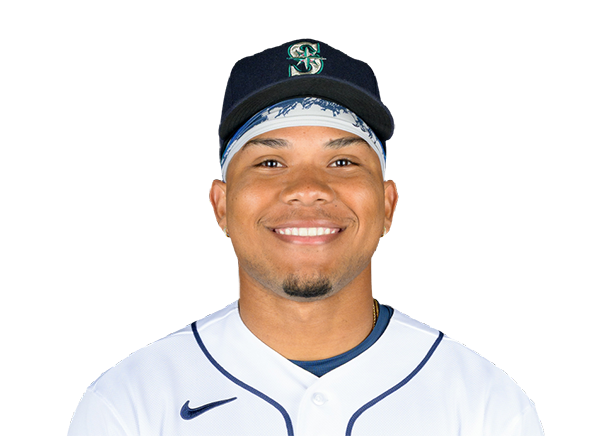 Michael Arroyo | 0-1 | 1 | 1 | 0 | 0 | 0 | 3 | 0 | 17 | .333 | .500 | .778 |
 Cole Young | 0-1 | 1 | 0 | 0 | 0 | 0 | 0 | 0 | 2 | .250 | .312 | .393 |
 Weston Wilson | 1-2 | 2 | 1 | 1 | 0 | 0 | 0 | 0 | 15 | .221 | .302 | .338 |
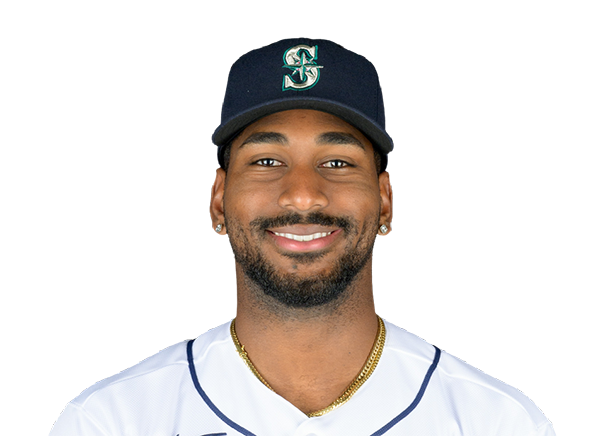 Lazaro Montes | 0-1 | 1 | 0 | 0 | 0 | 0 | 0 | 1 | 5 | .231 | .286 | .615 |
 Brock Rodden | 0-1 | 1 | 0 | 0 | 0 | 0 | 0 | 1 | 3 | .218 | .323 | .309 |
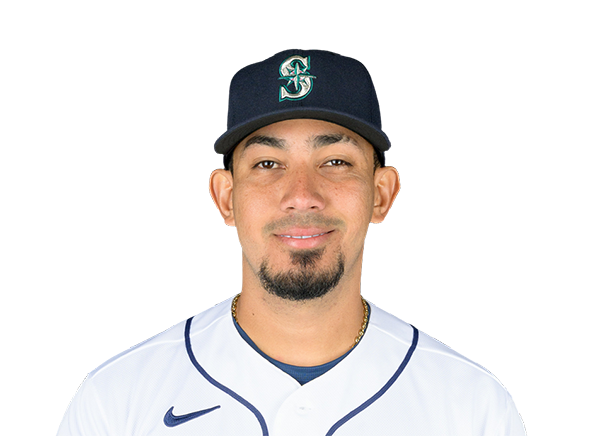 Jhonny Pereda | 2-2 | 2 | 1 | 2 | 2 | 0 | 1 | 0 | 21 | .298 | .355 | .381 |
Athletics
| Player | H-AB | AB | R | H | RBI | HR | BB | K | #P | AVG | OBP | SLG |
|---|---|---|---|---|---|---|---|---|---|---|---|---|
 Henry Bolte | 0-3 | 3 | 1 | 0 | 0 | 0 | 1 | 2 | 27 | .275 | .359 | .398 |
 Jeff McNeil | 1-5 | 5 | 1 | 1 | 0 | 0 | 0 | 0 | 14 | .267 | .316 | .370 |
 Zack Gelof | 2-3 | 3 | 3 | 2 | 2 | 1 | 2 | 0 | 19 | .252 | .319 | .461 |
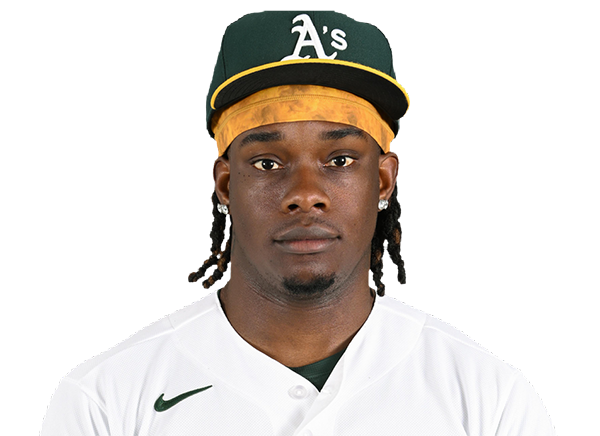 Lawrence Butler | 2-4 | 4 | 2 | 2 | 4 | 2 | 0 | 1 | 22 | .230 | .321 | .387 |
 Max Muncy | 0-3 | 3 | 0 | 0 | 0 | 0 | 0 | 2 | 13 | .232 | .298 | .390 |
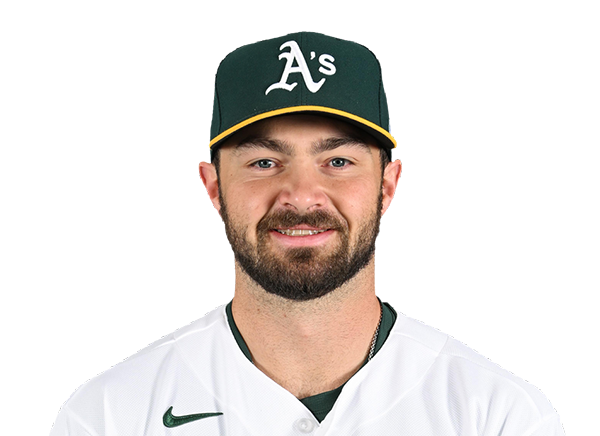 Shea Langeliers | 1-1 | 1 | 0 | 1 | 2 | 0 | 0 | 0 | 3 | .266 | .333 | .497 |
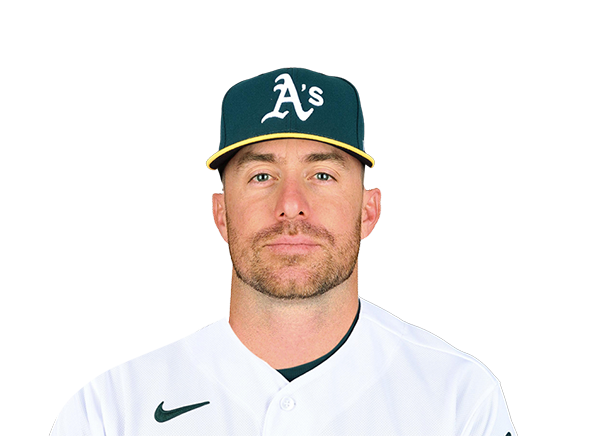 Donovan Walton | 1-4 | 4 | 0 | 1 | 0 | 0 | 0 | 1 | 13 | .271 | .375 | .457 |
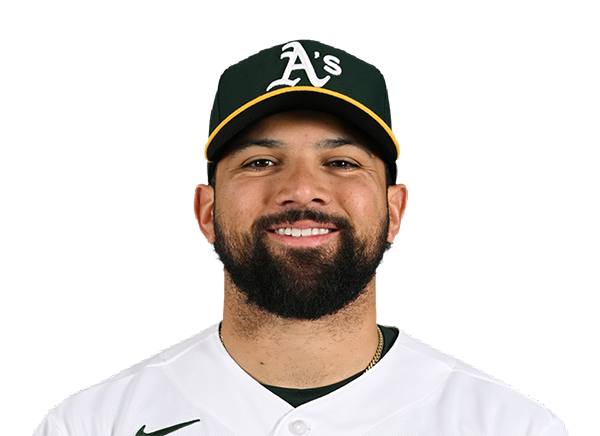 Carlos Cortes | 0-3 | 3 | 0 | 0 | 0 | 0 | 1 | 0 | 12 | .257 | .326 | .395 |
 Brian Serven | 0-3 | 3 | 0 | 0 | 0 | 0 | 1 | 1 | 19 | .203 | .247 | .435 |
 Alika Williams | 2-3 | 3 | 1 | 2 | 0 | 0 | 1 | 0 | 14 | .259 | .298 | .420 |
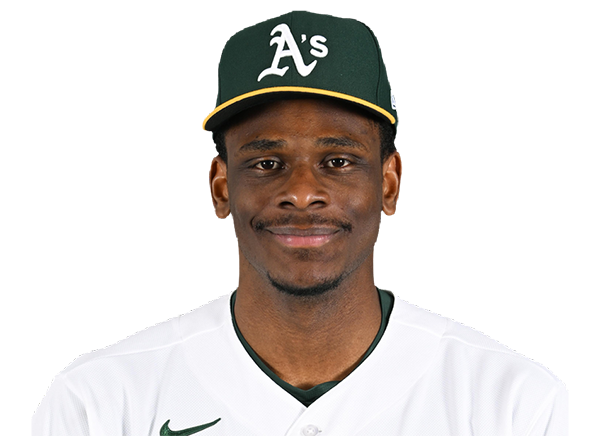 Denzel Clarke | 0-0 | 0 | 0 | 0 | 0 | 0 | 0 | 0 | 0 | .154 | .225 | .169 |
 Michael Stefanic | 0-0 | 0 | 0 | 0 | 0 | 0 | 0 | 0 | 0 | .368 | .429 | .421 |
Seattle Mariners
| Player | IP | H | R | ER | BB | K | HR | PC-ST | ERA | PC |
|---|---|---|---|---|---|---|---|---|---|---|
 Bryce Miller | 5.0 | 2 | 2 | 2 | 5 | 5 | 2 | 91-54 | 4.19 | 91 |
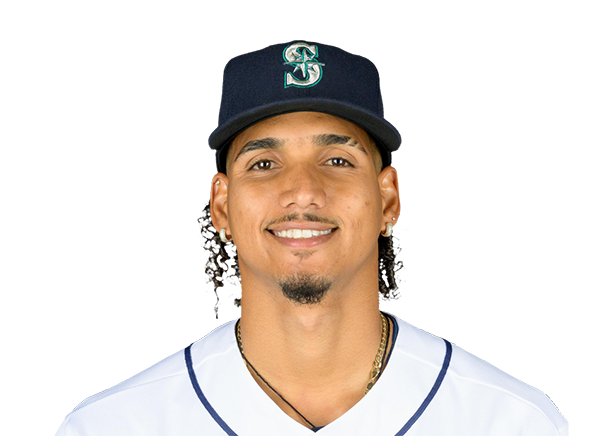 Carlos Vargas | 1.0 | 2 | 2 | 2 | 0 | 1 | 0 | 14-9 | 4.26 | 14 |
 Gabe Speier | 0.1 | 1 | 2 | 2 | 1 | 0 | 0 | 19-12 | 3.02 | 19 |
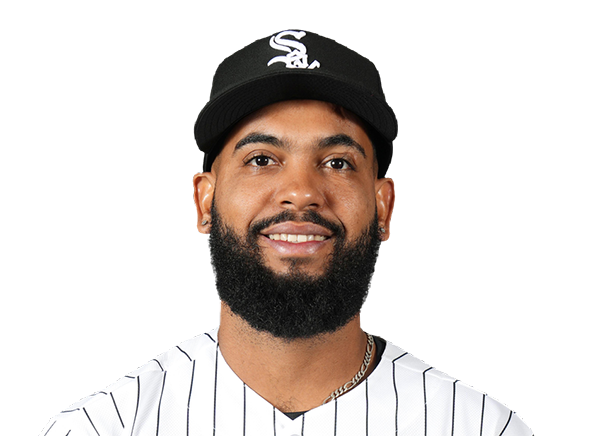 Seranthony Dominguez | 1.0 | 2 | 0 | 0 | 0 | 0 | 0 | 18-11 | 3.97 | 18 |
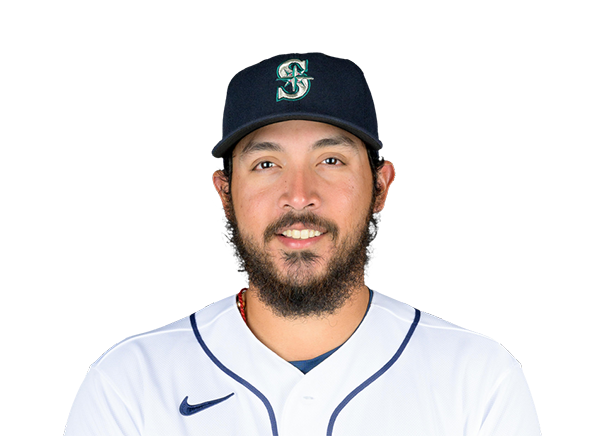 Andres Munoz | 0.2 | 2 | 2 | 2 | 0 | 1 | 1 | 14-8 | 4.25 | 14 |
Athletics
| Player | IP | H | R | ER | BB | K | HR | PC-ST | ERA | PC |
|---|---|---|---|---|---|---|---|---|---|---|
 Jacob Lopez | 3.2 | 6 | 5 | 5 | 3 | 3 | 1 | 102-63 | 5.02 | 102 |
 Scott Blewett | 0.2 | 2 | 1 | 1 | 2 | 0 | 0 | 20-9 | 2.70 | 20 |
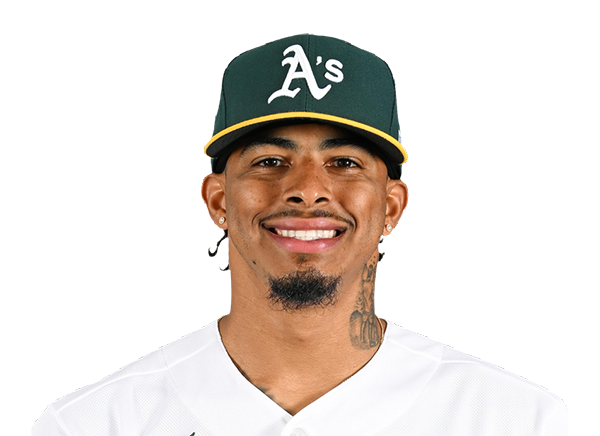 Luis Medina | 0.2 | 0 | 0 | 0 | 1 | 1 | 0 | 15-8 | 3.31 | 15 |
 Geoff Hartlieb | 2.0 | 1 | 0 | 0 | 0 | 2 | 0 | 25-20 | 4.15 | 25 |
 Hogan Harris | 1.0 | 2 | 1 | 1 | 0 | 0 | 1 | 20-11 | 3.43 | 20 |
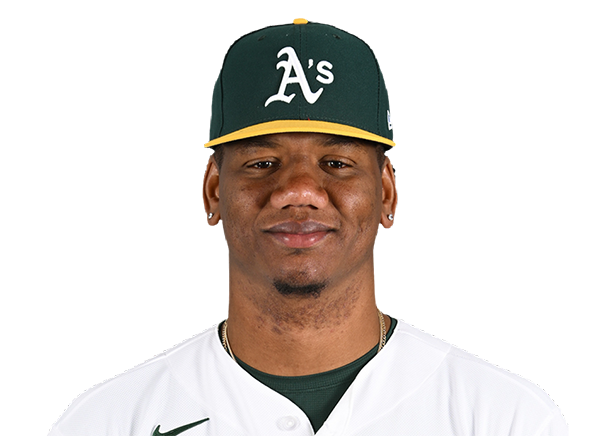 Elvis Alvarado | 1.0 | 1 | 0 | 0 | 0 | 0 | 0 | 14-8 | 3.96 | 14 |
H2H / Season Series
ATH8–7
SEA
ATH1–19
SEA
ATH6–5
SEA
SEA2–0
ATH
SEA2–6
ATH
SEA6–7
ATH
SEA4–7
ATH
ATH1–9
SEA
ATH1–4
SEA
ATH2–9
SEA
Last 5 Games
| Date | Opponent | Result |
|---|---|---|
| Sep 13 | @ ATH | L7–8 |
| Sep 12 | @ ATH | W19–1 |
| Sep 11 | @ ATH | L5–6 |
| Sep 10 |  vs TEX | W4–3 |
| Sep 9 | vs TEX | W3–2 |
| Date | Opponent | Result |
|---|---|---|
| Sep 13 | vs SEA | W8–7 |
| Sep 12 | vs SEA | L1–19 |
| Sep 11 | vs SEA | W6–5 |
| Sep 9 |  vs TOR | W2–0 |
| Sep 8 | vs TOR | L2–4 |
Standings
American League
| Team | W | L | PCT | GB | DIFF | STRK |
|---|---|---|---|---|---|---|
1 Rays | 90 | 59 | .604 | - | +69 | W3 |
2 White Sox | 76 | 73 | .510 | 14 | +34 | L1 |
3 Astros | 75 | 75 | .500 | 15.5 | -53 | L3 |
4 Yankees | 86 | 63 | .577 | 4 | +125 | W1 |
5 Red Sox | 82 | 68 | .547 | 8.5 | +88 | W2 |
6 Guardians | 76 | 74 | .507 | 14.5 | -7 | W1 |
| 7Blue Jays | 75 | 75 | .500 | 15.5 | -31 | W2 |
| 8Rangers | 74 | 76 | .493 | 16.5 | -44 | W2 |
9 Orioles | 72 | 78 | .480 | 18.5 | -35 | L2 |
10 Twins | 70 | 79 | .470 | 20 | -62 | L1 |
11 Tigers | 70 | 79 | .470 | 20 | +70 | W4 |
| 12Mariners | 70 | 80 | .467 | 20.5 | -58 | L1 |
13 Royals | 66 | 84 | .440 | 24.5 | -94 | L2 |
| 14Athletics | 61 | 89 | .407 | 29.5 | -203 | W1 |
15 Angels | 56 | 93 | .376 | 34 | -76 | L3 |
National League
| Team | W | L | PCT | GB | DIFF | STRK |
|---|---|---|---|---|---|---|
1 Brewers | 93 | 57 | .620 | - | +195 | L1 |
2 Dodgers | 90 | 59 | .604 | 2.5 | +170 | L2 |
3 Braves | 88 | 62 | .587 | 5 | +116 | L1 |
4 Cubs | 83 | 67 | .553 | 10 | +138 | L1 |
5 Phillies | 83 | 67 | .553 | 10 | +31 | W1 |
6 Padres | 81 | 68 | .544 | 11.5 | +22 | W7 |
7 Diamondbacks | 79 | 71 | .527 | 14 | +2 | L2 |
8 Pirates | 75 | 75 | .500 | 18 | +26 | W1 |
9 Marlins | 74 | 76 | .493 | 19 | +6 | W2 |
10 Cardinals | 74 | 76 | .493 | 19 | -7 | W1 |
11 Reds | 70 | 79 | .470 | 22.5 | -145 | W1 |
12 Nationals | 70 | 81 | .464 | 23.5 | +3 | W3 |
13 Mets | 69 | 80 | .463 | 23.5 | -34 | L1 |
14 Giants | 62 | 88 | .413 | 31 | -77 | L3 |
15 Rockies | 55 | 94 | .369 | 37.5 | -169 | L7 |
SEA
VS
ATH
Pitchers
Bryce Miller
Catchers
Jhonny Pereda
Infielders
J.P. Crawford
Josh Naylor
Michael Arroyo
Weston Wilson
Outfielders
Randy Arozarena
Dominic Canzone
Julio Rodriguez
Designated Hitters
Cal Raleigh
Pitchers
Jacob Lopez
Catchers
Brian Serven
Infielders
Jeff McNeil
Zack Gelof
Donovan Walton
Alika Williams
Outfielders
Henry Bolte
Lawrence Butler
Carlos Cortes
Designated Hitters
Max Muncy
Mariners
VS
Athletics
Batting
150
Team Games Played
150
4984
At Bats
5090
1157
Hits
1250
590
Runs Batted In
628
173
Home Runs
183
101
Stolen Bases
83
.232
Batting Average
.246
612
Runs
656
186
Doubles
228
16
Triples
14
1894
Total Bases
2055
509
Walks
491
1301
Strikeouts
1276
.312
On Base Percentage
.319
.380
Slugging Percentage
.404
.692
OBP Pct + SLG Pct
.722
150
Games Played
150
0
Games Started
0
88
Hit By Pitch
67
0.0
Wins Above Replacement
0.0
0.0
Offensive Wins Above Replacement
0.0
36
Caught Stealing
29
1
Is Qualified
1
605.4
Runs Created
653.9
4.1
Runs Created Per 27 Outs
4.4
.090
Walks Per Plate Appearance
.086
0.39
Walk To Strikeout Ratio
0.38
.148
Isolated Power
.158
.263
Secondary Average
.265
3.91
Pitches Per Plate Appearance
3.81
375
Extra Base Hits
425
5629
Plate Appearances
5694
28.8
At Bats Per Home Run
27.8
12
Sacrifice Hit
19
35
Sacrifice Flies
25
Pitching
150
Team Games Played
150
64
Quality Starts
30
70
Wins
61
80
Losses
89
33
Saves
37
77
Holds
83
1263
Hits
1403
621
Earned runs
800
185
Home Runs
225
399
Walks
592
1273
Strikeouts
1253
8.7
Strikeouts Per 9 Innings
8.5
0.0
Pitches Per Start
0.0
1.25
Walks Plus Hits Per Inning Pitched
1.50
4.22
Earned Run Average
5.42
80
Losses
89
1324.1
Innings pitched
1328.0
.467
Win Percentage
.407
58
Save Opportunities
65
.250
Opponent Batting Average
.271
.311
Opponent's On-base pct.
.350
.413
Opponent's Slugging pct.
.463
.724
Opponent's OPB Pct + SLG Pct
.812
5048
At Bats
5184
238
Doubles
273
14
Triples
24
65
Batters Hit
70
110
Stolen Bases
98
150
Games Played
150
1
Complete Games
1
0
Shutouts
0
35
Wild Pitches
46
0
Runs Batted In
0
5
Balks
8
1324.1
Innings pitched
1328.0
8.7
Strikeouts Per 9 Innings
8.5
30
Caught Stealing
38
150
Games Started
150
0.0
Wins Above Replacement
0.0
1
Is Qualified
1
670
Runs
859
613
Earned Runs
793
2084
Total Bases
2399
Fielding
150
Team Games Played
150
1324
Full Innings
1328
5292
Total Chances
5203
3973
Putouts
3984
1241
Assists
1148
78
Errors
71
186
Double Plays
228
0.985
Fielding Percentage
0.986
35.4
Range Factor
34.8
0.0
Zone Rating
0.0
150
Games Played
150
0
Games Started
0
0.0
Defensive Wins Above Replacement
0.0
1
Qualified
1