

Mariners vs Rockies Live Score (19 Sep, 2026)
Game Information
Stage
STD
Season
2026
First Pitch
Fri, Sep 18, 8:10 pm
Venue
Coors Field
Location
Denver, Colorado
Venue Type
Outdoor
Broadcast
MLB.TV
Attendance
40,203
Live Situation
1Balls
3Strikes
0Outs
—Pitcher
—At Bat
Pitch Sequence
1
STRIKE FOUL
Changeup
93 MPH
2
STRIKE FOUL
Four-seam FB
101 MPH
3
BALL
Changeup
95 MPH
4
STRIKE SWINGING
Slider
89 MPH
Injury Report

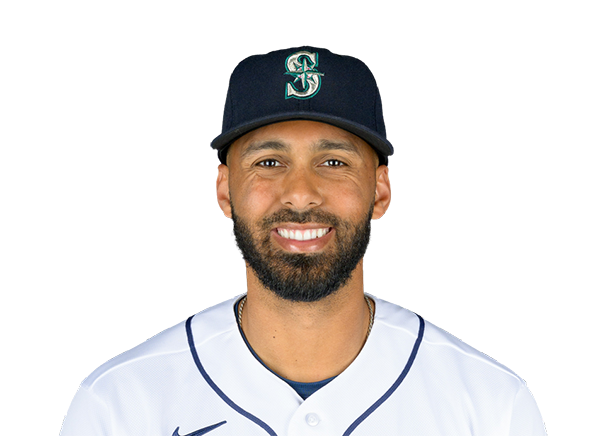



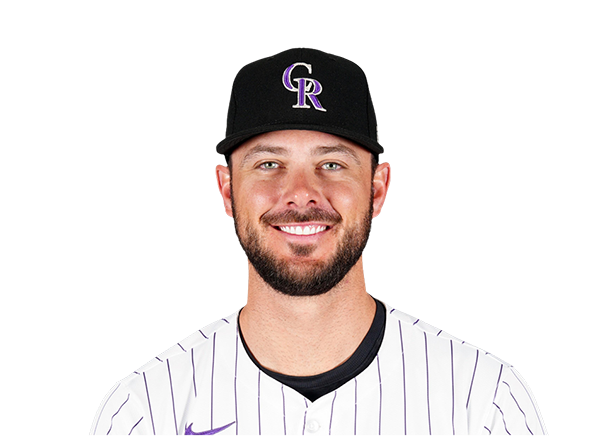
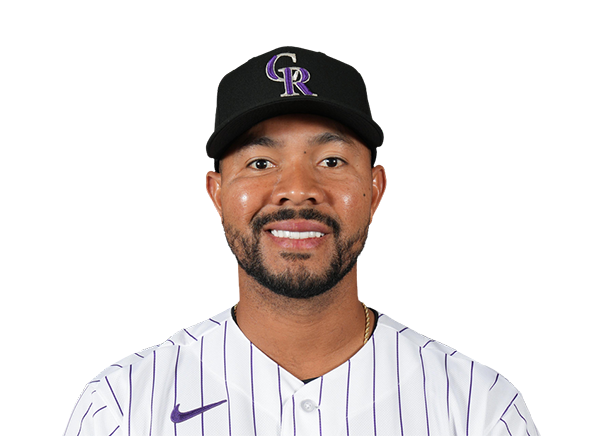


Team Stats
 SEA
COL


5
Runs
4
9
Hits
15
1
Errors
0
2
Home Runs
0
2
Walks
1
9
Strikeouts
9
Player Box Score
Seattle Mariners
| Player | H-AB | AB | R | H | RBI | HR | BB | K | #P | AVG | OBP | SLG |
|---|---|---|---|---|---|---|---|---|---|---|---|---|
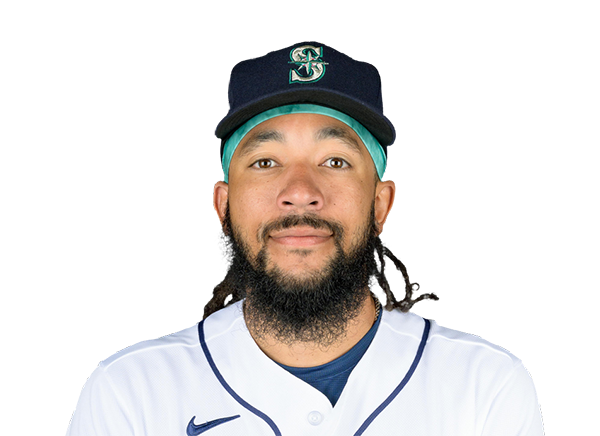 J.P. Crawford | 1-4 | 4 | 1 | 1 | 1 | 1 | 0 | 1 | 20 | .224 | .341 | .357 |
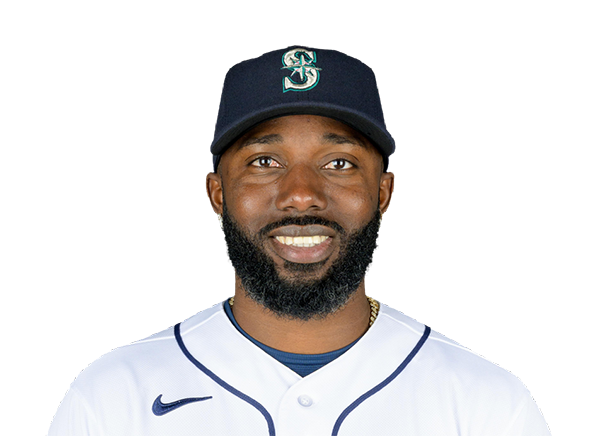 Randy Arozarena | 3-4 | 4 | 1 | 3 | 0 | 0 | 0 | 0 | 20 | .281 | .378 | .480 |
 Dominic Canzone | 1-3 | 3 | 1 | 1 | 1 | 0 | 1 | 0 | 13 | .258 | .328 | .482 |
 Cal Raleigh | 0-4 | 4 | 0 | 0 | 0 | 0 | 0 | 4 | 23 | .181 | .293 | .369 |
 Julio Rodriguez | 0-4 | 4 | 0 | 0 | 0 | 0 | 0 | 1 | 16 | .241 | .302 | .394 |
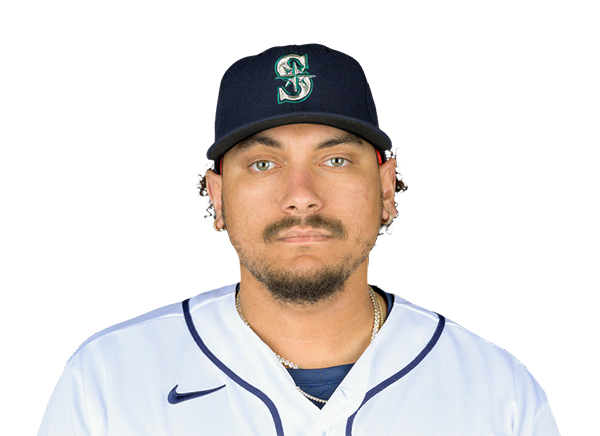 Josh Naylor | 1-4 | 4 | 0 | 1 | 2 | 0 | 0 | 0 | 12 | .272 | .327 | .364 |
 Cole Young | 1-4 | 4 | 0 | 1 | 0 | 0 | 0 | 0 | 11 | .247 | .309 | .387 |
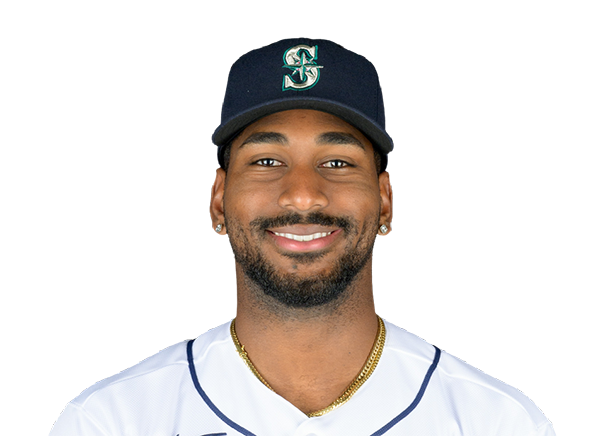 Lazaro Montes | 1-4 | 4 | 1 | 1 | 1 | 1 | 0 | 1 | 15 | .250 | .314 | .656 |
 Brock Rodden | 0-1 | 1 | 0 | 0 | 0 | 0 | 1 | 1 | 8 | .207 | .319 | .293 |
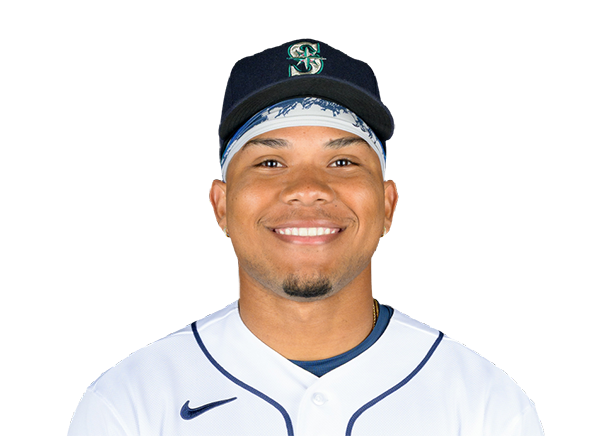 Michael Arroyo | 1-2 | 2 | 1 | 1 | 0 | 0 | 0 | 1 | 4 | .333 | .450 | .667 |
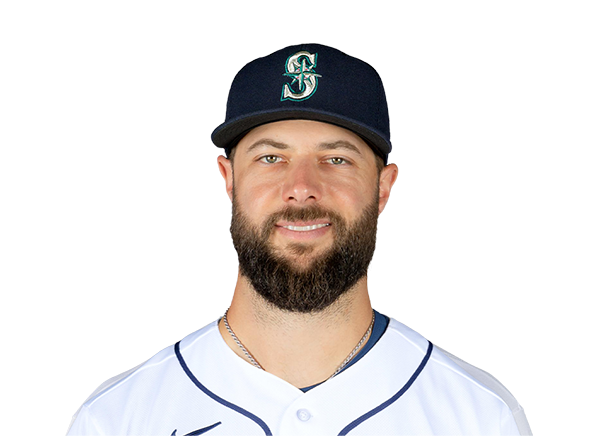 Weston Wilson | 0-0 | 0 | 0 | 0 | 0 | 0 | 0 | 0 | 0 | .219 | .302 | .331 |
Colorado Rockies
| Player | H-AB | AB | R | H | RBI | HR | BB | K | #P | AVG | OBP | SLG |
|---|---|---|---|---|---|---|---|---|---|---|---|---|
 Jake McCarthy | 3-5 | 5 | 1 | 3 | 2 | 0 | 0 | 1 | 20 | .298 | .342 | .490 |
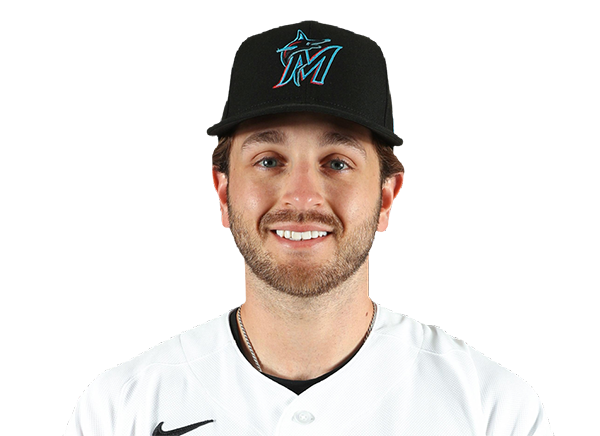 Connor Norby | 3-4 | 4 | 1 | 3 | 1 | 0 | 1 | 0 | 16 | .242 | .343 | .381 |
 TJ Rumfield | 1-5 | 5 | 0 | 1 | 0 | 0 | 0 | 2 | 16 | .300 | .392 | .453 |
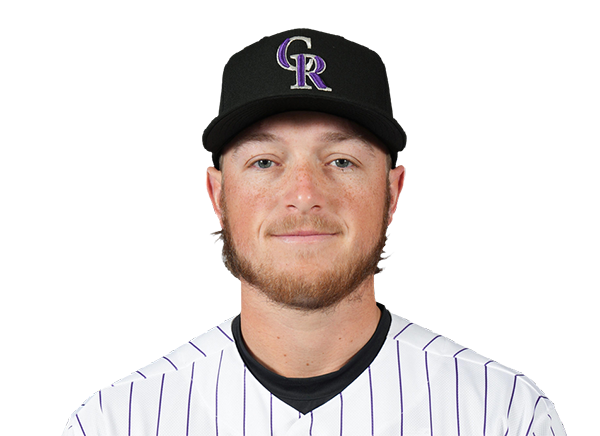 Hunter Goodman | 1-5 | 5 | 0 | 1 | 0 | 0 | 0 | 0 | 21 | .244 | .311 | .526 |
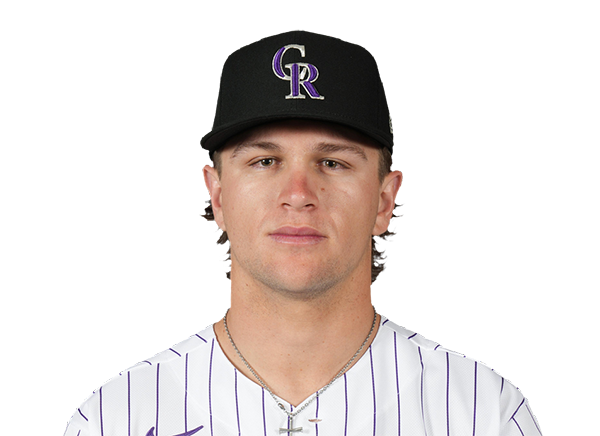 Cole Carrigg | 3-5 | 5 | 0 | 3 | 1 | 0 | 0 | 1 | 23 | .272 | .337 | .467 |
 Kyle Karros | 1-5 | 5 | 0 | 1 | 0 | 0 | 0 | 2 | 18 | .259 | .352 | .422 |
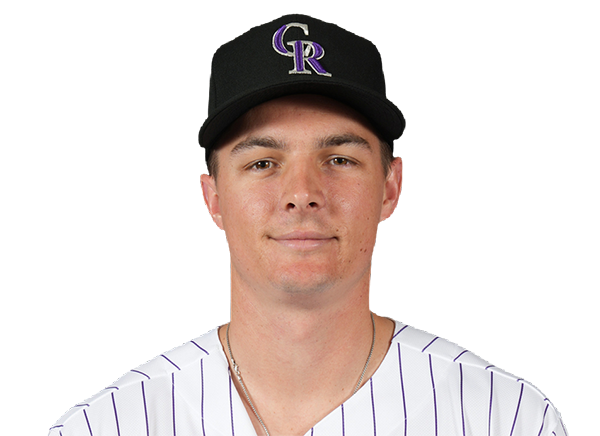 Mickey Moniak | 1-5 | 5 | 0 | 1 | 0 | 0 | 0 | 2 | 16 | .244 | .285 | .488 |
 Adael Amador | 0-4 | 4 | 0 | 0 | 0 | 0 | 0 | 0 | 14 | .270 | .352 | .508 |
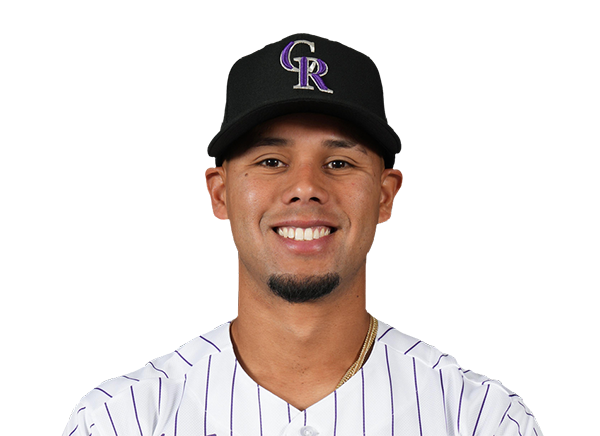 Ezequiel Tovar | 2-4 | 4 | 2 | 2 | 0 | 0 | 0 | 1 | 14 | .217 | .264 | .342 |
Seattle Mariners
| Player | IP | H | R | ER | BB | K | HR | PC-ST | ERA | PC |
|---|---|---|---|---|---|---|---|---|---|---|
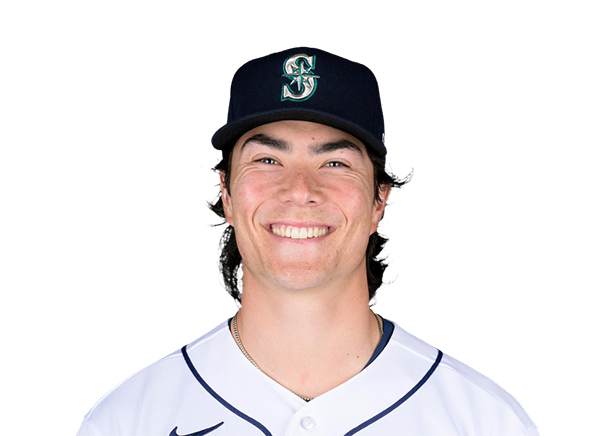 Bryan Woo | 5.1 | 10 | 3 | 3 | 1 | 4 | 0 | 86-56 | 3.92 | 86 |
 Gabe Speier | 0.1 | 2 | 1 | 1 | 0 | 0 | 0 | 13-7 | 3.14 | 13 |
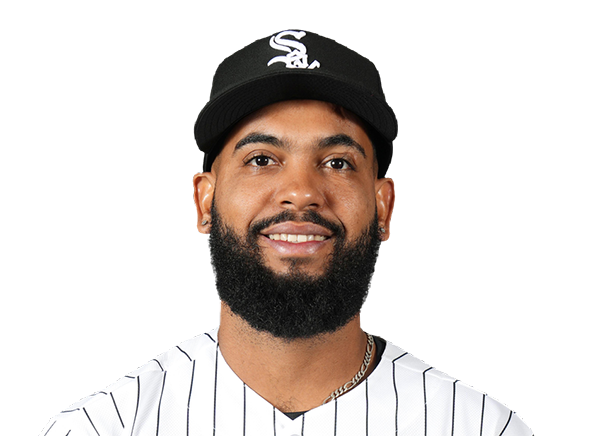 Seranthony Dominguez | 1.1 | 1 | 0 | 0 | 0 | 2 | 0 | 24-17 | 3.81 | 24 |
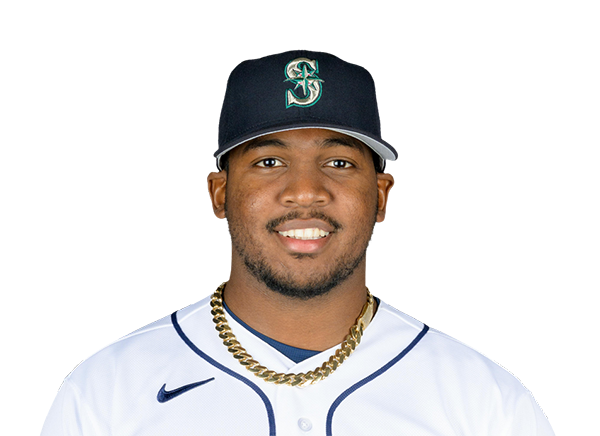 Jose Ferrer | 0.2 | 1 | 0 | 0 | 0 | 1 | 0 | 12-8 | 3.67 | 12 |
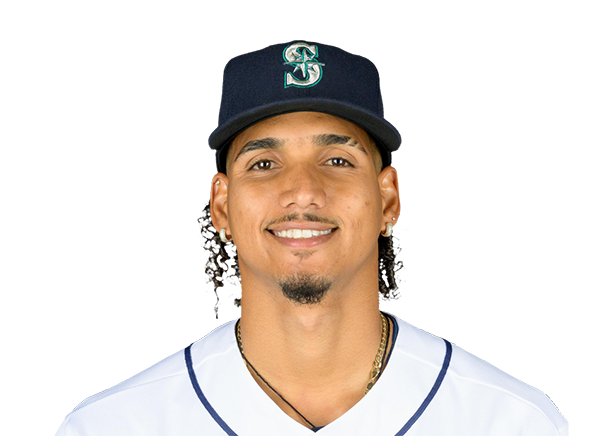 Carlos Vargas | 0.1 | 0 | 0 | 0 | 0 | 0 | 0 | 6-4 | 3.77 | 6 |
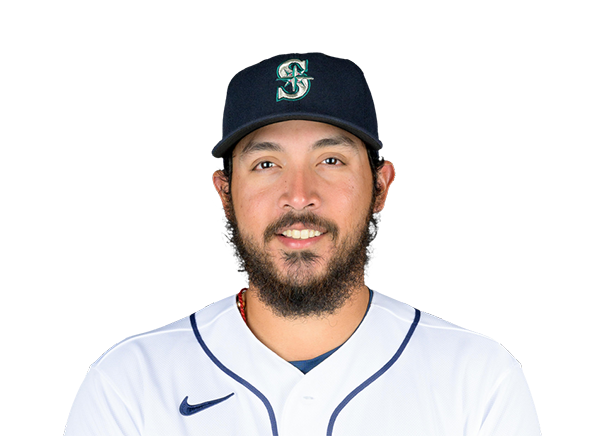 Andres Munoz | 1.0 | 1 | 0 | 0 | 0 | 2 | 0 | 17-11 | 4.11 | 17 |
Colorado Rockies
| Player | IP | H | R | ER | BB | K | HR | PC-ST | ERA | PC |
|---|---|---|---|---|---|---|---|---|---|---|
 Gabriel Hughes | 4.2 | 5 | 3 | 3 | 1 | 6 | 1 | 95-63 | 6.33 | 95 |
 Mark Manfredi | 1.1 | 1 | 0 | 0 | 1 | 1 | 0 | 17-10 | 3.29 | 17 |
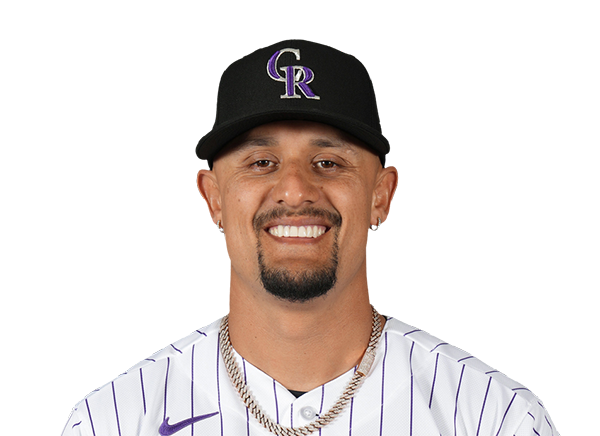 Brennan Bernardino | 1.0 | 1 | 1 | 1 | 0 | 1 | 0 | 12-8 | 2.93 | 12 |
 Jaden Hill | 1.0 | 0 | 0 | 0 | 0 | 0 | 0 | 7-5 | 5.50 | 7 |
 Jordan Romano | 1.0 | 2 | 1 | 1 | 0 | 1 | 1 | 11-10 | 5.12 | 11 |
H2H / Season Series
COL4–5
SEA
COL6–10
SEA
SEA7–11
COL
Last 5 Games
| Date | Opponent | Result |
|---|---|---|
| Sep 18 | @ COL | W5–4 |
| Sep 16 |  @ LAA | W7–2 |
| Sep 15 | @ LAA | L1–2 |
| Sep 14 | @ LAA | L4–6 |
| Sep 13 |  @ ATH | L7–8 |
| Date | Opponent | Result |
|---|---|---|
| Sep 18 | vs SEA | L4–5 |
| Sep 17 |  vs SD | L2–9 |
| Sep 16 | vs SD | L3–9 |
| Sep 15 | vs SD | W9–3 |
| Sep 14 | vs SD | L7–8 |
Standings
American League
| Team | W | L | PCT | GB | DIFF | STRK |
|---|---|---|---|---|---|---|
1 Rays | 93 | 60 | .608 | - | +78 | L1 |
2 Guardians | 79 | 75 | .513 | 14.5 | -5 | W3 |
3 Astros | 77 | 77 | .500 | 16.5 | -54 | L1 |
4 Yankees | 89 | 64 | .582 | 4 | +143 | W1 |
5 Red Sox | 84 | 70 | .545 | 9.5 | +85 | W2 |
6 White Sox | 78 | 76 | .506 | 15.5 | +33 | L1 |
7 Rangers | 77 | 77 | .500 | 16.5 | -33 | W1 |
8 Blue Jays | 76 | 78 | .494 | 17.5 | -43 | L1 |
9 Orioles | 75 | 79 | .487 | 18.5 | -27 | L1 |
10 Tigers | 73 | 81 | .474 | 20.5 | +77 | W1 |
| 11Mariners | 72 | 82 | .468 | 21.5 | -55 | W2 |
12 Twins | 72 | 82 | .468 | 21.5 | -71 | W1 |
13 Royals | 67 | 87 | .435 | 26.5 | -100 | L2 |
| 14Athletics | 61 | 93 | .396 | 32.5 | -216 | L4 |
| 15Angels | 59 | 95 | .383 | 34.5 | -80 | L1 |
National League
| Team | W | L | PCT | GB | DIFF | STRK |
|---|---|---|---|---|---|---|
1 Brewers | 96 | 58 | .623 | - | +198 | W1 |
2 Dodgers | 94 | 60 | .610 | 2 | +185 | W2 |
3 Braves | 90 | 64 | .584 | 6 | +115 | W1 |
4 Phillies | 85 | 69 | .552 | 11 | +31 | L1 |
5 Cubs | 85 | 69 | .552 | 11 | +141 | L1 |
| 6Padres | 85 | 69 | .552 | 11 | +36 | W3 |
7 Diamondbacks | 80 | 74 | .519 | 16 | -7 | L3 |
8 Pirates | 77 | 77 | .500 | 19 | +27 | W2 |
9 Marlins | 76 | 78 | .494 | 20 | +2 | L1 |
10 Cardinals | 75 | 79 | .487 | 21 | -22 | L3 |
11 Nationals | 72 | 82 | .468 | 24 | +11 | W1 |
12 Reds | 72 | 82 | .468 | 24 | -152 | W1 |
13 Mets | 70 | 84 | .455 | 26 | -43 | W1 |
14 Giants | 64 | 90 | .416 | 32 | -76 | L1 |
| 15Rockies | 56 | 98 | .364 | 40 | -178 | L3 |
SEA
VS
COL
Pitchers
Bryan Woo
Catchers
Cal Raleigh
Infielders
J.P. Crawford
Josh Naylor
Cole Young
Brock Rodden
Outfielders
Randy Arozarena
Julio Rodriguez
Lazaro Montes
Designated Hitters
Dominic Canzone
Pitchers
Gabriel Hughes
Catchers
Hunter Goodman
Infielders
TJ Rumfield
Kyle Karros
Adael Amador
Ezequiel Tovar
Outfielders
Jake McCarthy
Cole Carrigg
Mickey Moniak
Designated Hitters
Connor Norby
Mariners
VS
Rockies
Batting
154
Team Games Played
154
5119
At Bats
5249
1190
Hits
1337
606
Runs Batted In
691
177
Home Runs
169
107
Stolen Bases
107
.232
Batting Average
.255
629
Runs
721
195
Doubles
273
17
Triples
38
1950
Total Bases
2193
521
Walks
483
1338
Strikeouts
1339
.312
On Base Percentage
.324
.381
Slugging Percentage
.418
.693
OBP Pct + SLG Pct
.742
154
Games Played
154
154
Games Started
154
91
Hit By Pitch
78
0.0
Wins Above Replacement
0.0
0.0
Offensive Wins Above Replacement
0.0
36
Caught Stealing
39
1
Is Qualified
1
624.3
Runs Created
722.8
4.1
Runs Created Per 27 Outs
4.7
.090
Walks Per Plate Appearance
.082
0.39
Walk To Strikeout Ratio
0.36
.148
Isolated Power
.163
.264
Secondary Average
.268
3.90
Pitches Per Plate Appearance
3.75
389
Extra Base Hits
480
5782
Plate Appearances
5880
28.9
At Bats Per Home Run
31.1
13
Sacrifice Hit
21
37
Sacrifice Flies
48
Pitching
154
Team Games Played
154
65
Quality Starts
23
72
Wins
56
82
Losses
98
34
Saves
32
77
Holds
60
1304
Hits
1558
635
Earned runs
843
186
Home Runs
213
409
Walks
514
1310
Strikeouts
1058
8.7
Strikeouts Per 9 Innings
7.0
142.8
Pitches Per Start
149.7
1.26
Walks Plus Hits Per Inning Pitched
1.53
4.21
Earned Run Average
5.61
82
Losses
98
1358.1
Innings pitched
1351.2
.468
Win Percentage
.364
60
Save Opportunities
57
.251
Opponent Batting Average
.289
.312
Opponent's On-base pct.
.353
.412
Opponent's Slugging pct.
.491
.724
Opponent's OPB Pct + SLG Pct
.844
5187
At Bats
5391
241
Doubles
344
17
Triples
52
68
Batters Hit
59
118
Stolen Bases
126
154
Games Played
154
1
Complete Games
1
10
Shutouts
1
36
Wild Pitches
45
649
Runs Batted In
862
4
Balks
5
1358.1
Innings pitched
1351.2
8.7
Strikeouts Per 9 Innings
7.0
31
Caught Stealing
26
154
Games Started
154
0.0
Wins Above Replacement
0.0
1
Is Qualified
1
684
Runs
899
635
Earned Runs
843
2137
Total Bases
2645
Fielding
154
Team Games Played
154
1358
Full Innings
1352
5427
Total Chances
5434
4075
Putouts
4055
1272
Assists
1284
80
Errors
95
195
Double Plays
273
0.985
Fielding Percentage
0.983
35.4
Range Factor
35.5
0.0
Zone Rating
0.0
154
Games Played
154
0
Games Started
0
0.0
Defensive Wins Above Replacement
0.0
1
Qualified
1