

Mariners vs Tigers Live Score (6 Jun, 2026)
Game Information
Stage
Standard
Season
2026
First Pitch
Sat, Jun 6, 1:10 pm
Venue
Comerica Park
Location
Detroit, Michigan
Attendance
32,606
Live Situation
2Balls
2Strikes
0Outs
—Pitcher
—At Bat
Pitch Sequence
1
STRIKE FOUL
Four-seam FB
96 MPH
2
BALL
Sinker
96 MPH
3
STRIKE FOUL
Four-seam FB
96 MPH
4
BALL
Four-seam FB
96 MPH
5
BALL IN PLAY
Four-seam FB
96 MPH
Injury Report





Team Stats
 SEA
DET


4
Runs
0
10
Hits
2
0
Errors
0
1
Home Runs
0
1
Walks
5
7
Strikeouts
11
Player Box Score
Seattle Mariners
| Player | H-AB | AB | R | H | RBI | HR | BB | K | #P | AVG | OBP | SLG |
|---|---|---|---|---|---|---|---|---|---|---|---|---|
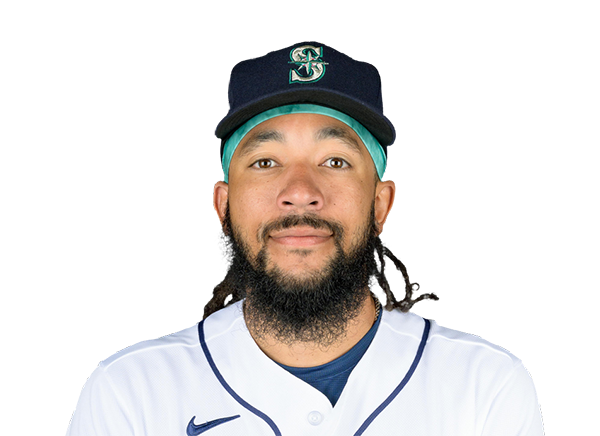
 Cole Young | 1-4 | 4 | 0 | 1 | 0 | 0 | 0 | 0 | 11 | .250 | .323 | .355 |
 Julio Rodriguez | 1-5 | 5 | 1 | 1 | 0 | 0 | 0 | 1 | 19 | .259 | .315 | .460 |
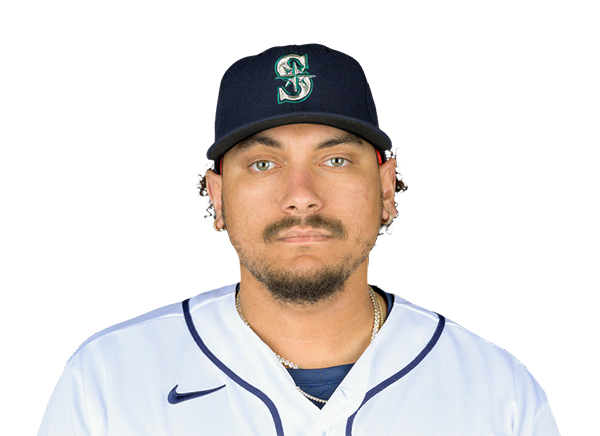 Josh Naylor | 1-4 | 4 | 1 | 1 | 0 | 0 | 0 | 1 | 12 | .254 | .319 | .356 |
 Randy Arozarena | 2-3 | 3 | 1 | 2 | 2 | 0 | 1 | 0 | 12 | .285 | .372 | .444 |
 Luke Raley | 0-4 | 4 | 0 | 0 | 0 | 0 | 0 | 1 | 21 | .253 | .315 | .530 |
 Dominic Canzone | 3-4 | 4 | 1 | 3 | 2 | 1 | 0 | 1 | 16 | .275 | .342 | .529 |
 Patrick Wisdom | 0-4 | 4 | 0 | 0 | 0 | 0 | 0 | 2 | 14 | .120 | .154 | .280 |
 Colt Emerson | 0-4 | 4 | 0 | 0 | 0 | 0 | 0 | 1 | 17 | .237 | .308 | .542 |
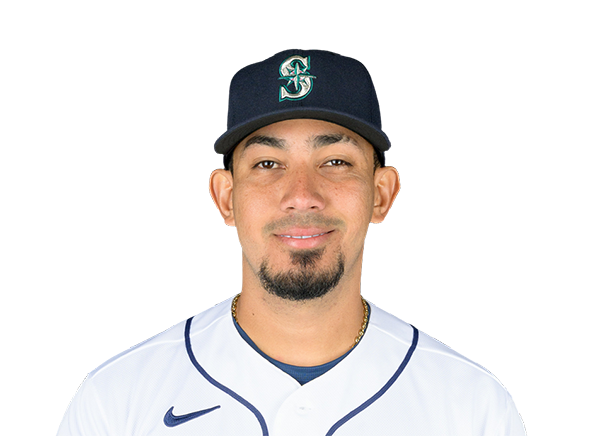 Jhonny Pereda | 2-4 | 4 | 0 | 2 | 0 | 0 | 0 | 0 | 14 | .295 | .367 | .432 |
Detroit Tigers
| Player | H-AB | AB | R | H | RBI | HR | BB | K | #P | AVG | OBP | SLG |
|---|---|---|---|---|---|---|---|---|---|---|---|---|
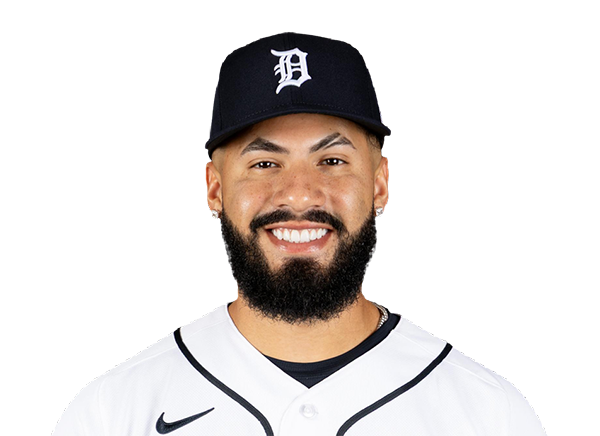 Gleyber Torres | 0-4 | 4 | 0 | 0 | 0 | 0 | 0 | 4 | 20 | .278 | .395 | .376 |
 Kevin McGonigle | 1-3 | 3 | 0 | 1 | 0 | 0 | 1 | 0 | 16 | .288 | .390 | .412 |
 Dillon Dingler | 0-3 | 3 | 0 | 0 | 0 | 0 | 1 | 0 | 10 | .238 | .321 | .495 |
 Kerry Carpenter | 0-1 | 1 | 0 | 0 | 0 | 0 | 1 | 1 | 17 | .237 | .311 | .500 |
 Jahmai Jones | 0-1 | 1 | 0 | 0 | 0 | 0 | 1 | 0 | 9 | .143 | .233 | .247 |
 Riley Greene | 0-4 | 4 | 0 | 0 | 0 | 0 | 0 | 1 | 12 | .309 | .399 | .453 |
 Spencer Torkelson | 0-3 | 3 | 0 | 0 | 0 | 0 | 0 | 2 | 14 | .211 | .312 | .404 |
 Colt Keith | 1-3 | 3 | 0 | 1 | 0 | 0 | 0 | 1 | 11 | .269 | .310 | .337 |
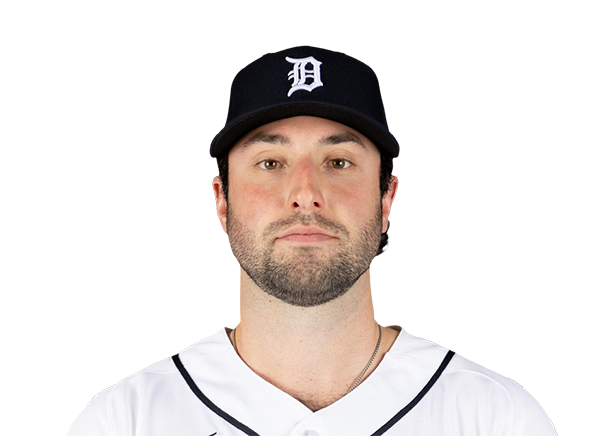 Matt Vierling | 0-3 | 3 | 0 | 0 | 0 | 0 | 0 | 0 | 12 | .215 | .279 | .362 |
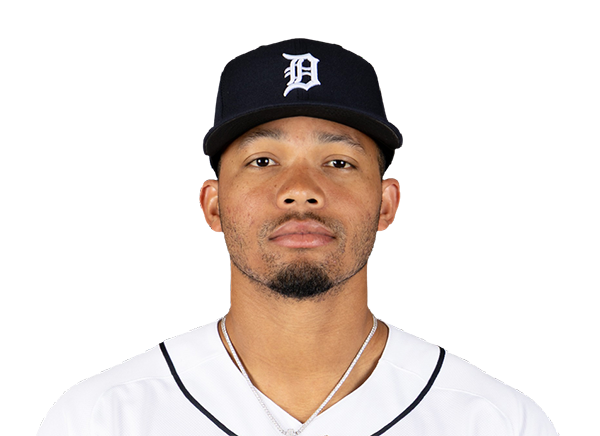 Wenceel Perez | 0-2 | 2 | 0 | 0 | 0 | 0 | 1 | 2 | 19 | .168 | .230 | .315 |
Seattle Mariners
| Player | IP | H | R | ER | BB | K | HR | PC-ST | ERA | PC |
|---|---|---|---|---|---|---|---|---|---|---|
 Bryce Miller | 6.0 | 1 | 0 | 0 | 2 | 9 | 0 | 94-64 | 1.33 | 94 |
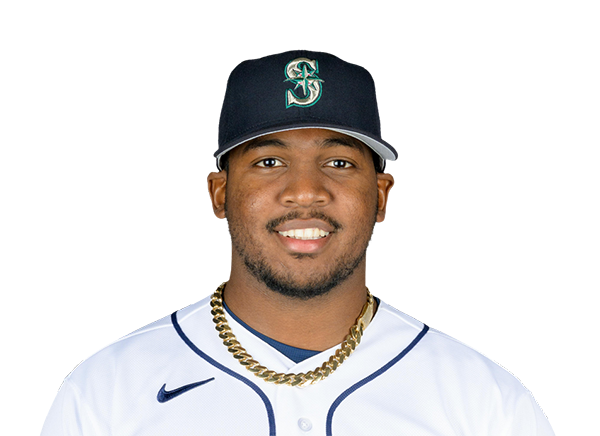 Jose Ferrer | 1.0 | 0 | 0 | 0 | 1 | 1 | 0 | 15-8 | 1.57 | 15 |
 Matt Brash | 1.0 | 0 | 0 | 0 | 1 | 1 | 0 | 17-9 | 0.56 | 17 |
 Gabe Speier | 1.0 | 1 | 0 | 0 | 1 | 0 | 0 | 14-7 | 2.30 | 14 |
Detroit Tigers
| Player | IP | H | R | ER | BB | K | HR | PC-ST | ERA | PC |
|---|---|---|---|---|---|---|---|---|---|---|
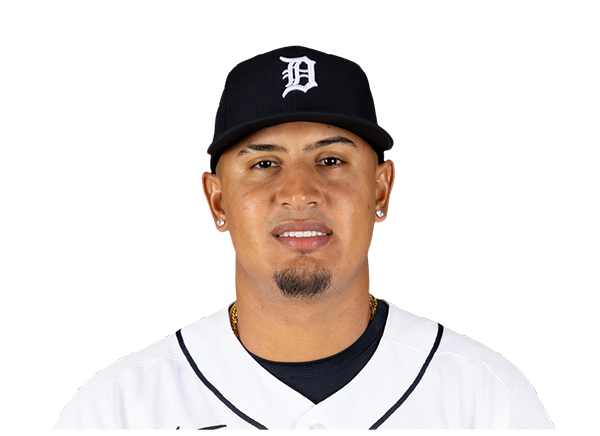 Keider Montero | 5.0 | 6 | 4 | 4 | 1 | 1 | 1 | 79-55 | 3.95 | 79 |
 Drew Sommers | 1.1 | 0 | 0 | 0 | 0 | 3 | 0 | 18-12 | 0.00 | 18 |
 Ty Madden | 2.2 | 4 | 0 | 0 | 0 | 3 | 0 | 39-26 | 2.60 | 39 |
H2H / Season Series
SEA0–11
DET
SEA4–2
DET
SEA0–8
DET
DET5–4
SEA
DET0–4
SEA
DET7–3
SEA
Last 5 Games
| Date | Opponent | Result |
|---|---|---|
| Aug 22 |  vs CHC | W5–4 |
| Aug 21 | vs CHC | W6–5 |
| Aug 20 |  @ MIL | L4–7 |
| Aug 19 | @ MIL | W7–5 |
| Aug 18 | @ MIL | L0–22 |
| Date | Opponent | Result |
|---|---|---|
| Aug 22 |  @ KC | L1–3 |
| Aug 21 | @ KC | L2–5 |
| Aug 19 |  @ PIT | L3–4 |
| Aug 18 | @ PIT | L1–4 |
| Aug 17 | @ PIT | W8–5 |
Standings
American League
| Team | W | L | PCT | GB | DIFF | STRK |
|---|---|---|---|---|---|---|
1 Rays | 76 | 52 | .594 | - | +43 | L2 |
2 White Sox | 67 | 61 | .523 | 9 | +47 | W1 |
3 Astros | 65 | 64 | .504 | 11.5 | -42 | W1 |
4 Yankees | 73 | 56 | .566 | 3.5 | +95 | L1 |
5 Red Sox | 69 | 59 | .539 | 7 | +97 | W1 |
6 Rangers | 64 | 66 | .492 | 13 | -48 | L1 |
7 Blue Jays | 64 | 67 | .489 | 13.5 | -50 | W1 |
8 Twins | 63 | 66 | .488 | 13.5 | -45 | L1 |
9 Guardians | 63 | 66 | .488 | 13.5 | -15 | W2 |
10 Orioles | 62 | 67 | .481 | 14.5 | -34 | W1 |
| 11Tigers | 61 | 68 | .473 | 15.5 | +77 | L4 |
| 12Mariners | 61 | 68 | .473 | 15.5 | -45 | W1 |
| 13Royals | 57 | 74 | .435 | 20.5 | -95 | W7 |
14 Angels | 52 | 78 | .400 | 25 | -68 | W1 |
15 Athletics | 49 | 80 | .380 | 27.5 | -189 | L5 |
National League
| Team | W | L | PCT | GB | DIFF | STRK |
|---|---|---|---|---|---|---|
| 1Brewers | 81 | 49 | .623 | - | +163 | W3 |
2 Dodgers | 78 | 51 | .605 | 2.5 | +146 | W4 |
3 Braves | 75 | 55 | .577 | 6 | +108 | L2 |
| 4Cubs | 74 | 55 | .574 | 6.5 | +99 | L2 |
5 Phillies | 72 | 58 | .554 | 9 | +25 | W8 |
6 Padres | 69 | 60 | .535 | 11.5 | +7 | W1 |
7 Diamondbacks | 68 | 61 | .527 | 12.5 | +13 | W2 |
8 Marlins | 66 | 64 | .508 | 15 | +17 | W2 |
9 Cardinals | 66 | 65 | .504 | 15.5 | 0 | L2 |
| 10Pirates | 63 | 67 | .485 | 18 | +30 | L1 |
11 Reds | 61 | 68 | .473 | 19.5 | -98 | L2 |
12 Nationals | 61 | 70 | .466 | 20.5 | +14 | L3 |
13 Mets | 58 | 71 | .450 | 22.5 | -44 | L1 |
14 Giants | 52 | 76 | .406 | 28 | -78 | L2 |
15 Rockies | 50 | 78 | .391 | 30 | -130 | L4 |
SEA
VS
DET
Pitchers
Bryce Miller
Jose Ferrer
Matt Brash
Gabe Speier
Catchers
Jhonny Pereda
Infielders
Cole Young
Josh Naylor
Patrick Wisdom
Colt Emerson
Outfielders
Julio Rodriguez
Randy Arozarena
Luke Raley
Designated Hitters
Dominic Canzone
Pitchers
Keider Montero
Drew Sommers
Ty Madden
Catchers
Dillon Dingler
Infielders
Gleyber Torres
Kevin McGonigle
Spencer Torkelson
Colt Keith
Outfielders
Riley Greene
Matt Vierling
Wenceel Perez
Designated Hitters
Kerry Carpenter
Jahmai Jones
Mariners
VS
Tigers
Batting
129
Team Games Played
128
4271
At Bats
4322
980
Hits
1047
489
Runs Batted In
552
146
Home Runs
152
89
Stolen Bases
36
.229
Batting Average
.242
506
Runs
579
156
Doubles
196
13
Triples
26
1600
Total Bases
1751
432
Walks
458
1110
Strikeouts
1094
.309
On Base Percentage
.319
.375
Slugging Percentage
.405
.684
OBP Pct + SLG Pct
.724
129
Games Played
128
129
Games Started
128
77
Hit By Pitch
48
0.0
Wins Above Replacement
0.0
0.0
Offensive Wins Above Replacement
0.0
34
Caught Stealing
18
1
Is Qualified
1
505.5
Runs Created
568.9
4.0
Runs Created Per 27 Outs
4.5
.090
Walks Per Plate Appearance
.094
0.39
Walk To Strikeout Ratio
0.42
.145
Isolated Power
.163
.259
Secondary Average
.273
3.91
Pitches Per Plate Appearance
3.92
315
Extra Base Hits
374
4822
Plate Appearances
4876
29.3
At Bats Per Home Run
28.4
10
Sacrifice Hit
6
31
Sacrifice Flies
37
Pitching
129
Team Games Played
128
57
Quality Starts
48
61
Wins
61
68
Losses
67
29
Saves
26
69
Holds
60
1072
Hits
982
507
Earned runs
448
147
Home Runs
130
328
Walks
395
1096
Strikeouts
1047
8.7
Strikeouts Per 9 Innings
8.3
142.1
Pitches Per Start
141.7
1.23
Walks Plus Hits Per Inning Pitched
1.21
4.01
Earned Run Average
3.56
68
Losses
67
1139.0
Innings pitched
1133.1
.473
Win Percentage
.477
50
Save Opportunities
54
.248
Opponent Batting Average
.231
.307
Opponent's On-base pct.
.303
.403
Opponent's Slugging pct.
.377
.710
Opponent's OPB Pct + SLG Pct
.680
4325
At Bats
4248
207
Doubles
192
12
Triples
18
55
Batters Hit
55
93
Stolen Bases
70
129
Games Played
128
1
Complete Games
0
9
Shutouts
14
27
Wild Pitches
28
519
Runs Batted In
477
4
Balks
3
1139.0
Innings pitched
1133.1
8.7
Strikeouts Per 9 Innings
8.3
28
Caught Stealing
25
129
Games Started
128
0.0
Wins Above Replacement
0.0
1
Is Qualified
1
551
Runs
500
507
Earned Runs
448
1744
Total Bases
1600
Fielding
129
Team Games Played
128
1139
Full Innings
1133
4536
Total Chances
4590
3417
Putouts
3400
1051
Assists
1131
68
Errors
59
156
Double Plays
196
0.985
Fielding Percentage
0.987
35.3
Range Factor
36.0
0.0
Zone Rating
0.0
129
Games Played
128
0
Games Started
0
0.0
Defensive Wins Above Replacement
0.0
1
Qualified
1