

Mariners vs Yankees Live Score (12 Aug, 2026)
Game Information
Stage
Standard
Season
2026
First Pitch
Wed, Aug 12, 7:00 pm
Venue
Yankee Stadium
Location
Bronx, New York
Attendance
41,714
Home Runs
Julio Rodriguez
18 HR
.256 AVG
51 RBI

Ben Rice
32 HR
.255 AVG
75 RBI

Batting Average
Randy Arozarena
.276 AVG
.368 OBP
.448 SLG

Cody Bellinger
.259 AVG
.350 OBP
.420 SLG

Runs Batted In
Cole Young
52 RBI
14 HR
.263 AVG

Ben Rice
75 RBI
32 HR
.255 AVG
Earned Run Average
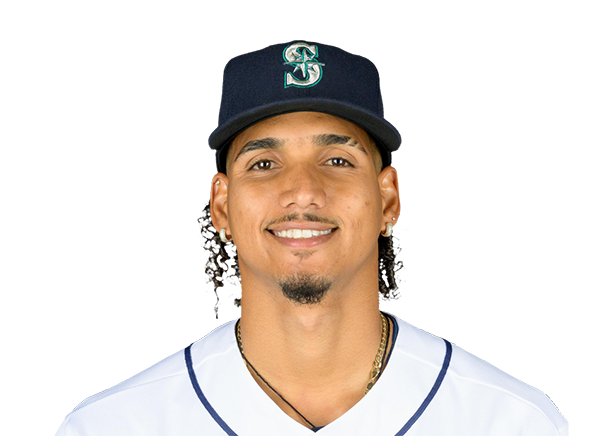
Emerson Hancock
3.35 ERA
6 W
111 K

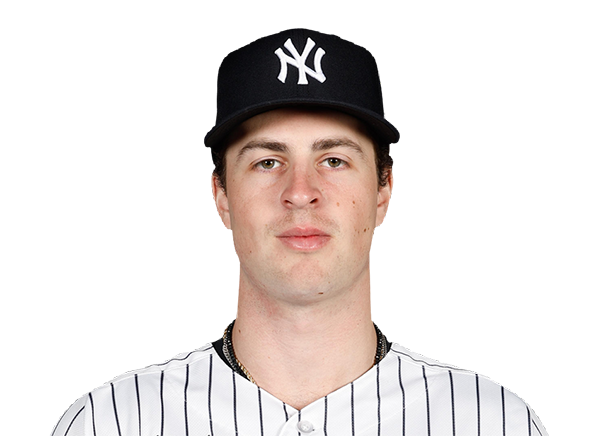
Cam Schlittler
2.21 ERA
10 W
182 K
Wins
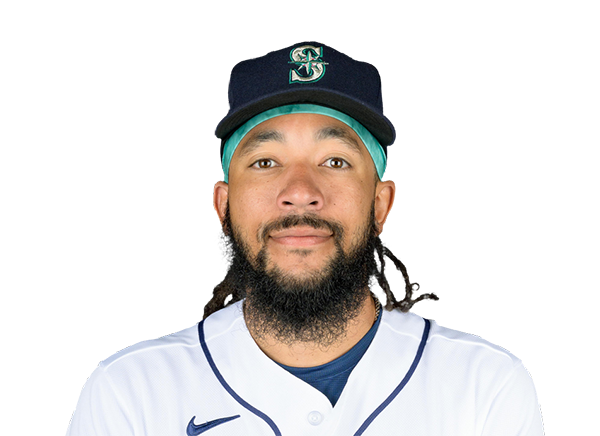
Logan Gilbert
8 W
3.42 ERA
145 K

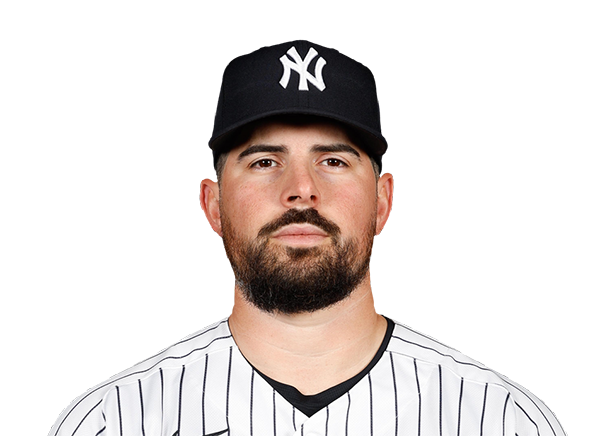
Cam Schlittler
10 W
2.21 ERA
182 K
Strikeouts
Logan Gilbert
145 K
8 W
3.42 ERA
Cam Schlittler
182 K
10 W
2.21 ERA
Injury Report



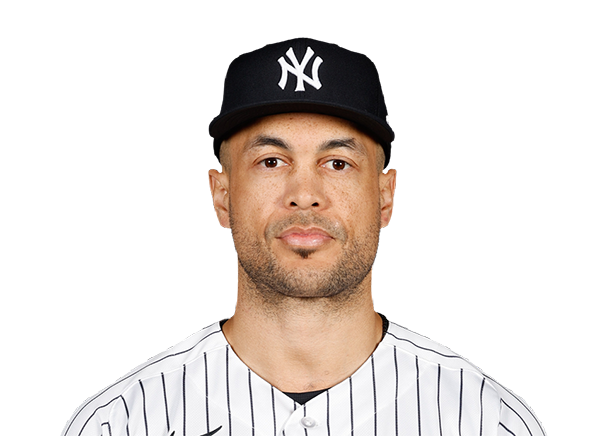
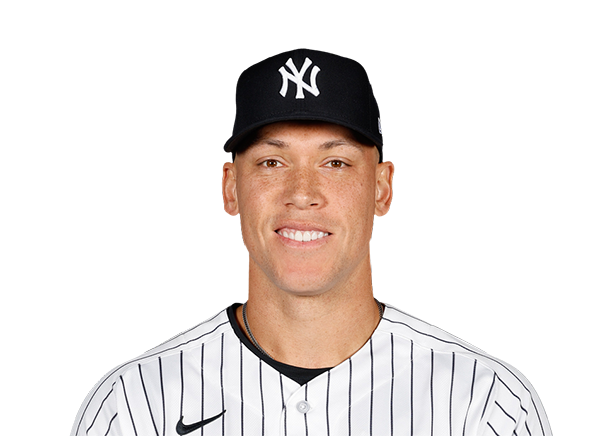
Team Stats
 SEA
NYY


Array
Runs
Array
9
Hits
13
0
Errors
1
—
Home Runs
—
—
Walks
—
—
Strikeouts
—
Standings
American League
| Team | W | L | PCT | GB | DIFF | STRK |
|---|---|---|---|---|---|---|
1 Rays | 76 | 53 | .589 | - | +42 | L3 |
2 White Sox | 67 | 62 | .519 | 9 | +42 | L1 |
3 Astros | 65 | 65 | .500 | 11.5 | -43 | L1 |
| 4Yankees | 73 | 56 | .566 | 3 | +95 | L1 |
5 Red Sox | 70 | 59 | .543 | 6 | +98 | W2 |
6 Rangers | 64 | 66 | .492 | 12.5 | -48 | L1 |
7 Guardians | 64 | 66 | .492 | 12.5 | -14 | W3 |
8 Blue Jays | 64 | 67 | .489 | 13 | -50 | W1 |
9 Twins | 63 | 67 | .485 | 13.5 | -47 | L2 |
10 Orioles | 63 | 67 | .485 | 13.5 | -33 | W2 |
| 11Mariners | 62 | 68 | .477 | 14.5 | -44 | W2 |
12 Tigers | 61 | 68 | .473 | 15 | +77 | L4 |
13 Royals | 57 | 74 | .435 | 20 | -95 | W7 |
14 Angels | 52 | 78 | .400 | 24.5 | -68 | W1 |
15 Athletics | 50 | 80 | .385 | 26.5 | -188 | W1 |
National League
| Team | W | L | PCT | GB | DIFF | STRK |
|---|---|---|---|---|---|---|
1 Brewers | 81 | 49 | .623 | - | +163 | W3 |
2 Dodgers | 79 | 51 | .608 | 2 | +147 | W5 |
3 Braves | 75 | 55 | .577 | 6 | +108 | L2 |
4 Cubs | 74 | 56 | .569 | 7 | +98 | L3 |
5 Phillies | 72 | 58 | .554 | 9 | +25 | W8 |
6 Padres | 70 | 60 | .538 | 11 | +9 | W2 |
7 Diamondbacks | 68 | 62 | .523 | 13 | +7 | L1 |
8 Marlins | 66 | 64 | .508 | 15 | +17 | W2 |
9 Cardinals | 66 | 65 | .504 | 15.5 | 0 | L2 |
10 Pirates | 63 | 68 | .481 | 18.5 | +29 | L2 |
11 Reds | 62 | 68 | .477 | 19 | -92 | W1 |
12 Nationals | 61 | 70 | .466 | 20.5 | +14 | L3 |
13 Mets | 59 | 71 | .454 | 22 | -39 | W1 |
14 Giants | 52 | 77 | .403 | 28.5 | -79 | L3 |
15 Rockies | 50 | 79 | .388 | 30.5 | -131 | L5 |
SEA
VS
NYY
Pitchers

Bryce Miller
Catchers

Cal Raleigh
Infielders
Cole Young
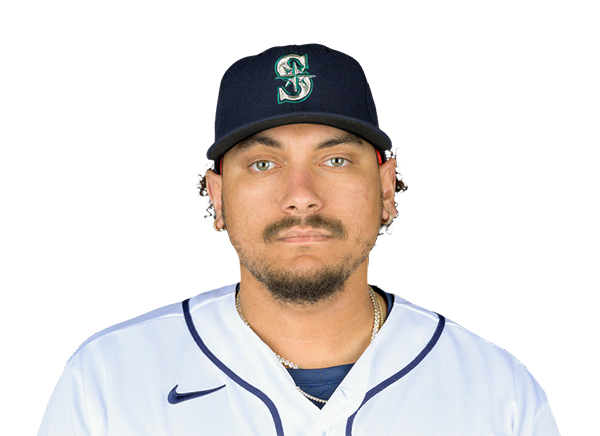
Josh Naylor

Brendan Donovan

Colt Emerson
Outfielders
Randy Arozarena

Dominic Canzone
Julio Rodriguez
Designated Hitters

Taylor Ward
Pitchers

Will Warren
Catchers
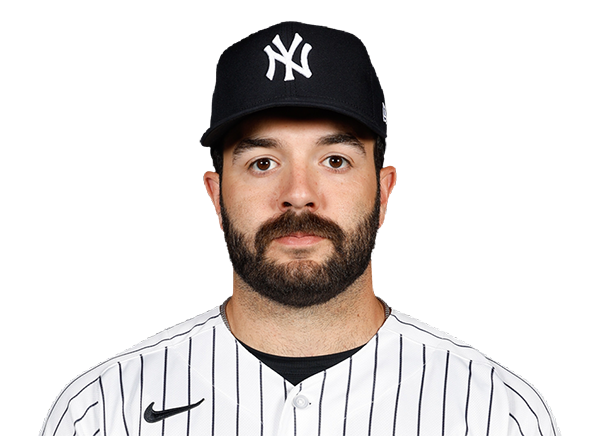
Austin Wells
Infielders
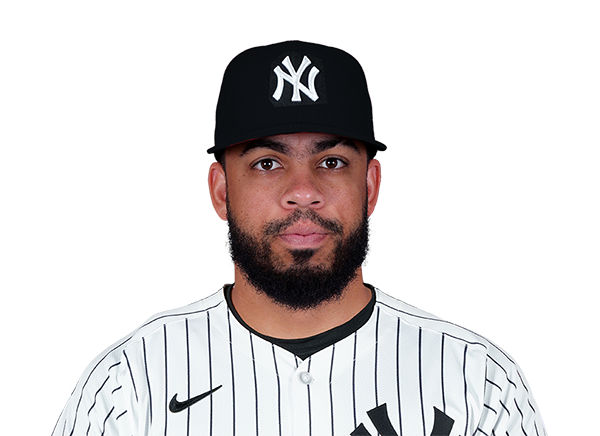
Luis Garcia Jr.

Jazz Chisholm Jr.
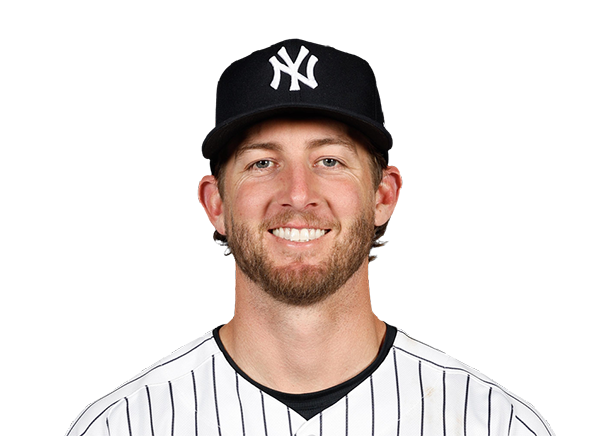
Ryan McMahon
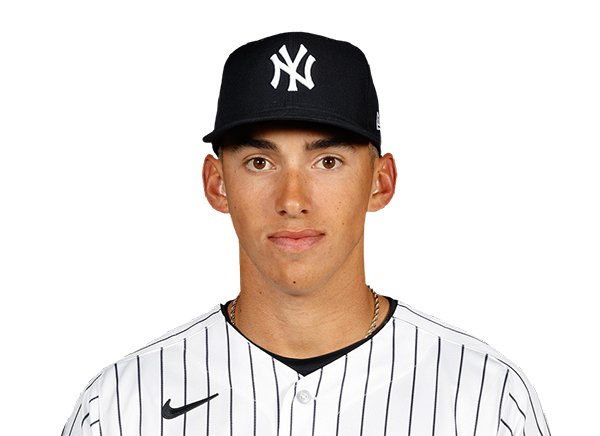
George Lombard Jr.
Outfielders
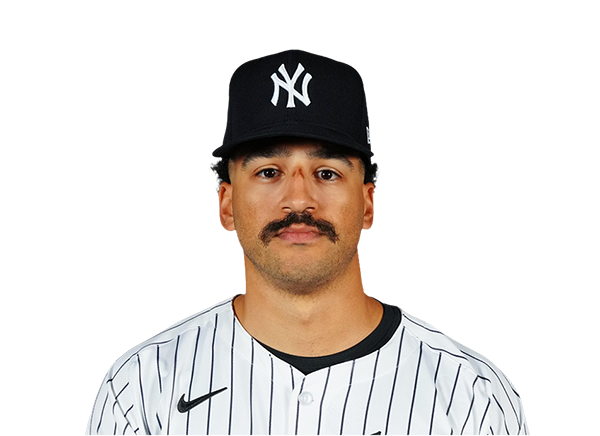
Trent Grisham
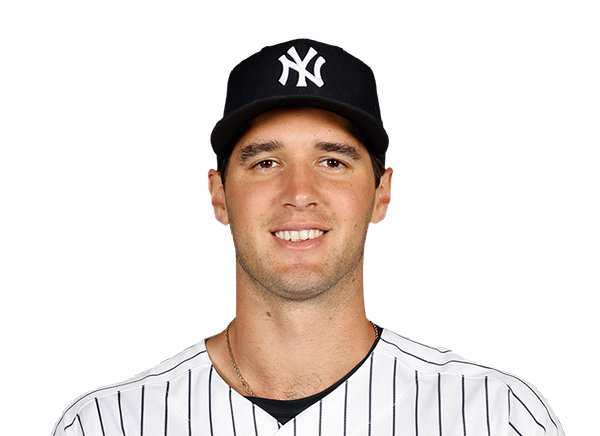
Spencer Jones
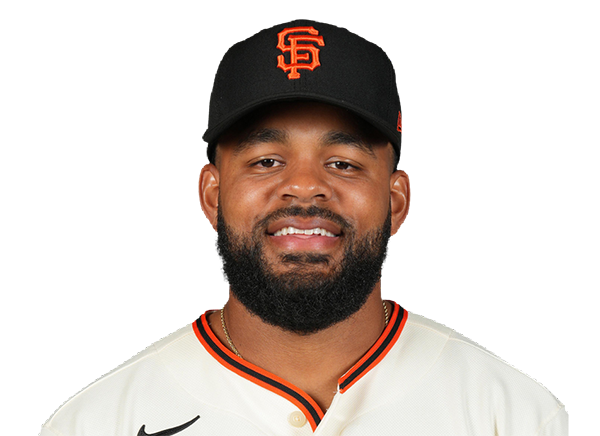
Heliot Ramos
Designated Hitters
Ben Rice
Mariners
VS
Yankees
Batting
121
Team Games Played
120
3990
At Bats
3975
911
Hits
921
452
Runs Batted In
519
141
Home Runs
169
84
Stolen Bases
114
.228
Batting Average
.232
468
Runs
545
143
Doubles
184
10
Triples
15
1497
Total Bases
1642
397
Walks
440
1030
Strikeouts
1099
.308
On Base Percentage
.311
.375
Slugging Percentage
.413
.683
OBP Pct + SLG Pct
.724
121
Games Played
120
121
Games Started
120
73
Hit By Pitch
28
0.0
Wins Above Replacement
0.0
0.0
Offensive Wins Above Replacement
0.0
31
Caught Stealing
36
1
Is Qualified
1
469.6
Runs Created
524.1
3.9
Runs Created Per 27 Outs
4.4
.088
Walks Per Plate Appearance
.098
0.39
Walk To Strikeout Ratio
0.40
.147
Isolated Power
.181
.260
Secondary Average
.312
3.90
Pitches Per Plate Appearance
3.99
294
Extra Base Hits
368
4498
Plate Appearances
4480
28.3
At Bats Per Home Run
23.5
9
Sacrifice Hit
6
28
Sacrifice Flies
27
Pitching
121
Team Games Played
120
54
Quality Starts
48
56
Wins
68
65
Losses
52
26
Saves
34
61
Holds
65
988
Hits
895
456
Earned runs
393
131
Home Runs
120
303
Walks
368
1026
Strikeouts
1081
8.7
Strikeouts Per 9 Innings
9.1
141.1
Pitches Per Start
144.4
1.21
Walks Plus Hits Per Inning Pitched
1.18
3.85
Earned Run Average
3.30
65
Losses
52
1067.1
Innings pitched
1072.2
.463
Win Percentage
.567
45
Save Opportunities
55
.245
Opponent Batting Average
.224
.304
Opponent's On-base pct.
.295
.396
Opponent's Slugging pct.
.364
.700
Opponent's OPB Pct + SLG Pct
.660
4034
At Bats
3988
196
Doubles
168
10
Triples
15
53
Batters Hit
45
82
Stolen Bases
58
121
Games Played
120
1
Complete Games
0
8
Shutouts
12
27
Wild Pitches
27
467
Runs Batted In
436
3
Balks
3
1067.1
Innings pitched
1072.2
8.7
Strikeouts Per 9 Innings
9.1
26
Caught Stealing
18
121
Games Started
120
0.0
Wins Above Replacement
0.0
1
Is Qualified
1
495
Runs
455
456
Earned Runs
393
1597
Total Bases
1453
Fielding
121
Team Games Played
120
1067
Full Innings
1073
4245
Total Chances
4343
3202
Putouts
3218
984
Assists
1062
59
Errors
63
143
Double Plays
184
0.986
Fielding Percentage
0.985
35.3
Range Factor
35.9
0.0
Zone Rating
0.0
121
Games Played
120
0
Games Started
0
0.0
Defensive Wins Above Replacement
0.0
1
Qualified
1