

Marlins vs Braves Live Score (5 Aug, 2026)
Game Information
Stage
Standard
Season
2026
First Pitch
Wed, Aug 5, 7:15 pm
Venue
Truist Park
Location
Atlanta, Georgia
Attendance
25,136
Live Situation
1Balls
3Strikes
0Outs
—Pitcher
—At Bat
Pitch Sequence
1
BALL
Four-seam FB
98 MPH
2
STRIKE FOUL
Four-seam FB
96 MPH
3
STRIKE FOUL
Four-seam FB
99 MPH
4
STRIKE FOUL
Four-seam FB
98 MPH
5
STRIKE FOUL
Splitter
90 MPH
6
STRIKE FOUL
Four-seam FB
98 MPH
7
STRIKE FOUL
Four-seam FB
97 MPH
8
STRIKE SWINGING
Slider
84 MPH
Injury Report


Team Stats
 MIA
ATL


1
Runs
4
3
Hits
10
0
Errors
1
0
Home Runs
0
2
Walks
2
6
Strikeouts
12
Player Box Score
Miami Marlins
| Player | H-AB | AB | R | H | RBI | HR | BB | K | #P | AVG | OBP | SLG |
|---|---|---|---|---|---|---|---|---|---|---|---|---|
 Xavier Edwards | 1-4 | 4 | 0 | 1 | 0 | 0 | 0 | 0 | 7 | .287 | .366 | .392 |
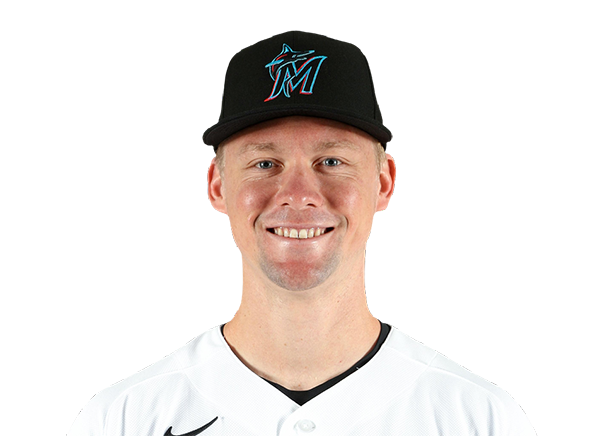 Kyle Stowers | 0-4 | 4 | 0 | 0 | 0 | 0 | 0 | 2 | 13 | .232 | .318 | .452 |
 Otto Lopez | 0-4 | 4 | 0 | 0 | 0 | 0 | 0 | 0 | 9 | .320 | .352 | .477 |
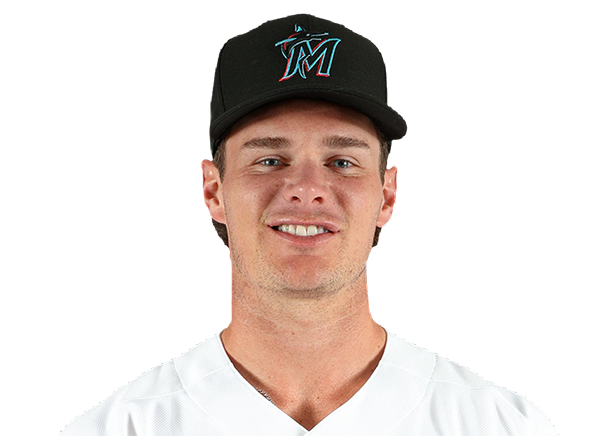 Griffin Conine | 0-4 | 4 | 0 | 0 | 0 | 0 | 0 | 2 | 17 | .256 | .344 | .519 |
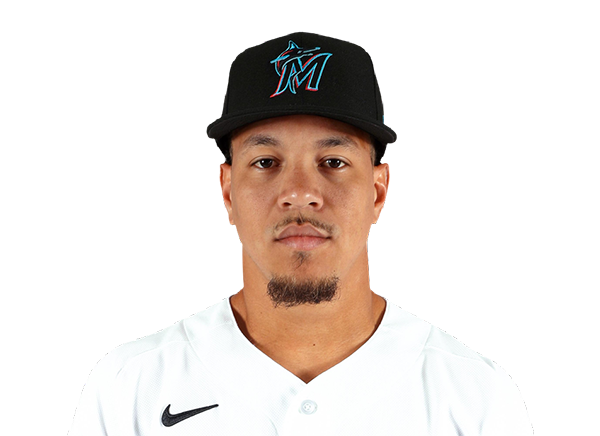 Heriberto Hernandez | 0-4 | 4 | 0 | 0 | 0 | 0 | 0 | 0 | 17 | .233 | .307 | .463 |
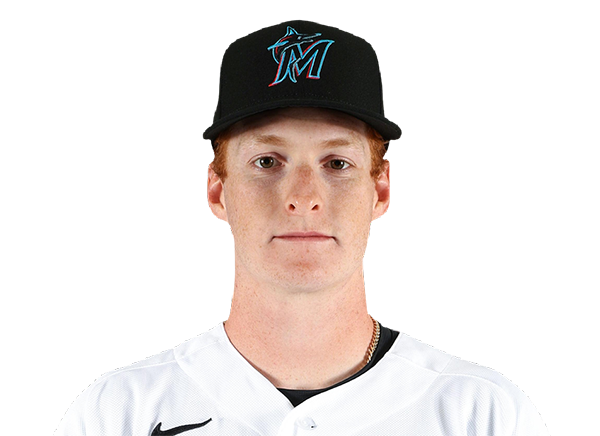 Owen Caissie | 0-3 | 3 | 1 | 0 | 0 | 0 | 1 | 1 | 19 | .228 | .288 | .439 |
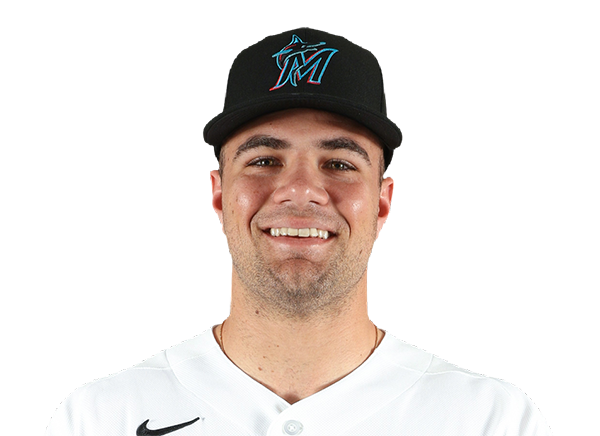 Jakob Marsee | 1-2 | 2 | 0 | 1 | 0 | 0 | 1 | 0 | 17 | .199 | .319 | .302 |
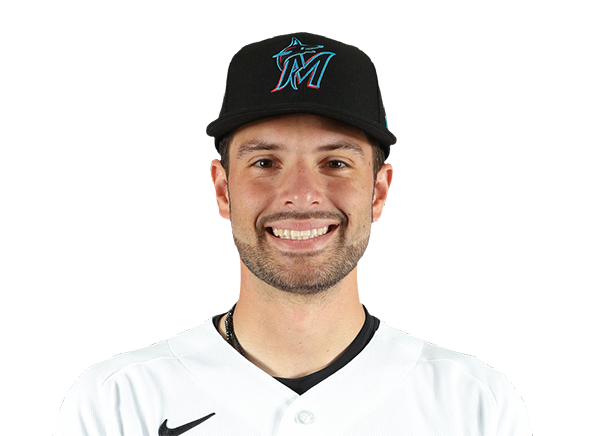 Joe Mack | 0-2 | 2 | 0 | 0 | 1 | 0 | 0 | 0 | 4 | .240 | .293 | .440 |
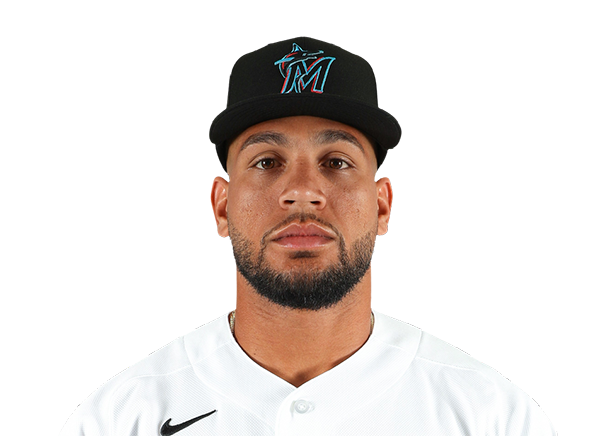 Agustin Ramirez | 0-1 | 1 | 0 | 0 | 0 | 0 | 0 | 1 | 4 | .224 | .311 | .336 |
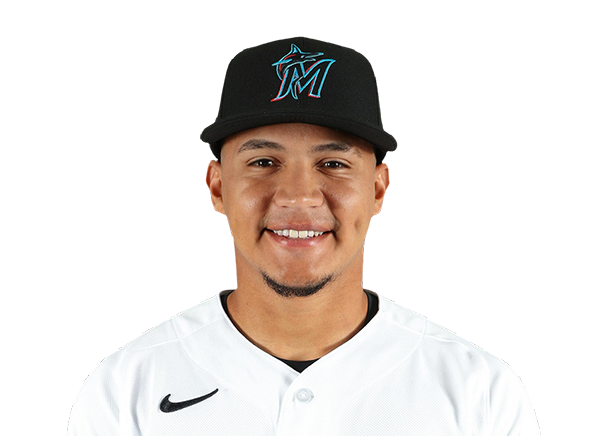 Javier Sanoja | 1-3 | 3 | 0 | 1 | 0 | 0 | 0 | 0 | 9 | .266 | .304 | .399 |
Atlanta Braves
| Player | H-AB | AB | R | H | RBI | HR | BB | K | #P | AVG | OBP | SLG |
|---|---|---|---|---|---|---|---|---|---|---|---|---|
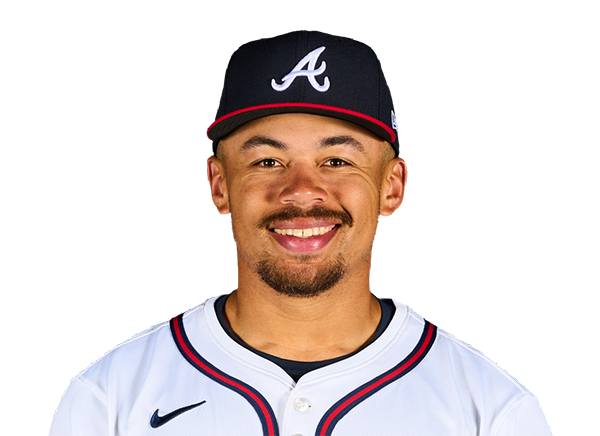 Drake Baldwin | 2-4 | 4 | 0 | 2 | 2 | 0 | 0 | 2 | 11 | .272 | .363 | .462 |
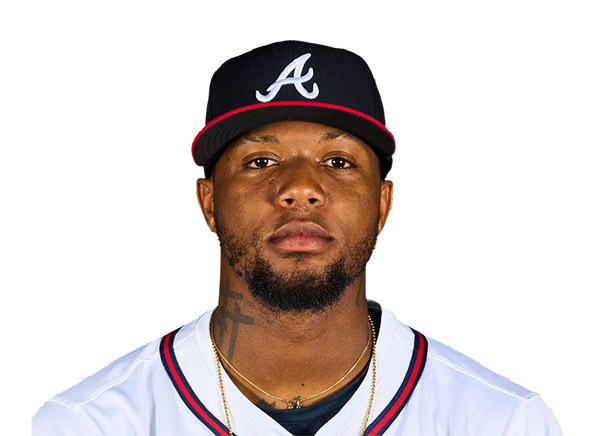 Ronald Acuna Jr. | 1-4 | 4 | 0 | 1 | 0 | 0 | 0 | 3 | 18 | .240 | .358 | .410 |
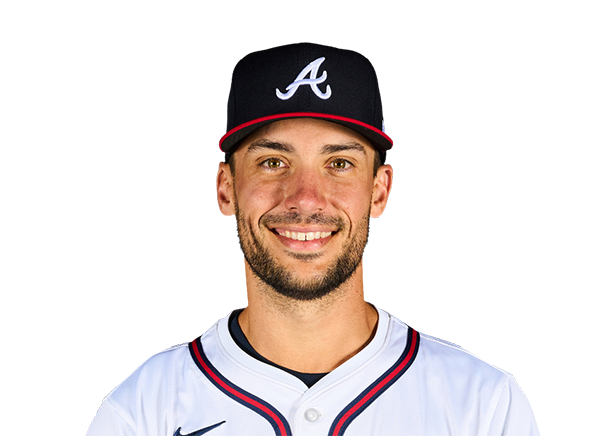 Matt Olson | 0-4 | 4 | 0 | 0 | 0 | 0 | 0 | 2 | 16 | .266 | .343 | .540 |
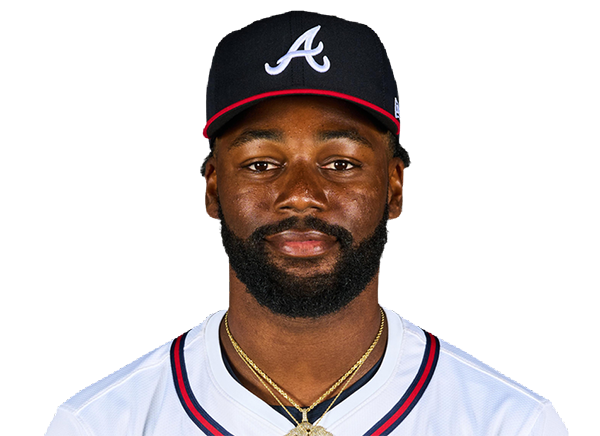 Michael Harris II | 2-4 | 4 | 1 | 2 | 0 | 0 | 0 | 0 | 11 | .290 | .319 | .491 |
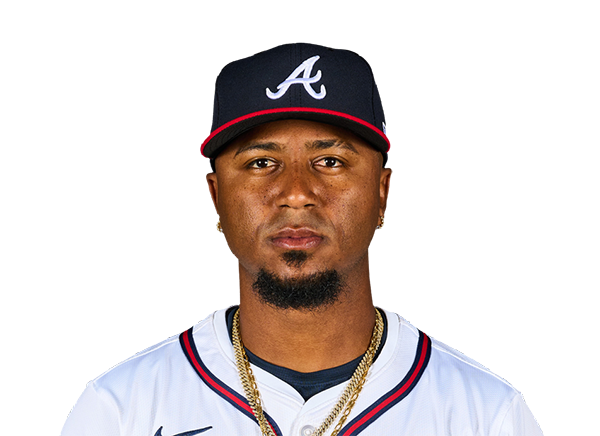 Ozzie Albies | 0-3 | 3 | 1 | 0 | 0 | 0 | 1 | 0 | 21 | .261 | .311 | .437 |
 Mauricio Dubon | 2-4 | 4 | 1 | 2 | 1 | 0 | 0 | 0 | 12 | .262 | .310 | .396 |
 Lane Thomas | 0-2 | 2 | 0 | 0 | 0 | 0 | 1 | 1 | 16 | .000 | .200 | .000 |
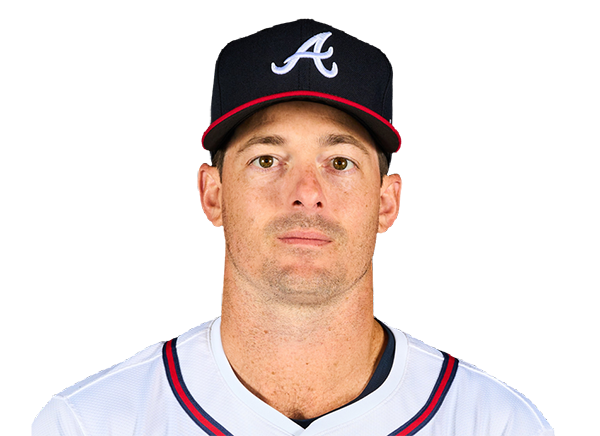 Mike Yastrzemski | 0-1 | 1 | 0 | 0 | 0 | 0 | 0 | 0 | 7 | .230 | .313 | .381 |
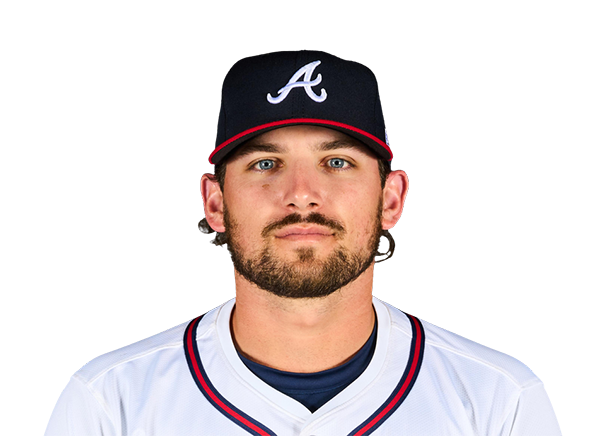 Austin Riley | 2-4 | 4 | 1 | 2 | 1 | 0 | 0 | 2 | 14 | .222 | .298 | .364 |
 Sean Murphy | 1-4 | 4 | 0 | 1 | 0 | 0 | 0 | 2 | 12 | .111 | .111 | .111 |
Miami Marlins
| Player | IP | H | R | ER | BB | K | HR | PC-ST | ERA | PC |
|---|---|---|---|---|---|---|---|---|---|---|
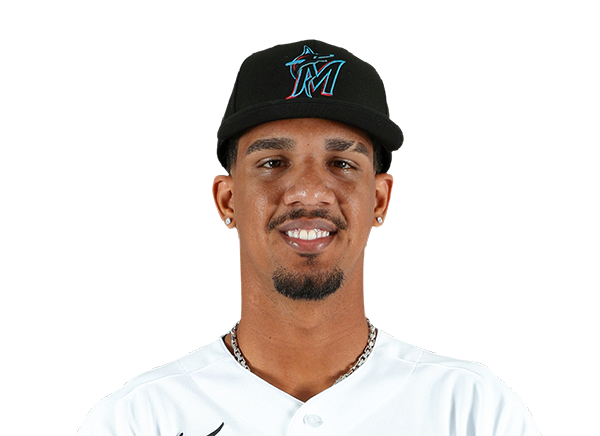 Eury Perez | 5.0 | 7 | 4 | 4 | 2 | 9 | 0 | 91-61 | 3.61 | 91 |
 Calvin Faucher | 1.0 | 2 | 0 | 0 | 0 | 3 | 0 | 20-14 | 4.53 | 20 |
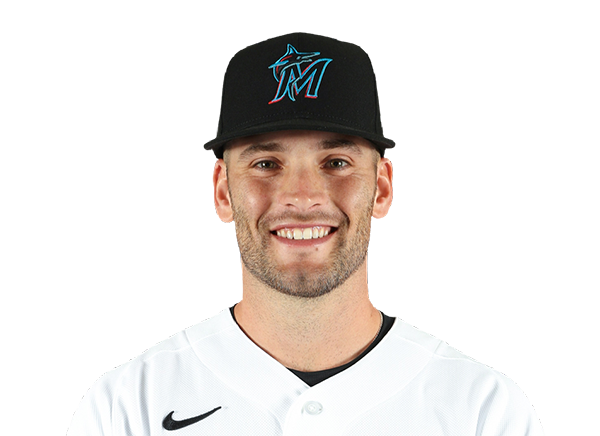 Cade Gibson | 1.0 | 0 | 0 | 0 | 0 | 0 | 0 | 9-6 | 5.52 | 9 |
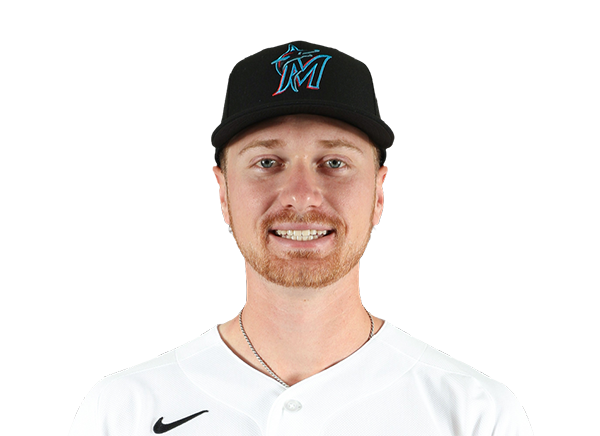 Josh Ekness | 1.0 | 1 | 0 | 0 | 0 | 0 | 0 | 18-12 | 1.42 | 18 |
Atlanta Braves
| Player | IP | H | R | ER | BB | K | HR | PC-ST | ERA | PC |
|---|---|---|---|---|---|---|---|---|---|---|
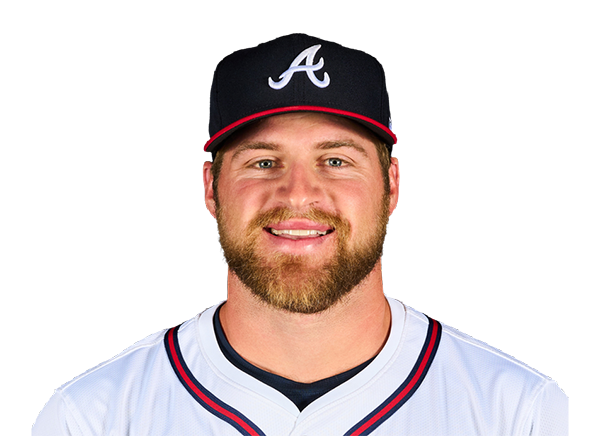 Bryce Elder | 7.0 | 1 | 1 | 1 | 2 | 3 | 0 | 84-53 | 3.69 | 84 |
 Dylan Dodd | 0.2 | 2 | 0 | 0 | 0 | 1 | 0 | 13-10 | 2.04 | 13 |
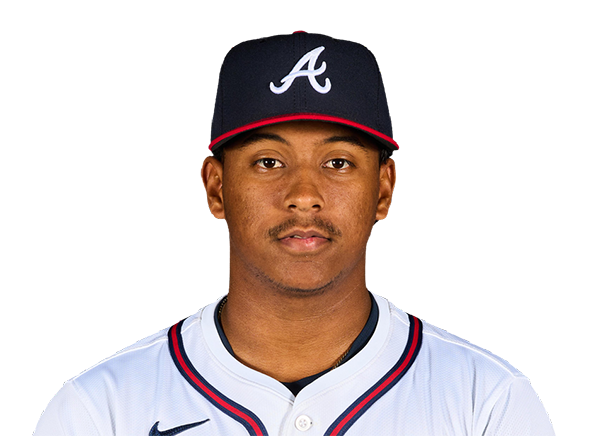 Didier Fuentes | 1.1 | 0 | 0 | 0 | 0 | 2 | 0 | 19-15 | 2.42 | 19 |
H2H / Season Series
ATL11–3
MIA
ATL4–1
MIA
ATL4–2
MIA
MIA3–9
ATL
MIA1–9
ATL
MIA4–8
ATL
MIA12–0
ATL
ATL6–3
MIA
ATL6–5
MIA
ATL4–10
MIA
Last 5 Games
| Date | Opponent | Result |
|---|---|---|
| Aug 22 |  vs WSH | W4–2 |
| Aug 21 | vs WSH | W3–2 |
| Aug 19 |  @ PHI | L1–4 |
| Aug 18 | @ PHI | L4–6 |
| Aug 17 | @ PHI | L5–6 |
| Date | Opponent | Result |
|---|---|---|
| Aug 22 |  @ MIL | L1–4 |
| Aug 21 | @ MIL | L1–2 |
| Aug 20 |  @ CHW | W2–0 |
| Aug 19 |  @ MIN | L4–6 |
| Aug 18 | @ MIN | L1–4 |
Standings
American League
| Team | W | L | PCT | GB | DIFF | STRK |
|---|---|---|---|---|---|---|
1 Rays | 76 | 53 | .589 | - | +42 | L3 |
| 2White Sox | 67 | 62 | .519 | 9 | +42 | L1 |
3 Astros | 65 | 65 | .500 | 11.5 | -43 | L1 |
4 Yankees | 73 | 56 | .566 | 3 | +95 | L1 |
5 Red Sox | 70 | 59 | .543 | 6 | +98 | W2 |
6 Rangers | 64 | 66 | .492 | 12.5 | -48 | L1 |
7 Guardians | 64 | 66 | .492 | 12.5 | -14 | W3 |
8 Blue Jays | 64 | 67 | .489 | 13 | -50 | W1 |
| 9Twins | 63 | 67 | .485 | 13.5 | -47 | L2 |
10 Orioles | 63 | 67 | .485 | 13.5 | -33 | W2 |
11 Mariners | 62 | 68 | .477 | 14.5 | -44 | W2 |
12 Tigers | 61 | 68 | .473 | 15 | +77 | L4 |
13 Royals | 57 | 74 | .435 | 20 | -95 | W7 |
14 Angels | 52 | 78 | .400 | 24.5 | -68 | W1 |
15 Athletics | 50 | 80 | .385 | 26.5 | -188 | W1 |
National League
| Team | W | L | PCT | GB | DIFF | STRK |
|---|---|---|---|---|---|---|
| 1Brewers | 81 | 49 | .623 | - | +163 | W3 |
2 Dodgers | 79 | 51 | .608 | 2 | +147 | W5 |
| 3Braves | 75 | 55 | .577 | 6 | +108 | L2 |
4 Cubs | 74 | 56 | .569 | 7 | +98 | L3 |
| 5Phillies | 72 | 58 | .554 | 9 | +25 | W8 |
6 Padres | 70 | 60 | .538 | 11 | +9 | W2 |
7 Diamondbacks | 68 | 62 | .523 | 13 | +7 | L1 |
| 8Marlins | 66 | 64 | .508 | 15 | +17 | W2 |
9 Cardinals | 66 | 65 | .504 | 15.5 | 0 | L2 |
10 Pirates | 63 | 68 | .481 | 18.5 | +29 | L2 |
11 Reds | 62 | 68 | .477 | 19 | -92 | W1 |
| 12Nationals | 61 | 70 | .466 | 20.5 | +14 | L3 |
13 Mets | 59 | 71 | .454 | 22 | -39 | W1 |
14 Giants | 52 | 77 | .403 | 28.5 | -79 | L3 |
15 Rockies | 50 | 79 | .388 | 30.5 | -131 | L5 |
MIA
VS
ATL
Pitchers
Eury Perez
Catchers
Joe Mack
Infielders
Xavier Edwards
Kyle Stowers
Otto Lopez
Javier Sanoja
Outfielders
Griffin Conine
Heriberto Hernandez
Jakob Marsee
Designated Hitters
Owen Caissie
Pitchers
Bryce Elder
Catchers
Sean Murphy
Infielders
Matt Olson
Ozzie Albies
Mauricio Dubon
Austin Riley
Outfielders
Ronald Acuna Jr.
Michael Harris II
Lane Thomas
Designated Hitters
Drake Baldwin
Marlins
VS
Braves
Batting
115
Team Games Played
114
3815
At Bats
3866
949
Hits
963
480
Runs Batted In
536
118
Home Runs
152
124
Stolen Bases
56
.249
Batting Average
.249
499
Runs
557
187
Doubles
179
25
Triples
8
1540
Total Bases
1614
381
Walks
339
931
Strikeouts
915
.324
On Base Percentage
.315
.404
Slugging Percentage
.417
.728
OBP Pct + SLG Pct
.732
115
Games Played
114
115
Games Started
114
61
Hit By Pitch
47
0.0
Wins Above Replacement
0.0
0.0
Offensive Wins Above Replacement
0.0
37
Caught Stealing
18
1
Is Qualified
1
517.8
Runs Created
518.4
4.6
Runs Created Per 27 Outs
4.6
.088
Walks Per Plate Appearance
.079
0.41
Walk To Strikeout Ratio
0.37
.155
Isolated Power
.168
.278
Secondary Average
.266
3.81
Pitches Per Plate Appearance
3.89
330
Extra Base Hits
339
4313
Plate Appearances
4295
32.3
At Bats Per Home Run
25.4
18
Sacrifice Hit
6
37
Sacrifice Flies
34
Pitching
115
Team Games Played
114
39
Quality Starts
39
58
Wins
69
57
Losses
45
28
Saves
36
66
Holds
83
873
Hits
864
448
Earned runs
409
114
Home Runs
130
383
Walks
389
961
Strikeouts
973
8.6
Strikeouts Per 9 Innings
8.6
143.3
Pitches Per Start
144.5
1.24
Walks Plus Hits Per Inning Pitched
1.24
4.00
Earned Run Average
3.63
57
Losses
45
1009.0
Innings pitched
1013.1
.504
Win Percentage
.605
43
Save Opportunities
50
.231
Opponent Batting Average
.229
.310
Opponent's On-base pct.
.305
.374
Opponent's Slugging pct.
.376
.684
Opponent's OPB Pct + SLG Pct
.681
3784
At Bats
3777
166
Doubles
138
17
Triples
15
61
Batters Hit
38
103
Stolen Bases
88
115
Games Played
114
1
Complete Games
0
10
Shutouts
6
35
Wild Pitches
25
466
Runs Batted In
425
3
Balks
2
1009.0
Innings pitched
1013.1
8.6
Strikeouts Per 9 Innings
8.6
29
Caught Stealing
17
115
Games Started
114
0.0
Wins Above Replacement
0.0
1
Is Qualified
1
491
Runs
444
448
Earned Runs
409
1415
Total Bases
1422
Fielding
115
Team Games Played
114
1009
Full Innings
1013
4049
Total Chances
4028
3027
Putouts
3040
949
Assists
933
73
Errors
55
187
Double Plays
179
0.982
Fielding Percentage
0.986
35.5
Range Factor
35.3
0.0
Zone Rating
0.0
115
Games Played
114
0
Games Started
0
0.0
Defensive Wins Above Replacement
0.0
1
Qualified
1