

Marlins vs Nationals Live Score (31 Aug, 2026)
Game Information
Stage
STD
Season
2026
First Pitch
Mon, Aug 31, 6:45 pm
Venue
Nationals Park
Location
Washington, District of Columbia
Venue Type
Outdoor
Broadcast
MLB.TV
Attendance
10,746
Live Situation
2Balls
3Strikes
0Outs
—Pitcher
—At Bat
Pitch Sequence
1
STRIKE LOOKING
Changeup
85 MPH
2
STRIKE SWINGING
Changeup
87 MPH
3
BALL
Changeup
85 MPH
4
STRIKE FOUL
Four-seam FB
98 MPH
5
BALL
Changeup
84 MPH
6
STRIKE SWINGING
Changeup
83 MPH
Injury Report



Team Stats
 MIA
WSH

3
Runs
6
11
Hits
11
1
Errors
1
0
Home Runs
2
2
Walks
3
7
Strikeouts
9
Player Box Score
Miami Marlins
| Player | H-AB | AB | R | H | RBI | HR | BB | K | #P | AVG | OBP | SLG |
|---|---|---|---|---|---|---|---|---|---|---|---|---|
 Heriberto Hernandez |
0-2 | 2 | 1 | 0 | 0 | 0 | 2 | 0 | 20 | .231 | .314 | .464 |
 Otto Lopez |
1-4 | 4 | 0 | 1 | 0 | 0 | 0 | 1 | 12 | .305 | .340 | .442 |
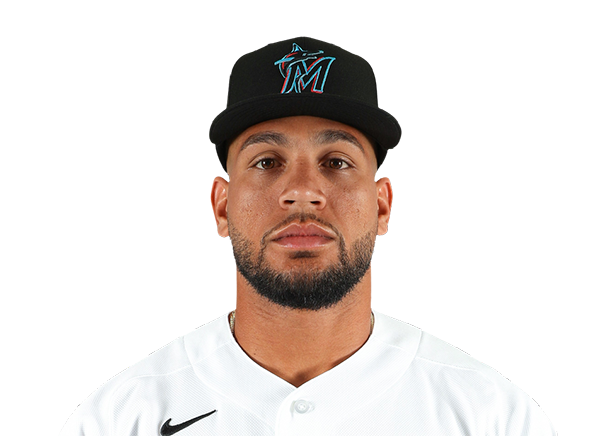 Agustin Ramirez |
1-2 | 2 | 1 | 1 | 0 | 0 | 0 | 0 | 6 | .236 | .335 | .333 |
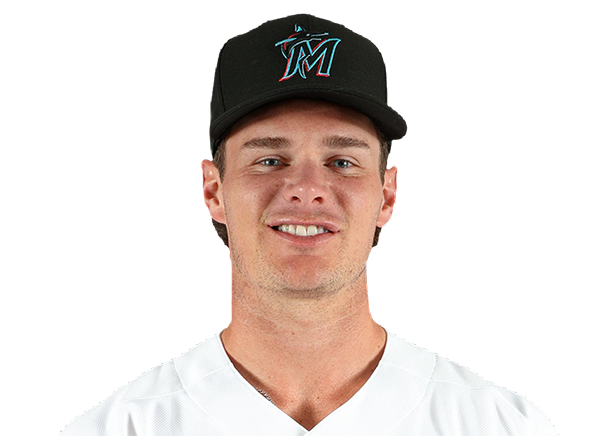 Griffin Conine |
1-2 | 2 | 0 | 1 | 0 | 0 | 0 | 0 | 8 | .251 | .355 | .492 |
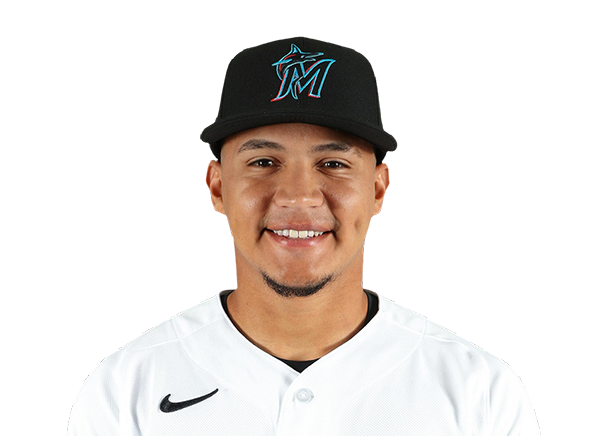 Javier Sanoja |
2-4 | 4 | 1 | 2 | 0 | 0 | 0 | 0 | 14 | .280 | .320 | .418 |
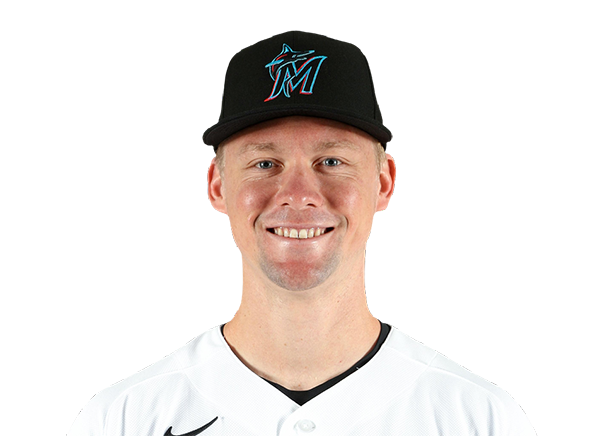 Kyle Stowers |
2-4 | 4 | 0 | 2 | 2 | 0 | 0 | 1 | 22 | .245 | .331 | .457 |
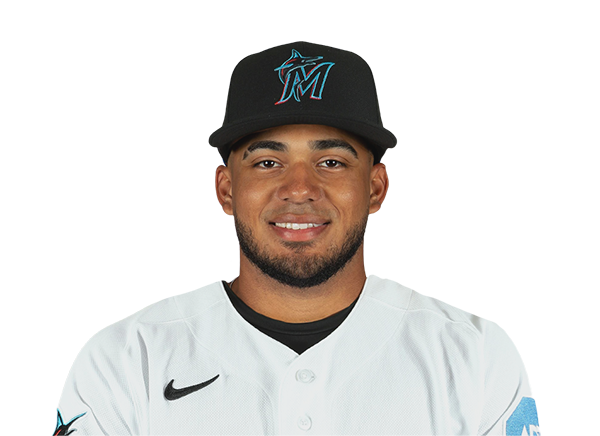 Leo Jimenez |
0-4 | 4 | 0 | 0 | 0 | 0 | 0 | 1 | 12 | .199 | .306 | .259 |
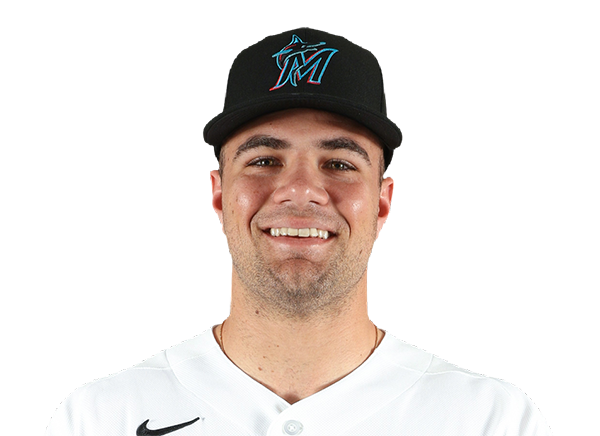 Jakob Marsee |
2-4 | 4 | 0 | 2 | 0 | 0 | 0 | 1 | 10 | .211 | .331 | .325 |
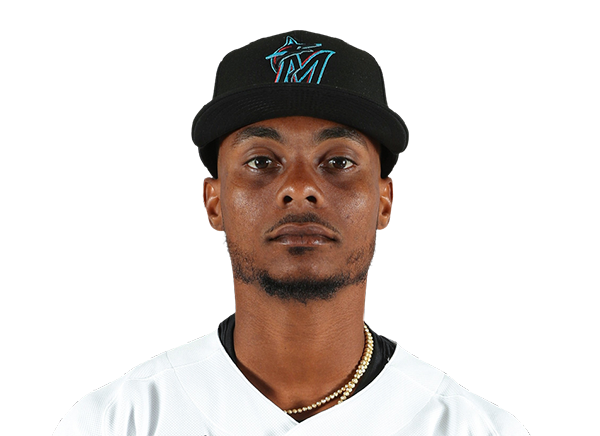 Esteury Ruiz |
1-4 | 4 | 0 | 1 | 0 | 0 | 0 | 1 | 13 | .238 | .361 | .417 |
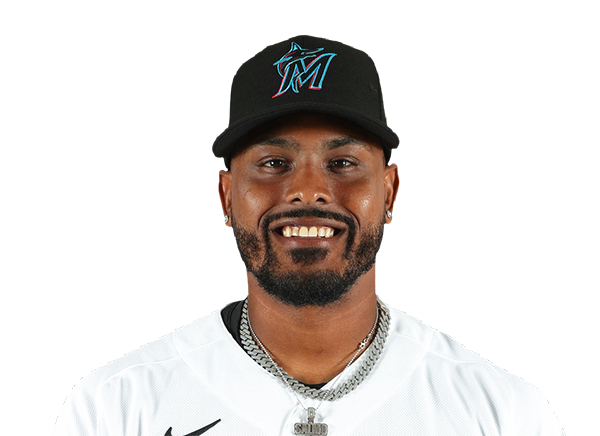 Brian Navarreto |
1-4 | 4 | 0 | 1 | 0 | 0 | 0 | 2 | 16 | .122 | .196 | .220 |
Washington Nationals
| Player | H-AB | AB | R | H | RBI | HR | BB | K | #P | AVG | OBP | SLG |
|---|---|---|---|---|---|---|---|---|---|---|---|---|
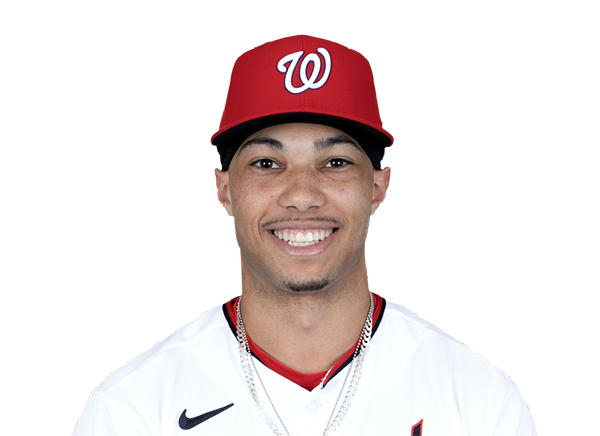 Daylen Lile |
3-3 | 3 | 2 | 3 | 4 | 2 | 1 | 0 | 21 | .257 | .309 | .443 |
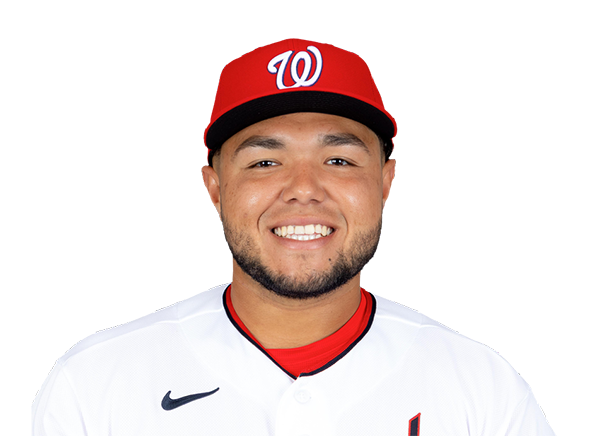 Abimelec Ortiz |
0-3 | 3 | 1 | 0 | 0 | 0 | 1 | 1 | 19 | .218 | .261 | .425 |
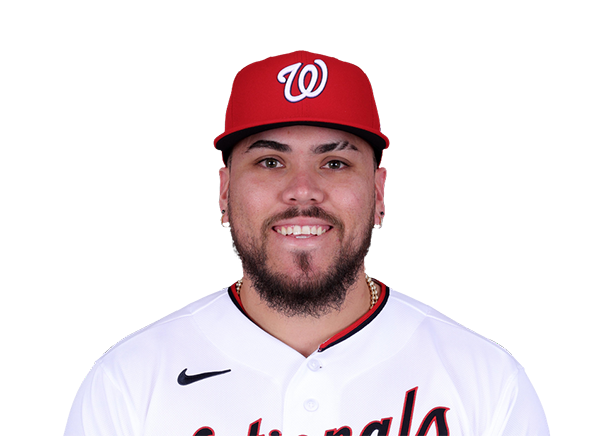 Andres Chaparro |
1-4 | 4 | 1 | 1 | 0 | 0 | 0 | 3 | 23 | .247 | .357 | .507 |
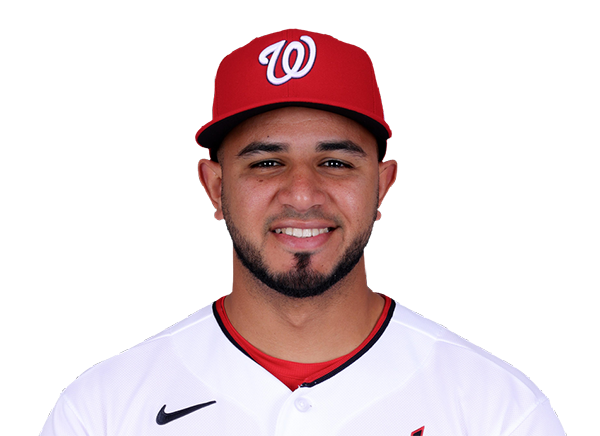 Keibert Ruiz |
2-4 | 4 | 0 | 2 | 0 | 0 | 0 | 1 | 21 | .283 | .322 | .451 |
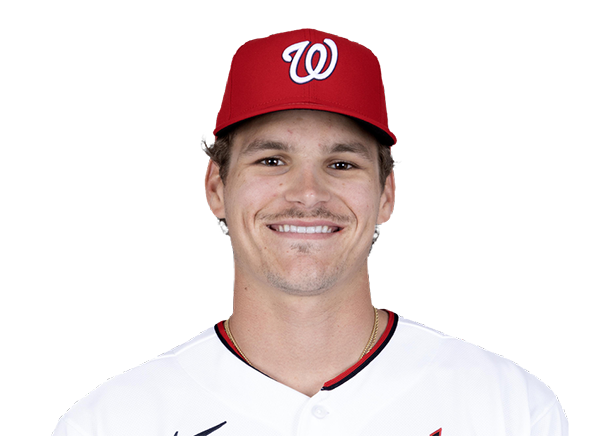 Brady House |
2-4 | 4 | 0 | 2 | 1 | 0 | 0 | 1 | 13 | .241 | .303 | .402 |
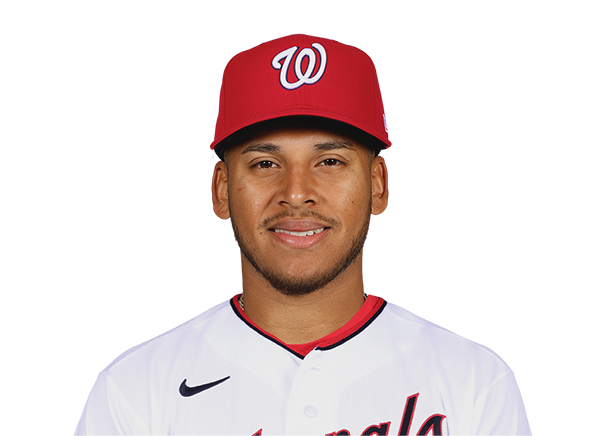 Jorbit Vivas |
0-2 | 2 | 0 | 0 | 0 | 0 | 0 | 0 | 4 | .240 | .334 | .324 |
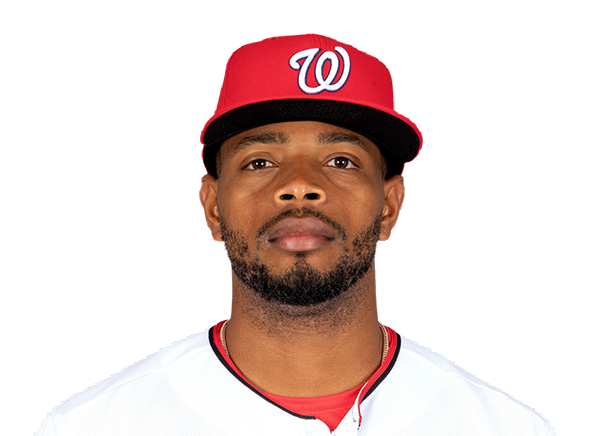 Jose Tena |
0-2 | 2 | 0 | 0 | 0 | 0 | 0 | 0 | 5 | .227 | .310 | .380 |
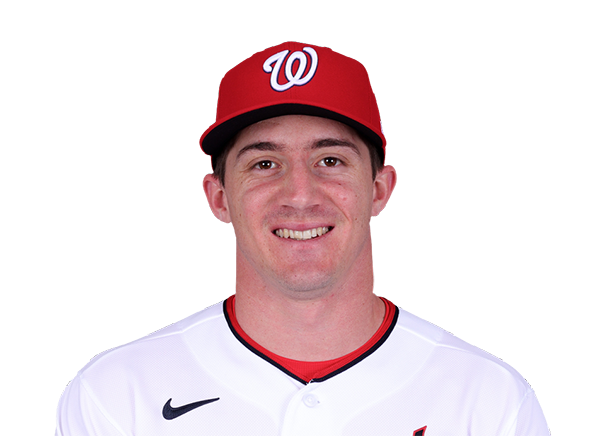 Jacob Young |
0-3 | 3 | 0 | 0 | 0 | 0 | 1 | 1 | 14 | .246 | .314 | .393 |
 Nasim Nunez |
1-4 | 4 | 1 | 1 | 0 | 0 | 0 | 1 | 9 | .216 | .295 | .251 |
 Andrew Pinckney |
2-4 | 4 | 1 | 2 | 0 | 0 | 0 | 1 | 14 | .273 | .320 | .500 |
Miami Marlins
| Player | IP | H | R | ER | BB | K | HR | PC-ST | ERA | PC |
|---|---|---|---|---|---|---|---|---|---|---|
 Ryan Gusto |
4.1 | 4 | 1 | 1 | 2 | 4 | 0 | 69-49 | 3.86 | 69 |
 Jack Ralston |
0.2 | 2 | 1 | 1 | 0 | 1 | 1 | 23-15 | 1.80 | 23 |
 Tyler Zuber |
1.1 | 1 | 1 | 1 | 0 | 3 | 0 | 24-15 | 3.82 | 24 |
 Josh Ekness |
0.1 | 3 | 3 | 3 | 1 | 1 | 1 | 18-10 | 2.84 | 18 |
 Cade Gibson |
1.1 | 1 | 0 | 0 | 0 | 0 | 0 | 9-8 | 5.67 | 9 |
Washington Nationals
| Player | IP | H | R | ER | BB | K | HR | PC-ST | ERA | PC |
|---|---|---|---|---|---|---|---|---|---|---|
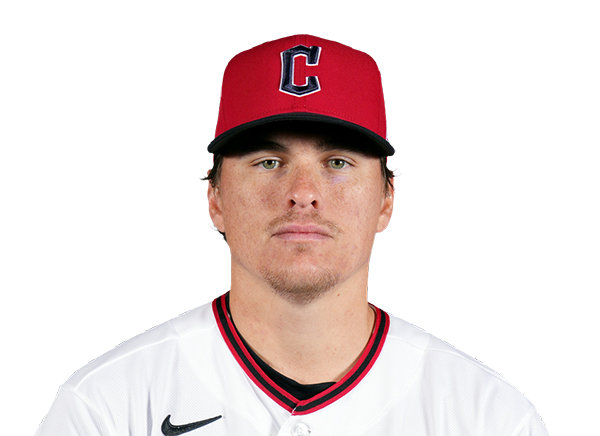 Will Dion |
3.0 | 2 | 0 | 0 | 1 | 1 | 0 | 37-26 | 3.38 | 37 |
 Luis Perales |
1.0 | 4 | 3 | 3 | 1 | 2 | 0 | 34-24 | 21.00 | 34 |
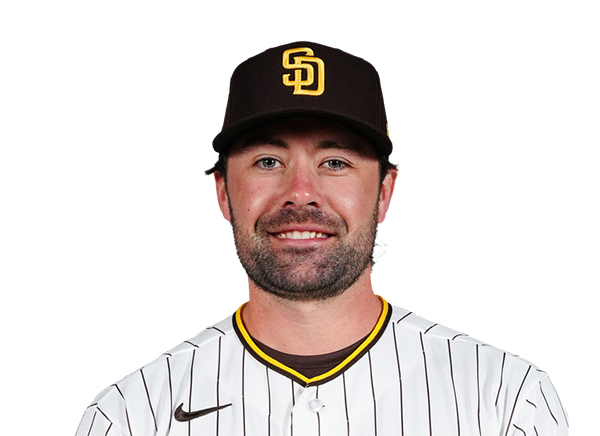 Matt Waldron |
3.0 | 5 | 0 | 0 | 0 | 0 | 0 | 41-32 | 6.64 | 41 |
 Erik Tolman |
2.0 | 0 | 0 | 0 | 0 | 4 | 0 | 21-15 | 0.00 | 21 |
H2H / Season Series
WSH6–3
MIA
WSH2–6
MIA
WSH5–4
MIA
WSH9–2
MIA
MIA6–2
WSH
MIA4–2
WSH
MIA3–2
WSH
WSH1–4
MIA
WSH3–7
MIA
WSH3–7
MIA
Last 5 Games
| Date | Opponent | Result |
|---|---|---|
| Aug 31 | @ WSH | L3–6 |
| Aug 30 | @ WSH | W6–2 |
| Aug 29 | @ WSH | L4–5 |
| Aug 28 | @ WSH | L2–9 |
| Aug 26 |  vs BOS | W4–0 |
| Date | Opponent | Result |
|---|---|---|
| Aug 31 | vs MIA | W6–3 |
| Aug 30 | vs MIA | L2–6 |
| Aug 29 | vs MIA | W5–4 |
| Aug 28 | vs MIA | W9–2 |
| Aug 27 |  vs COL | W7–1 |
Standings
American League
| Team | W | L | PCT | GB | DIFF | STRK |
|---|---|---|---|---|---|---|
1 Rays | 82 | 55 | .599 | - | +53 | L1 |
2 White Sox | 72 | 65 | .526 | 10 | +41 | L2 |
3 Astros | 70 | 68 | .507 | 12.5 | -40 | W2 |
4 Yankees | 78 | 60 | .565 | 4.5 | +108 | L1 |
| 5Red Sox | 75 | 63 | .543 | 7.5 | +85 | W1 |
6 Guardians | 69 | 68 | .504 | 13 | -2 | W1 |
7 Orioles | 69 | 69 | .500 | 13.5 | -17 | W4 |
8 Rangers | 68 | 70 | .493 | 14.5 | -44 | W2 |
9 Blue Jays | 68 | 70 | .493 | 14.5 | -50 | W3 |
10 Twins | 66 | 72 | .478 | 16.5 | -46 | W2 |
11 Mariners | 64 | 74 | .464 | 18.5 | -73 | L5 |
12 Tigers | 63 | 74 | .460 | 19 | +55 | L2 |
13 Royals | 62 | 76 | .449 | 20.5 | -83 | L1 |
14 Athletics | 53 | 85 | .384 | 29.5 | -198 | L4 |
15 Angels | 53 | 85 | .384 | 29.5 | -73 | W1 |
National League
| Team | W | L | PCT | GB | DIFF | STRK |
|---|---|---|---|---|---|---|
1 Brewers | 85 | 53 | .616 | - | +163 | L2 |
2 Dodgers | 82 | 55 | .599 | 2.5 | +153 | W1 |
3 Braves | 82 | 56 | .594 | 3 | +113 | L1 |
4 Cubs | 78 | 60 | .565 | 7 | +141 | W1 |
5 Phillies | 78 | 60 | .565 | 7 | +31 | W5 |
6 Padres | 73 | 65 | .529 | 12 | +15 | W1 |
7 Diamondbacks | 73 | 66 | .525 | 12.5 | +4 | L2 |
| 8Marlins | 69 | 69 | .500 | 16 | +12 | L1 |
9 Cardinals | 68 | 70 | .493 | 17 | -15 | L2 |
10 Pirates | 67 | 71 | .486 | 18 | +26 | W2 |
| 11Nationals | 66 | 74 | .471 | 20 | +19 | W1 |
12 Reds | 65 | 73 | .471 | 20 | -113 | L1 |
13 Mets | 62 | 76 | .449 | 23 | -52 | W1 |
14 Giants | 57 | 81 | .413 | 28 | -70 | W2 |
| 15Rockies | 52 | 86 | .377 | 33 | -143 | L5 |
MIA
VS
WSH
Pitchers
Ryan Gusto
Catchers
Brian Navarreto
Infielders
Otto Lopez
Javier Sanoja
Kyle Stowers
Leo Jimenez
Outfielders
Heriberto Hernandez
Jakob Marsee
Esteury Ruiz
Designated Hitters
Agustin Ramirez
Pitchers
Will Dion
Catchers
Keibert Ruiz
Infielders
Andres Chaparro
Brady House
Jorbit Vivas
Nasim Nunez
Outfielders
Daylen Lile
Jacob Young
Andrew Pinckney
Designated Hitters
Abimelec Ortiz
Marlins
VS
Nationals
Batting
138
Team Games Played
140
4580
At Bats
4779
1135
Hits
1188
568
Runs Batted In
688
137
Home Runs
192
146
Stolen Bases
148
.248
Batting Average
.249
597
Runs
726
213
Doubles
238
28
Triples
28
1815
Total Bases
2058
478
Walks
489
1131
Strikeouts
1160
.326
On Base Percentage
.325
.396
Slugging Percentage
.431
.722
OBP Pct + SLG Pct
.755
138
Games Played
140
138
Games Started
140
74
Hit By Pitch
65
0.0
Wins Above Replacement
0.0
0.0
Offensive Wins Above Replacement
0.0
43
Caught Stealing
34
1
Is Qualified
1
616.0
Runs Created
691.9
4.6
Runs Created Per 27 Outs
5.0
.092
Walks Per Plate Appearance
.091
0.42
Walk To Strikeout Ratio
0.42
.148
Isolated Power
.182
.275
Secondary Average
.308
3.82
Pitches Per Plate Appearance
3.82
378
Extra Base Hits
458
5197
Plate Appearances
5385
33.4
At Bats Per Home Run
24.9
21
Sacrifice Hit
18
43
Sacrifice Flies
31
Pitching
138
Team Games Played
140
46
Quality Starts
32
69
Wins
66
69
Losses
74
30
Saves
34
76
Holds
71
1051
Hits
1218
528
Earned runs
644
136
Home Runs
190
464
Walks
510
1125
Strikeouts
1088
8.4
Strikeouts Per 9 Innings
7.9
143.6
Pitches Per Start
150.8
1.25
Walks Plus Hits Per Inning Pitched
1.39
3.92
Earned Run Average
4.66
69
Losses
74
1211.2
Innings pitched
1244.0
.500
Win Percentage
.471
49
Save Opportunities
69
.231
Opponent Batting Average
.255
.310
Opponent's On-base pct.
.333
.373
Opponent's Slugging pct.
.425
.683
Opponent's OPB Pct + SLG Pct
.759
4548
At Bats
4771
195
Doubles
219
21
Triples
11
69
Batters Hit
73
111
Stolen Bases
106
138
Games Played
140
1
Complete Games
0
13
Shutouts
5
41
Wild Pitches
49
548
Runs Batted In
680
4
Balks
1
1211.2
Innings pitched
1244.0
8.4
Strikeouts Per 9 Innings
7.9
36
Caught Stealing
30
138
Games Started
140
0.0
Wins Above Replacement
0.0
1
Is Qualified
1
585
Runs
707
528
Earned Runs
644
1696
Total Bases
2029
Fielding
138
Team Games Played
140
1212
Full Innings
1244
4879
Total Chances
5104
3635
Putouts
3732
1155
Assists
1279
89
Errors
93
213
Double Plays
238
0.982
Fielding Percentage
0.982
35.6
Range Factor
36.3
0.0
Zone Rating
0.0
138
Games Played
140
0
Games Started
0
0.0
Defensive Wins Above Replacement
0.0
1
Qualified
1