

Marlins vs Padres Live Score (20 Sep, 2026)
Game Information
Stage
STD
Season
2026
First Pitch
Sun, Sep 20, 4:10 pm
Venue
Petco Park
Location
San Diego, California
Venue Type
Outdoor
Broadcast
ESPN Unlmtd
Attendance
40,847
Live Situation
1Balls
0Strikes
0Outs
—Pitcher
—At Bat
Pitch Sequence
1
BALL
Four-seam FB
100 MPH
2
BALL IN PLAY
Four-seam FB
99 MPH
Injury Report







Team Stats
 MIA
SD


3
Runs
7
4
Hits
10
1
Errors
0
1
Home Runs
3
3
Walks
2
6
Strikeouts
6
Player Box Score
Miami Marlins
| Player | H-AB | AB | R | H | RBI | HR | BB | K | #P | AVG | OBP | SLG |
|---|---|---|---|---|---|---|---|---|---|---|---|---|
 Kyle Stowers | 1-3 | 3 | 0 | 1 | 0 | 0 | 1 | 0 | 15 | .237 | .328 | .445 |
 Otto Lopez | 0-4 | 4 | 0 | 0 | 0 | 0 | 0 | 1 | 11 | .305 | .348 | .442 |
 Griffin Conine | 1-4 | 4 | 0 | 1 | 0 | 0 | 0 | 1 | 11 | .256 | .350 | .481 |
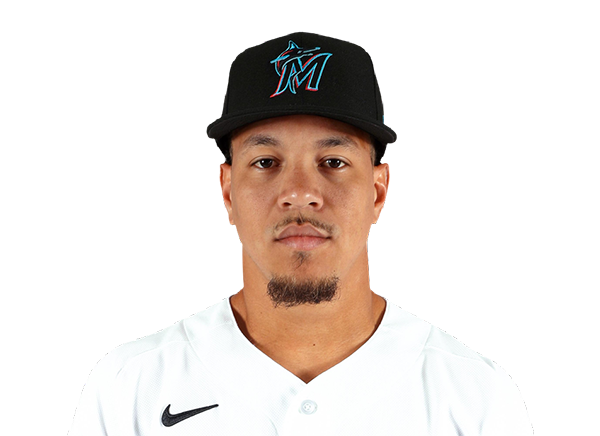 Heriberto Hernandez | 0-4 | 4 | 1 | 0 | 0 | 0 | 0 | 1 | 14 | .228 | .313 | .440 |
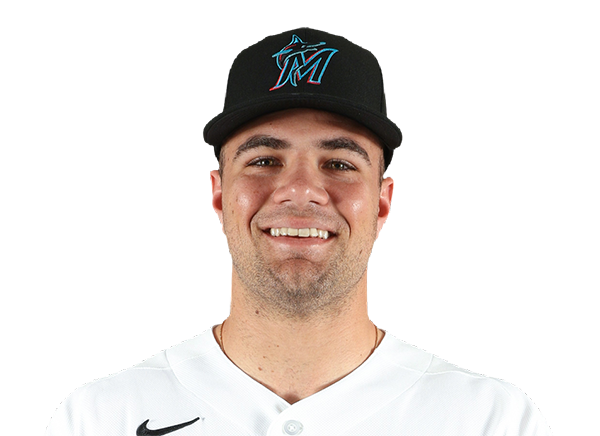 Jakob Marsee | 0-3 | 3 | 1 | 0 | 0 | 0 | 1 | 1 | 16 | .230 | .349 | .359 |
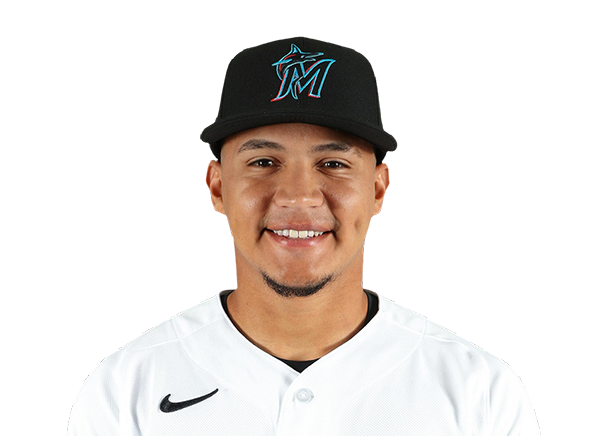 Javier Sanoja | 1-3 | 3 | 1 | 1 | 3 | 1 | 0 | 0 | 9 | .291 | .330 | .454 |
 Graham Pauley | 0-2 | 2 | 0 | 0 | 0 | 0 | 0 | 1 | 8 | .207 | .255 | .378 |
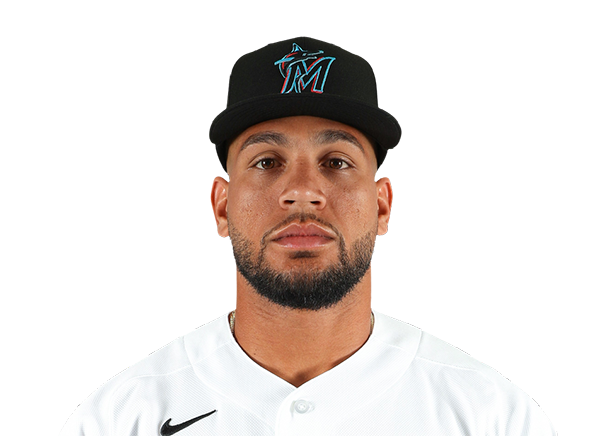 Agustin Ramirez | 0-0 | 0 | 0 | 0 | 0 | 0 | 1 | 0 | 7 | .235 | .323 | .368 |
 Joe Mack | 1-2 | 2 | 0 | 1 | 0 | 0 | 0 | 0 | 5 | .231 | .278 | .395 |
 Esteury Ruiz | 0-1 | 1 | 0 | 0 | 0 | 0 | 0 | 0 | 3 | .222 | .338 | .384 |
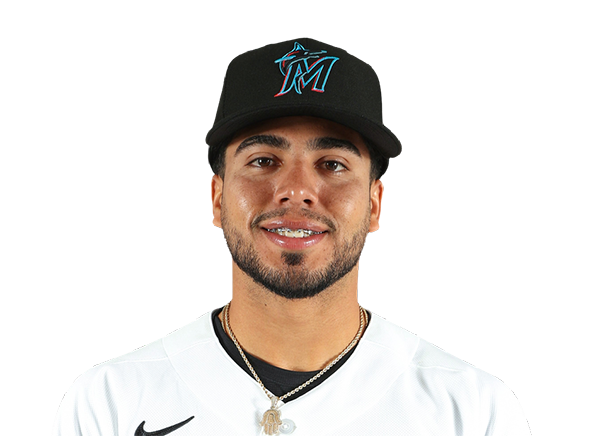 Jared Serna | 0-0 | 0 | 0 | 0 | 0 | 0 | 0 | 0 | 0 | .214 | .250 | .357 |
 Deyvison De Los Santos | 0-3 | 3 | 0 | 0 | 0 | 0 | 0 | 1 | 14 | .200 | .200 | .280 |
San Diego Padres
| Player | H-AB | AB | R | H | RBI | HR | BB | K | #P | AVG | OBP | SLG |
|---|---|---|---|---|---|---|---|---|---|---|---|---|
 Fernando Tatis Jr. | 1-4 | 4 | 1 | 1 | 1 | 1 | 0 | 0 | 9 | .285 | .355 | .468 |
 Dustin Harris | 1-4 | 4 | 0 | 1 | 0 | 0 | 0 | 0 | 7 | .306 | .363 | .396 |
 Jase Bowen | 0-0 | 0 | 0 | 0 | 0 | 0 | 0 | 0 | 0 | .154 | .198 | .264 |
 Manny Machado | 0-4 | 4 | 0 | 0 | 0 | 0 | 0 | 2 | 22 | .219 | .307 | .406 |
 Ty France | 0-4 | 4 | 0 | 0 | 0 | 0 | 0 | 1 | 25 | .301 | .366 | .519 |
 Jackson Merrill | 1-4 | 4 | 1 | 1 | 0 | 0 | 0 | 1 | 12 | .255 | .304 | .445 |
 Xander Bogaerts | 1-3 | 3 | 2 | 1 | 0 | 0 | 1 | 0 | 13 | .229 | .328 | .339 |
 Jake Cronenworth | 3-4 | 4 | 3 | 3 | 5 | 2 | 0 | 1 | 11 | .229 | .310 | .327 |
 Samad Taylor | 3-3 | 3 | 0 | 3 | 1 | 0 | 0 | 0 | 11 | .343 | .417 | .445 |
 Sung-Mun Song | 0-1 | 1 | 0 | 0 | 0 | 0 | 0 | 0 | 3 | .184 | .285 | .240 |
 Ethan Salas | 0-2 | 2 | 0 | 0 | 0 | 0 | 1 | 1 | 16 | .143 | .172 | .429 |
Miami Marlins
| Player | IP | H | R | ER | BB | K | HR | PC-ST | ERA | PC |
|---|---|---|---|---|---|---|---|---|---|---|
 Sandy Alcantara | 6.0 | 8 | 4 | 4 | 1 | 3 | 1 | 97-68 | 3.91 | 97 |
 Bradley Blalock | 2.0 | 2 | 3 | 3 | 1 | 3 | 2 | 32-21 | 5.63 | 32 |
San Diego Padres
| Player | IP | H | R | ER | BB | K | HR | PC-ST | ERA | PC |
|---|---|---|---|---|---|---|---|---|---|---|
 Walker Buehler | 6.2 | 3 | 3 | 3 | 2 | 6 | 1 | 89-63 | 4.56 | 89 |
 Kyle Hart | 0.1 | 0 | 0 | 0 | 1 | 0 | 0 | 10-5 | 4.57 | 10 |
 Bradgley Rodriguez | 1.0 | 1 | 0 | 0 | 0 | 0 | 0 | 7-4 | 2.31 | 7 |
 Mason Miller | 1.0 | 0 | 0 | 0 | 0 | 0 | 0 | 7-5 | 1.21 | 7 |
H2H / Season Series
SD7–3
MIA
SD7–6
MIA
SD8–2
MIA
MIA3–5
SD
MIA2–7
SD
MIA2–4
SD
Last 5 Games
| Date | Opponent | Result |
|---|---|---|
| Sep 20 | @ SD | L3–7 |
| Sep 19 | @ SD | L6–7 |
| Sep 18 | @ SD | L2–8 |
| Sep 16 |  @ ARI | W4–3 |
| Sep 15 | @ ARI | W4–2 |
| Date | Opponent | Result |
|---|---|---|
| Sep 20 | vs MIA | W7–3 |
| Sep 19 | vs MIA | W7–6 |
| Sep 18 | vs MIA | W8–2 |
| Sep 17 |  @ COL | W9–2 |
| Sep 16 | @ COL | W9–3 |
Standings
American League
| Team | W | L | PCT | GB | DIFF | STRK |
|---|---|---|---|---|---|---|
1 Rays | 95 | 60 | .613 | - | +83 | W2 |
2 Guardians | 81 | 75 | .519 | 14.5 | +2 | W5 |
3 Rangers | 78 | 78 | .500 | 17.5 | -34 | L1 |
4 Yankees | 89 | 66 | .574 | 6 | +137 | L2 |
5 Red Sox | 84 | 72 | .538 | 11.5 | +80 | L2 |
6 White Sox | 80 | 76 | .513 | 15.5 | +42 | W2 |
7 Astros | 77 | 79 | .494 | 18.5 | -59 | L3 |
8 Blue Jays | 77 | 79 | .494 | 18.5 | -42 | W1 |
9 Orioles | 75 | 81 | .481 | 20.5 | -31 | L3 |
10 Mariners | 73 | 83 | .468 | 22.5 | -56 | W1 |
11 Twins | 73 | 83 | .468 | 22.5 | -64 | W1 |
12 Tigers | 73 | 83 | .468 | 22.5 | +68 | L2 |
13 Royals | 67 | 89 | .429 | 28.5 | -102 | L4 |
14 Athletics | 61 | 95 | .391 | 34.5 | -223 | L6 |
15 Angels | 60 | 96 | .385 | 35.5 | -87 | L1 |
National League
| Team | W | L | PCT | GB | DIFF | STRK |
|---|---|---|---|---|---|---|
1 Brewers | 98 | 58 | .628 | - | +202 | W3 |
2 Dodgers | 96 | 60 | .615 | 2 | +193 | W4 |
3 Braves | 92 | 64 | .590 | 6 | +120 | W3 |
4 Cubs | 87 | 69 | .558 | 11 | +152 | W2 |
| 5Padres | 87 | 69 | .558 | 11 | +41 | W5 |
6 Phillies | 86 | 70 | .551 | 12 | +29 | W1 |
| 7Diamondbacks | 82 | 74 | .526 | 16 | -1 | W2 |
8 Pirates | 79 | 77 | .506 | 19 | +29 | W4 |
| 9Marlins | 76 | 80 | .487 | 22 | -3 | L3 |
10 Cardinals | 76 | 80 | .487 | 22 | -23 | W1 |
11 Nationals | 73 | 83 | .468 | 25 | +12 | L1 |
12 Reds | 72 | 84 | .462 | 26 | -163 | L2 |
13 Mets | 71 | 85 | .455 | 27 | -41 | L1 |
14 Giants | 64 | 92 | .410 | 34 | -84 | L3 |
| 15Rockies | 57 | 99 | .365 | 41 | -177 | L1 |
MIA
VS
SD
Pitchers
Sandy Alcantara
Catchers
Joe Mack
Infielders
Otto Lopez
Javier Sanoja
Graham Pauley
Deyvison De Los Santos
Outfielders
Griffin Conine
Heriberto Hernandez
Jakob Marsee
Designated Hitters
Kyle Stowers
Pitchers
Walker Buehler
Catchers
Ethan Salas
Infielders
Fernando Tatis Jr.
Ty France
Xander Bogaerts
Jake Cronenworth
Outfielders
Dustin Harris
Jackson Merrill
Samad Taylor
Designated Hitters
Manny Machado
Marlins
VS
Padres
Batting
156
Team Games Played
156
5206
At Bats
5175
1295
Hits
1261
662
Runs Batted In
665
161
Home Runs
179
159
Stolen Bases
157
.249
Batting Average
.244
692
Runs
690
237
Doubles
228
35
Triples
22
2085
Total Bases
2070
537
Walks
536
1296
Strikeouts
1257
.327
On Base Percentage
.319
.400
Slugging Percentage
.400
.727
OBP Pct + SLG Pct
.719
156
Games Played
156
156
Games Started
156
87
Hit By Pitch
58
0.0
Wins Above Replacement
0.0
0.0
Offensive Wins Above Replacement
0.0
46
Caught Stealing
42
1
Is Qualified
1
707.1
Runs Created
675.1
4.6
Runs Created Per 27 Outs
4.4
.091
Walks Per Plate Appearance
.092
0.41
Walk To Strikeout Ratio
0.43
.152
Isolated Power
.156
.277
Secondary Average
.282
3.82
Pitches Per Plate Appearance
3.90
433
Extra Base Hits
429
5900
Plate Appearances
5841
32.3
At Bats Per Home Run
28.9
23
Sacrifice Hit
24
46
Sacrifice Flies
45
Pitching
156
Team Games Played
156
47
Quality Starts
37
76
Wins
87
80
Losses
69
33
Saves
47
87
Holds
103
1229
Hits
1252
634
Earned runs
605
167
Home Runs
174
542
Walks
528
1265
Strikeouts
1267
8.3
Strikeouts Per 9 Innings
8.2
145.7
Pitches Per Start
146.7
1.29
Walks Plus Hits Per Inning Pitched
1.29
4.16
Earned Run Average
3.94
80
Losses
69
1372.1
Innings pitched
1383.1
.487
Win Percentage
.558
54
Save Opportunities
66
.237
Opponent Batting Average
.241
.317
Opponent's On-base pct.
.317
.387
Opponent's Slugging pct.
.392
.703
Opponent's OPB Pct + SLG Pct
.709
5183
At Bats
5194
228
Doubles
221
23
Triples
20
78
Batters Hit
62
132
Stolen Bases
104
156
Games Played
156
1
Complete Games
0
13
Shutouts
11
51
Wild Pitches
40
652
Runs Batted In
627
6
Balks
4
1372.1
Innings pitched
1383.1
8.3
Strikeouts Per 9 Innings
8.2
42
Caught Stealing
50
156
Games Started
156
0.0
Wins Above Replacement
0.0
1
Is Qualified
1
695
Runs
649
634
Earned Runs
605
2004
Total Bases
2035
Fielding
156
Team Games Played
156
1372
Full Innings
1383
5517
Total Chances
5594
4117
Putouts
4150
1303
Assists
1381
97
Errors
63
237
Double Plays
228
0.982
Fielding Percentage
0.989
35.5
Range Factor
36.0
0.0
Zone Rating
0.0
156
Games Played
156
0
Games Started
0
0.0
Defensive Wins Above Replacement
0.0
1
Qualified
1