

Marlins vs Phillies Live Score (17 Aug, 2026)
Game Information
Stage
Standard
Season
2026
First Pitch
Mon, Aug 17, 6:40 pm
Venue
Citizens Bank Park
Location
Philadelphia, Pennsylvania
Attendance
37,544
Injury Report
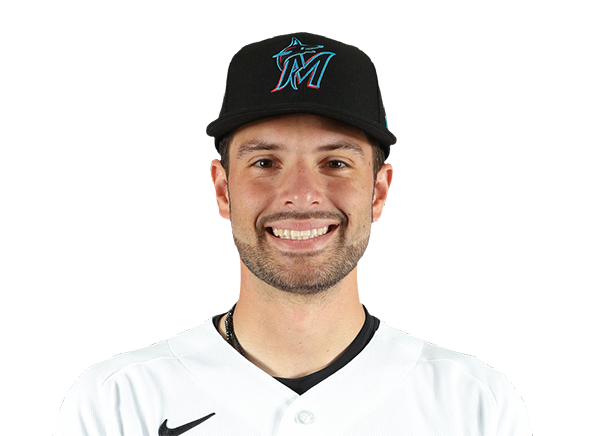

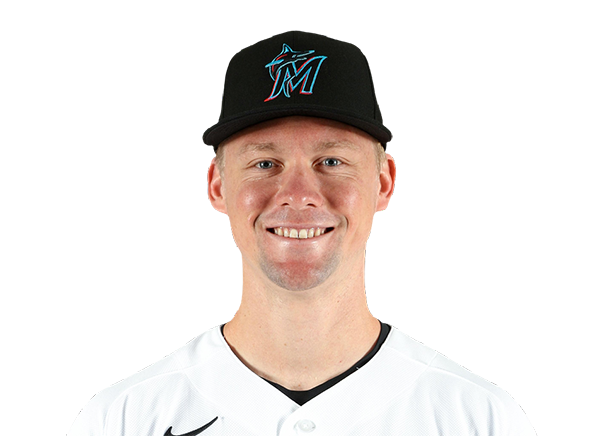

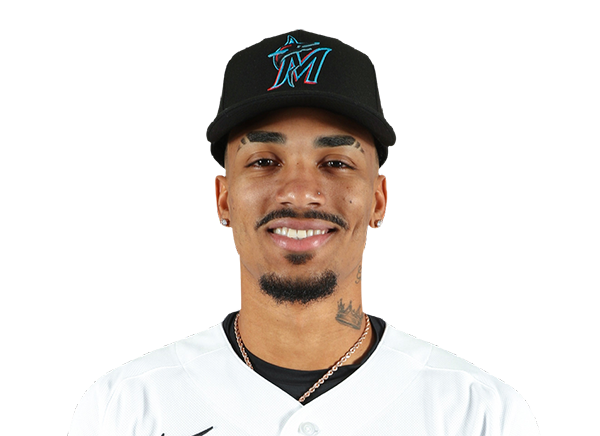
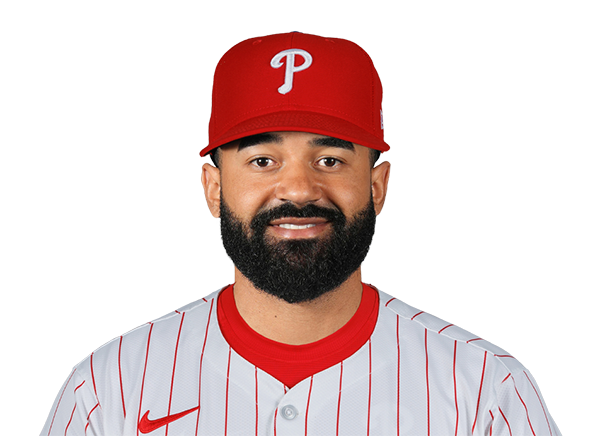




Team Stats
 MIA
PHI


Array
Runs
Array
14
Hits
11
1
Errors
0
—
Home Runs
—
—
Walks
—
—
Strikeouts
—
Standings
American League
| Team | W | L | PCT | GB | DIFF | STRK |
|---|---|---|---|---|---|---|
1 Rays | 76 | 53 | .589 | - | +42 | L3 |
2 White Sox | 67 | 61 | .523 | 8.5 | +47 | W1 |
3 Astros | 65 | 64 | .504 | 11 | -42 | W1 |
4 Yankees | 73 | 56 | .566 | 3 | +95 | L1 |
5 Red Sox | 69 | 59 | .539 | 6.5 | +97 | W1 |
6 Rangers | 64 | 66 | .492 | 12.5 | -48 | L1 |
7 Blue Jays | 64 | 67 | .489 | 13 | -50 | W1 |
8 Twins | 63 | 66 | .488 | 13 | -45 | L1 |
9 Guardians | 63 | 66 | .488 | 13 | -15 | W2 |
10 Orioles | 63 | 67 | .485 | 13.5 | -33 | W2 |
11 Mariners | 62 | 68 | .477 | 14.5 | -44 | W2 |
12 Tigers | 61 | 68 | .473 | 15 | +77 | L4 |
13 Royals | 57 | 74 | .435 | 20 | -95 | W7 |
14 Angels | 52 | 78 | .400 | 24.5 | -68 | W1 |
15 Athletics | 49 | 80 | .380 | 27 | -189 | L5 |
National League
| Team | W | L | PCT | GB | DIFF | STRK |
|---|---|---|---|---|---|---|
1 Brewers | 81 | 49 | .623 | - | +163 | W3 |
2 Dodgers | 78 | 51 | .605 | 2.5 | +146 | W4 |
3 Braves | 75 | 55 | .577 | 6 | +108 | L2 |
4 Cubs | 74 | 56 | .569 | 7 | +98 | L3 |
| 5Phillies | 72 | 58 | .554 | 9 | +25 | W8 |
6 Padres | 69 | 60 | .535 | 11.5 | +7 | W1 |
7 Diamondbacks | 68 | 61 | .527 | 12.5 | +13 | W2 |
| 8Marlins | 66 | 64 | .508 | 15 | +17 | W2 |
9 Cardinals | 66 | 65 | .504 | 15.5 | 0 | L2 |
10 Pirates | 63 | 67 | .485 | 18 | +30 | L1 |
11 Reds | 61 | 68 | .473 | 19.5 | -98 | L2 |
12 Nationals | 61 | 70 | .466 | 20.5 | +14 | L3 |
13 Mets | 58 | 71 | .450 | 22.5 | -44 | L1 |
14 Giants | 52 | 76 | .406 | 28 | -78 | L2 |
15 Rockies | 50 | 78 | .391 | 30 | -130 | L4 |
MIA
VS
PHI
Pitchers
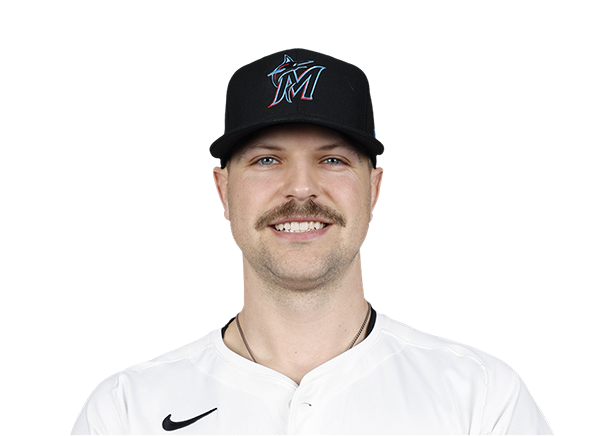
Janson Junk
Catchers
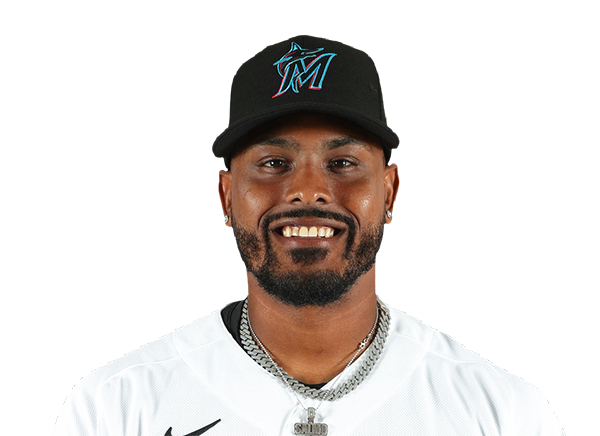
Brian Navarreto
Infielders
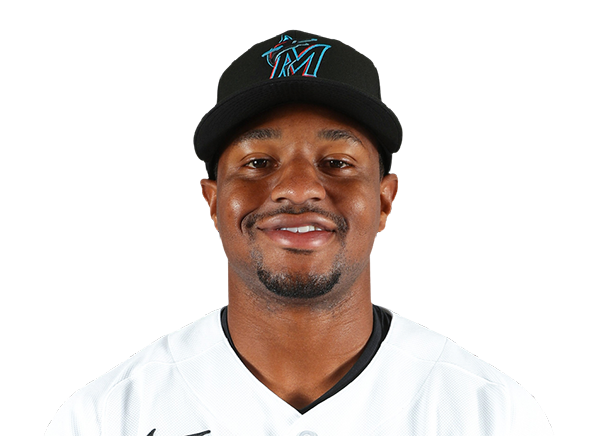
Xavier Edwards

Otto Lopez
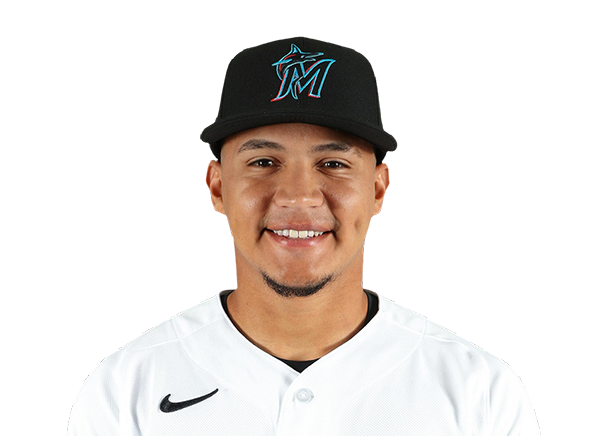
Javier Sanoja
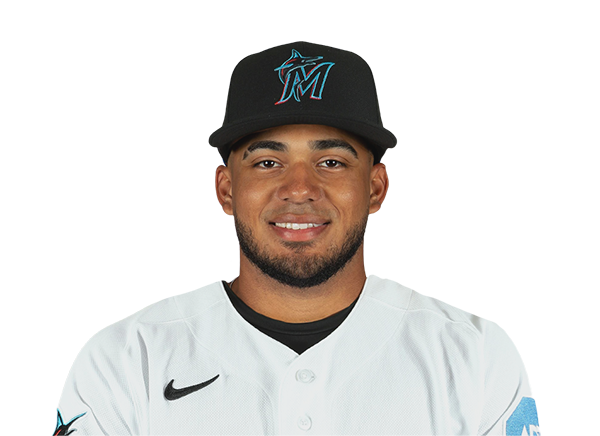
Leo Jimenez
Outfielders
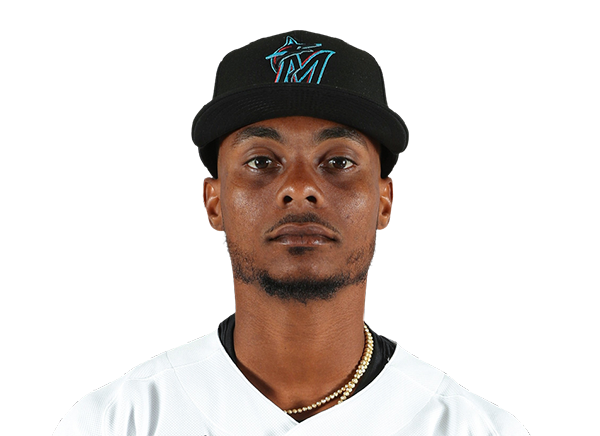
Esteury Ruiz
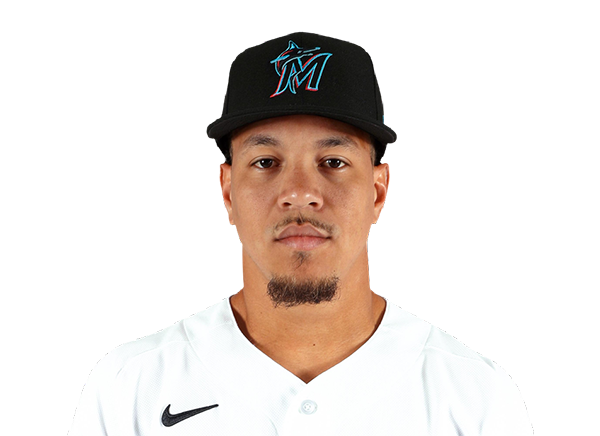
Heriberto Hernandez
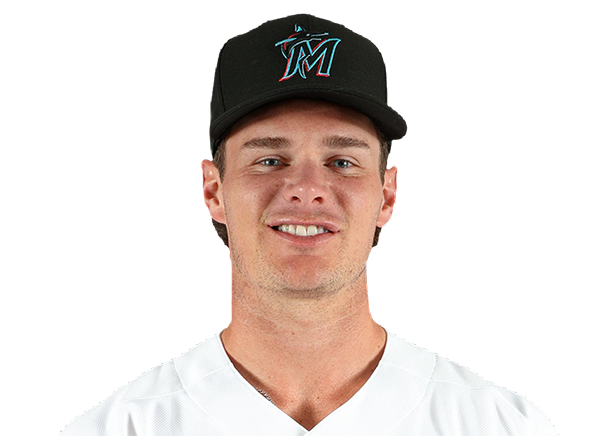
Griffin Conine
Designated Hitters
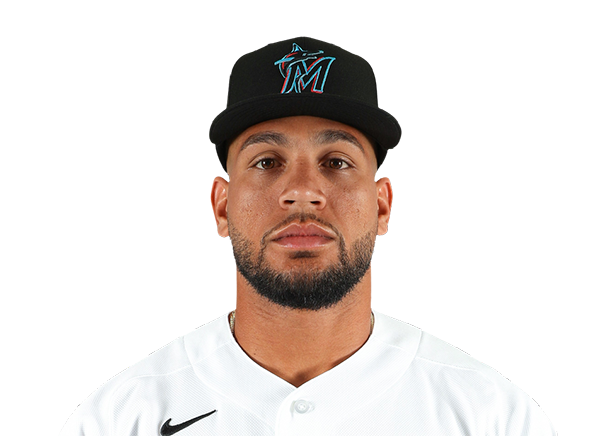
Agustin Ramirez
Pitchers

Cristopher Sanchez
Catchers

J.T. Realmuto
Infielders

Trea Turner
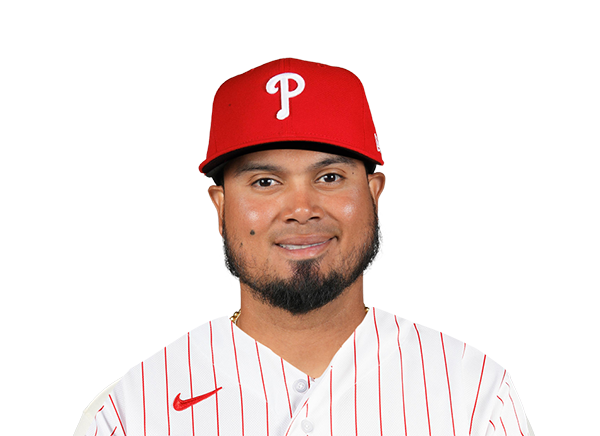
Luis Arraez

Alec Bohm

Bryson Stott
Outfielders

Bryce Harper

Brandon Marsh
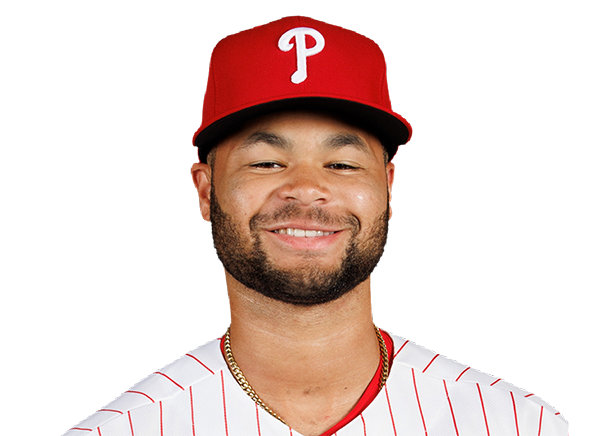
Justin Crawford
Designated Hitters

Kyle Schwarber
Marlins
VS
Phillies
Batting
126
Team Games Played
126
4188
At Bats
4222
1050
Hits
1013
533
Runs Batted In
545
129
Home Runs
154
130
Stolen Bases
95
.251
Batting Average
.240
555
Runs
564
202
Doubles
179
27
Triples
20
1693
Total Bases
1694
425
Walks
406
1026
Strikeouts
1071
.327
On Base Percentage
.311
.404
Slugging Percentage
.401
.731
OBP Pct + SLG Pct
.713
126
Games Played
126
126
Games Started
126
68
Hit By Pitch
52
0.0
Wins Above Replacement
0.0
0.0
Offensive Wins Above Replacement
0.0
42
Caught Stealing
15
1
Is Qualified
1
572.2
Runs Created
543.3
4.7
Runs Created Per 27 Outs
4.4
.090
Walks Per Plate Appearance
.086
0.41
Walk To Strikeout Ratio
0.38
.154
Isolated Power
.161
.276
Secondary Average
.276
3.80
Pitches Per Plate Appearance
3.89
358
Extra Base Hits
353
4740
Plate Appearances
4736
32.5
At Bats Per Home Run
27.4
19
Sacrifice Hit
10
39
Sacrifice Flies
43
Pitching
126
Team Games Played
126
44
Quality Starts
54
64
Wins
68
62
Losses
58
29
Saves
33
69
Holds
53
960
Hits
1079
483
Earned runs
517
127
Home Runs
148
421
Walks
386
1047
Strikeouts
1240
8.5
Strikeouts Per 9 Innings
10.0
143.3
Pitches Per Start
149.2
1.25
Walks Plus Hits Per Inning Pitched
1.31
3.93
Earned Run Average
4.16
62
Losses
58
1105.0
Innings pitched
1117.2
.508
Win Percentage
.540
44
Save Opportunities
49
.231
Opponent Batting Average
.251
.310
Opponent's On-base pct.
.319
.376
Opponent's Slugging pct.
.407
.686
Opponent's OPB Pct + SLG Pct
.726
4148
At Bats
4300
180
Doubles
185
19
Triples
22
63
Batters Hit
56
106
Stolen Bases
75
126
Games Played
126
1
Complete Games
1
12
Shutouts
15
35
Wild Pitches
31
507
Runs Batted In
528
4
Balks
3
1105.0
Innings pitched
1117.2
8.5
Strikeouts Per 9 Innings
10.0
31
Caught Stealing
34
126
Games Started
126
0.0
Wins Above Replacement
0.0
1
Is Qualified
1
536
Runs
554
483
Earned Runs
517
1559
Total Bases
1752
Fielding
126
Team Games Played
126
1105
Full Innings
1118
4440
Total Chances
4448
3315
Putouts
3353
1043
Assists
1033
82
Errors
62
202
Double Plays
179
0.982
Fielding Percentage
0.986
35.5
Range Factor
35.3
0.0
Zone Rating
0.0
126
Games Played
126
0
Games Started
0
0.0
Defensive Wins Above Replacement
0.0
1
Qualified
1