

Mets vs Braves Live Score (10 Aug, 2026)
Game Information
Stage
Standard
Season
2026
First Pitch
Mon, Aug 10, 7:15 pm
Venue
Truist Park
Location
Atlanta, Georgia
Attendance
28,402
Home Runs
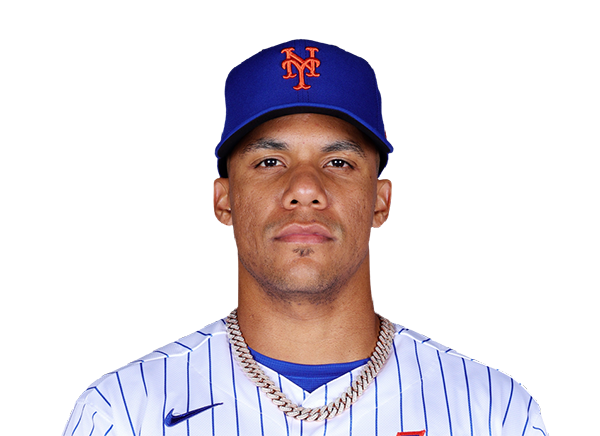
Juan Soto
21 HR
.283 AVG
52 RBI
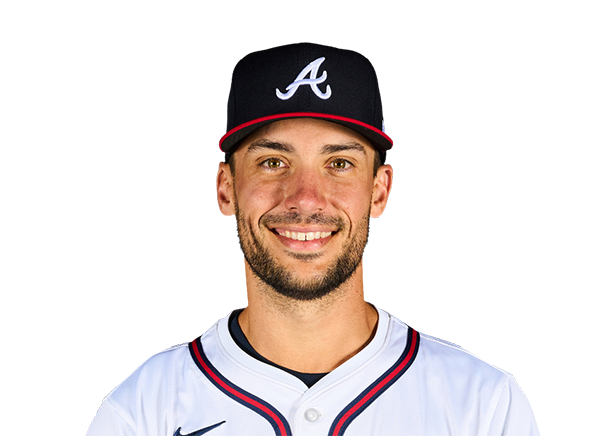
Matt Olson
34 HR
.266 AVG
72 RBI
Batting Average
Carson Benge
.272 AVG
.332 OBP
.412 SLG

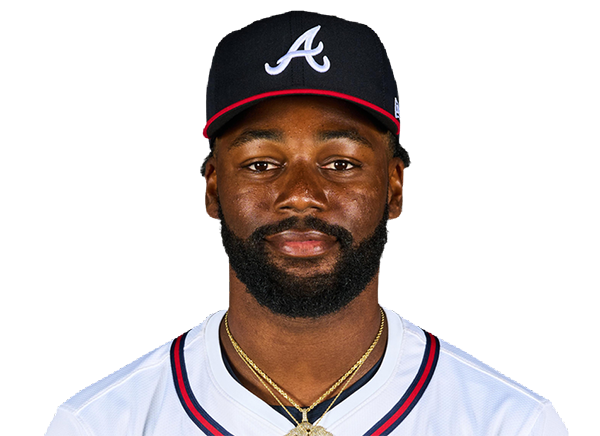
Michael Harris II
.291 AVG
.319 OBP
.493 SLG
Runs Batted In
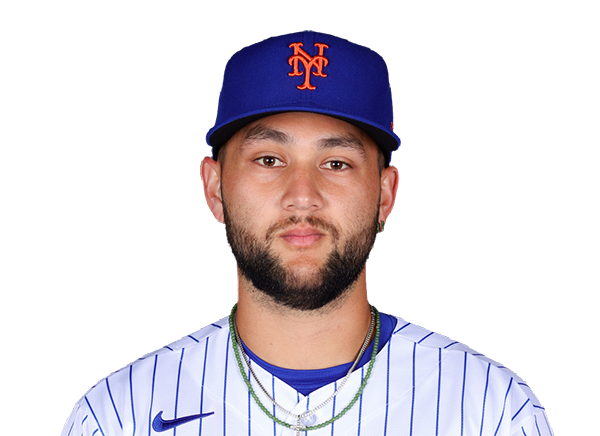
Bo Bichette
59 RBI
11 HR
.263 AVG
Matt Olson
72 RBI
34 HR
.266 AVG
Earned Run Average
Nolan McLean
3.51 ERA
8 W
156 K

Chris Sale
2.20 ERA
12 W
151 K

Wins
Nolan McLean
8 W
3.51 ERA
156 K
Chris Sale
12 W
2.20 ERA
151 K
Strikeouts
Nolan McLean
156 K
8 W
3.51 ERA
Chris Sale
151 K
12 W
2.20 ERA
Injury Report

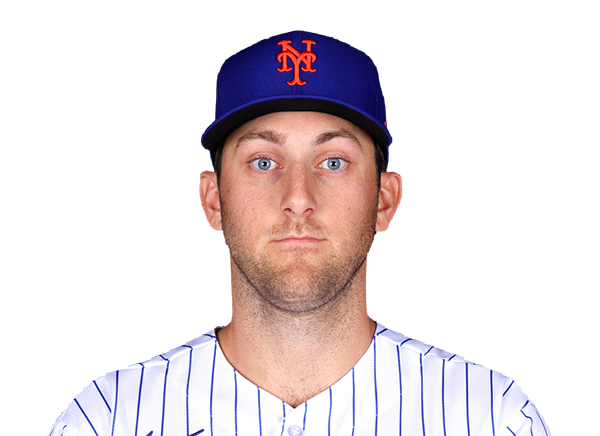
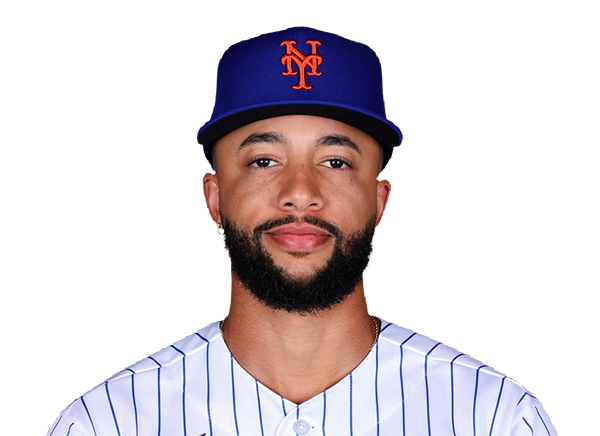
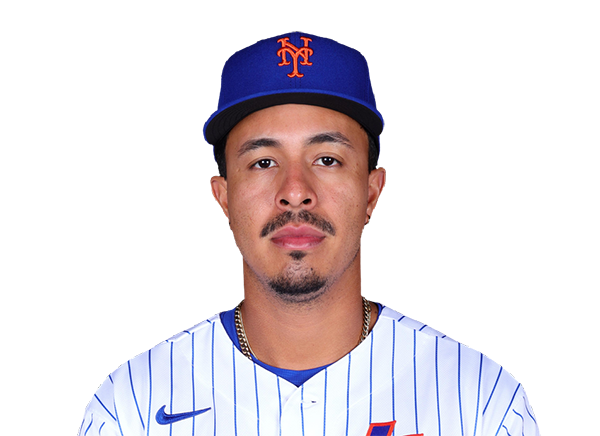
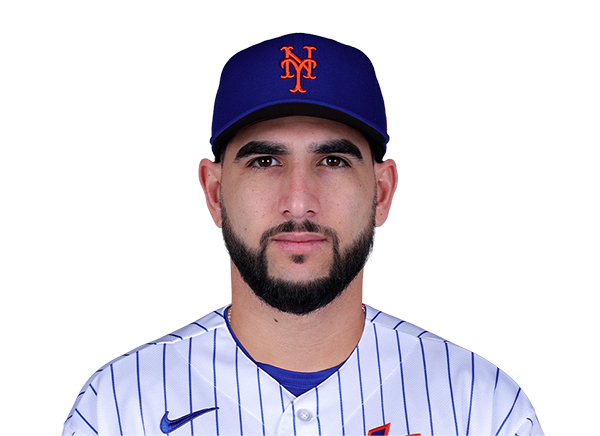

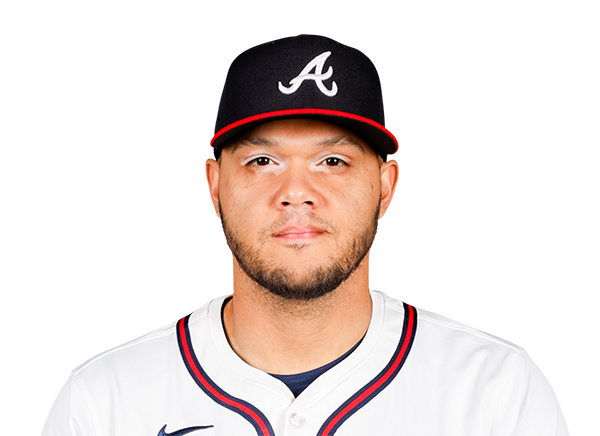
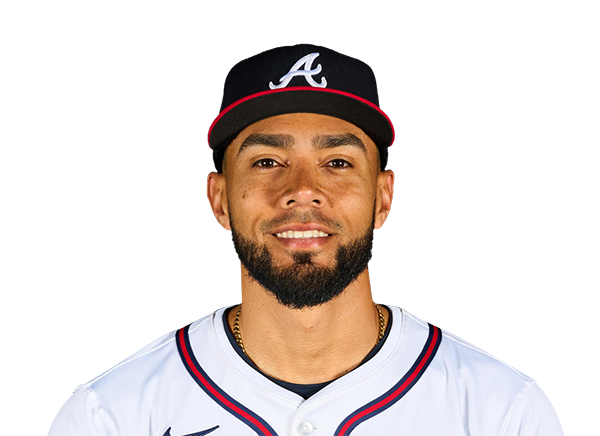
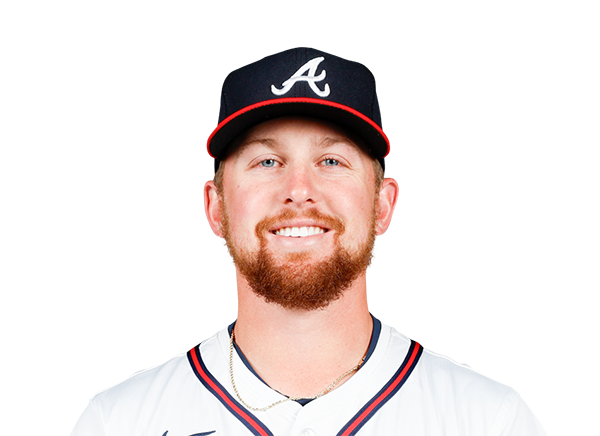
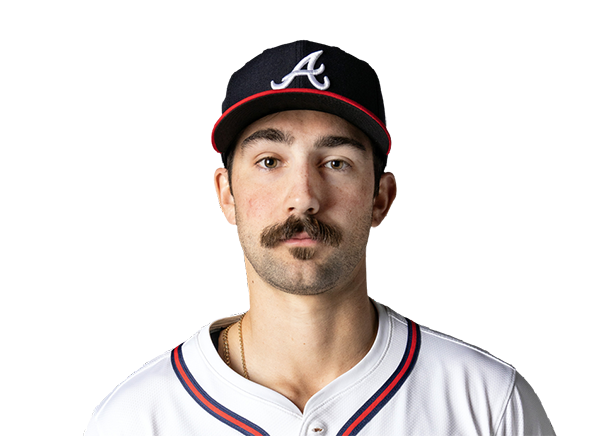
Team Stats
 NYM
ATL


Array
Runs
Array
12
Hits
9
0
Errors
0
—
Home Runs
—
—
Walks
—
—
Strikeouts
—
Standings
American League
| Team | W | L | PCT | GB | DIFF | STRK |
|---|---|---|---|---|---|---|
1 Rays | 76 | 52 | .594 | - | +43 | L2 |
2 White Sox | 67 | 61 | .523 | 9 | +47 | W1 |
3 Astros | 65 | 64 | .504 | 11.5 | -42 | W1 |
4 Yankees | 73 | 56 | .566 | 3.5 | +95 | L1 |
5 Red Sox | 69 | 59 | .539 | 7 | +97 | W1 |
6 Rangers | 64 | 65 | .496 | 12.5 | -45 | W2 |
7 Blue Jays | 64 | 67 | .489 | 13.5 | -50 | W1 |
8 Twins | 63 | 66 | .488 | 13.5 | -45 | L1 |
9 Guardians | 63 | 66 | .488 | 13.5 | -15 | W2 |
10 Orioles | 62 | 67 | .481 | 14.5 | -34 | W1 |
11 Tigers | 61 | 67 | .477 | 15 | +79 | L3 |
12 Mariners | 61 | 68 | .473 | 15.5 | -45 | W1 |
13 Royals | 56 | 74 | .431 | 21 | -97 | W6 |
14 Angels | 51 | 78 | .395 | 25.5 | -71 | L1 |
15 Athletics | 49 | 80 | .380 | 27.5 | -189 | L5 |
National League
| Team | W | L | PCT | GB | DIFF | STRK |
|---|---|---|---|---|---|---|
1 Brewers | 81 | 49 | .623 | - | +163 | W3 |
2 Dodgers | 78 | 51 | .605 | 2.5 | +146 | W4 |
| 3Braves | 75 | 55 | .577 | 6 | +108 | L2 |
4 Cubs | 74 | 55 | .574 | 6.5 | +99 | L2 |
5 Phillies | 71 | 58 | .550 | 9.5 | +16 | W7 |
6 Padres | 69 | 60 | .535 | 11.5 | +7 | W1 |
7 Diamondbacks | 68 | 61 | .527 | 12.5 | +13 | W2 |
8 Cardinals | 66 | 64 | .508 | 15 | +9 | L1 |
9 Marlins | 65 | 64 | .504 | 15.5 | +15 | W1 |
10 Pirates | 63 | 67 | .485 | 18 | +30 | L1 |
11 Reds | 61 | 68 | .473 | 19.5 | -98 | L2 |
12 Nationals | 61 | 69 | .469 | 20 | +16 | L2 |
| 13Mets | 58 | 71 | .450 | 22.5 | -44 | L1 |
14 Giants | 52 | 76 | .406 | 28 | -78 | L2 |
15 Rockies | 50 | 78 | .391 | 30 | -130 | L4 |
NYM
VS
ATL
Pitchers
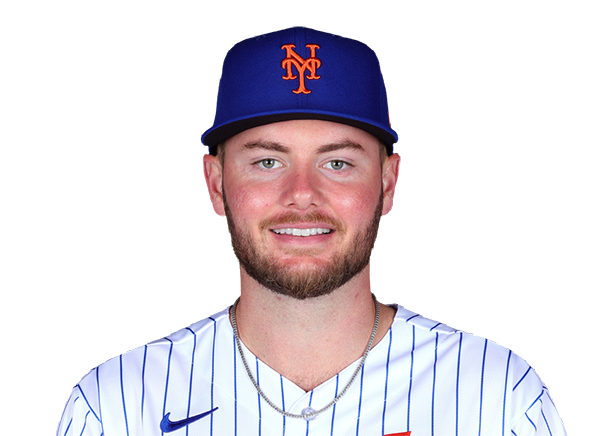
Christian Scott
Catchers
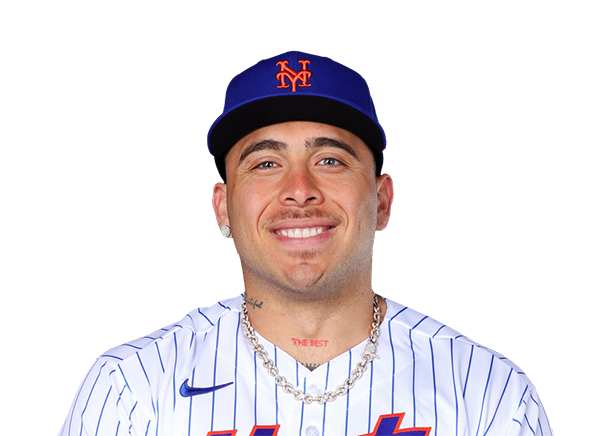
Francisco Alvarez
Infielders
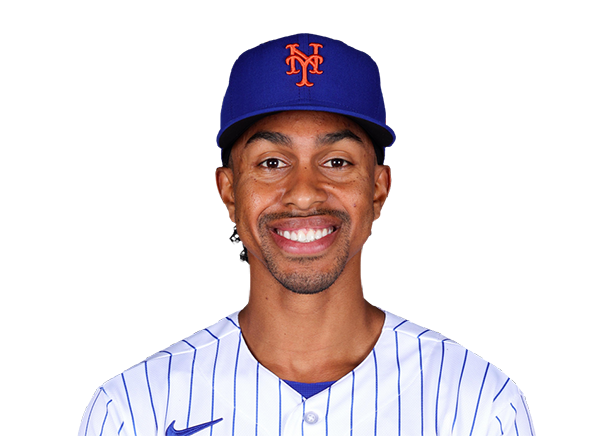
Francisco Lindor
Bo Bichette
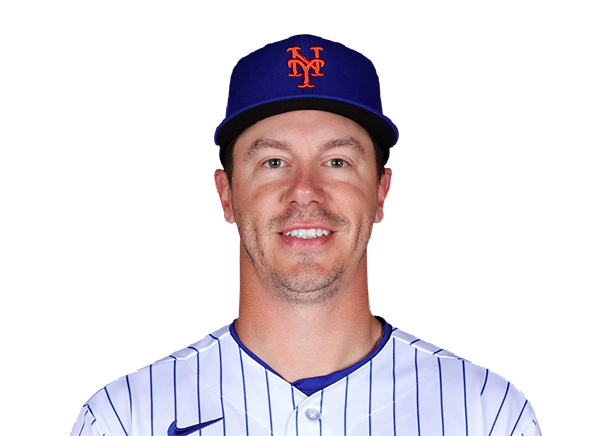
Jared Young

Marcus Semien
Outfielders
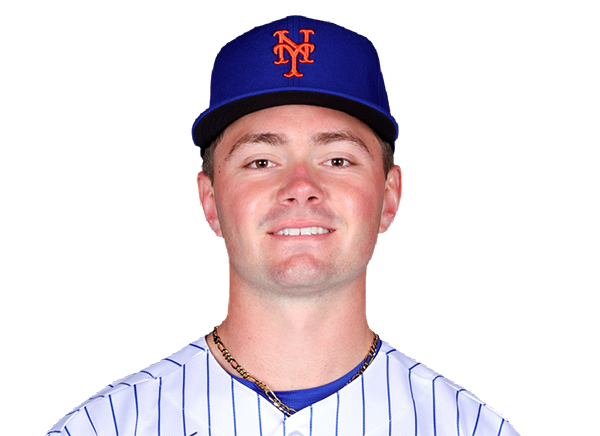
A.J. Ewing
Carson Benge

Brett Baty
Designated Hitters
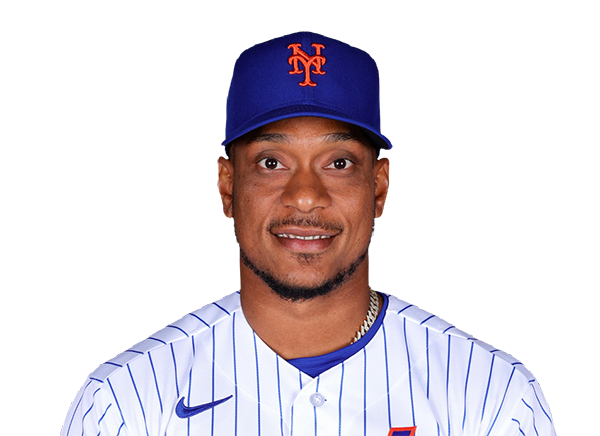
Jorge Polanco
Pitchers
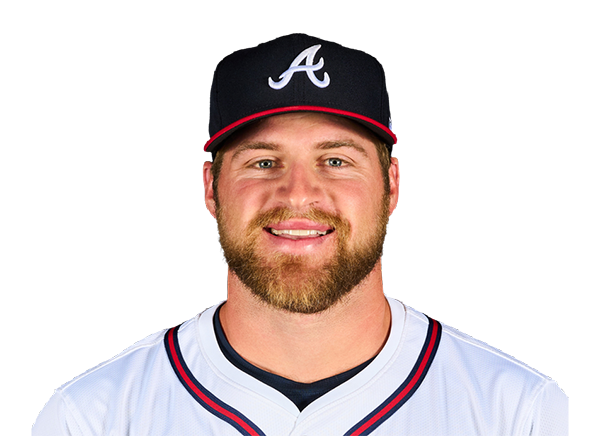
Bryce Elder
Catchers

Sean Murphy
Infielders
Matt Olson
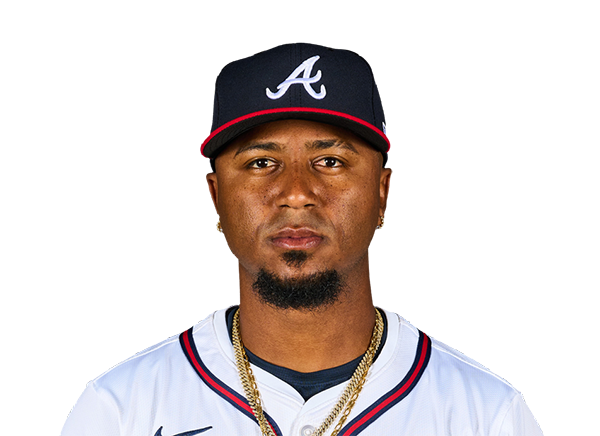
Ozzie Albies
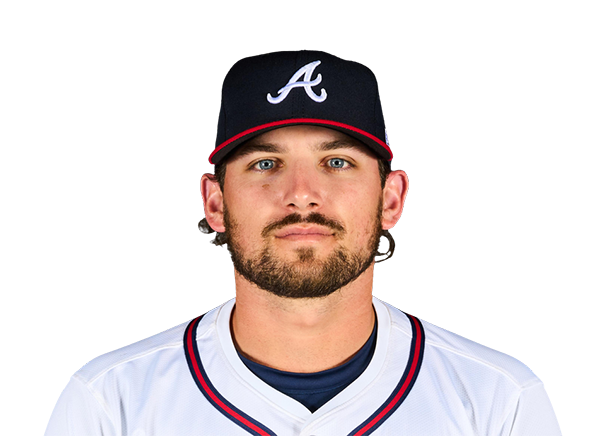
Austin Riley

Jim Jarvis
Outfielders
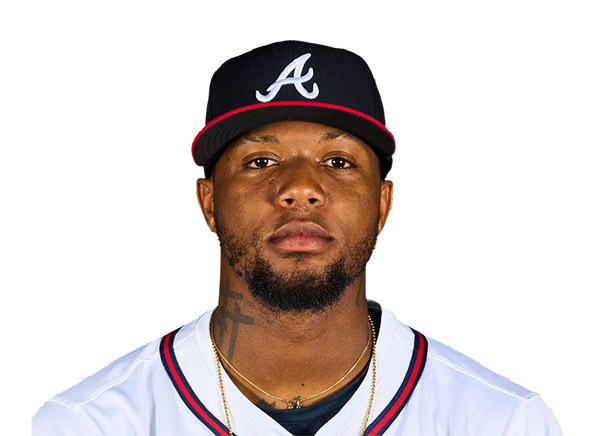
Ronald Acuna Jr.
Michael Harris II

Mauricio Dubon
Designated Hitters
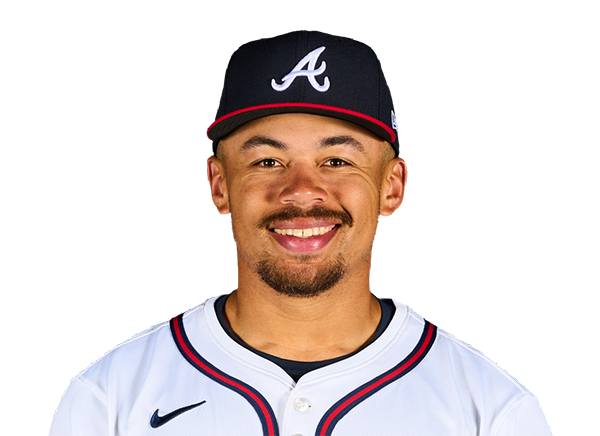
Drake Baldwin
Mets
VS
Braves
Batting
120
Team Games Played
119
4045
At Bats
4042
955
Hits
1006
484
Runs Batted In
558
145
Home Runs
159
63
Stolen Bases
57
.236
Batting Average
.249
507
Runs
581
151
Doubles
190
16
Triples
9
1573
Total Bases
1691
387
Walks
352
1023
Strikeouts
965
.307
On Base Percentage
.314
.389
Slugging Percentage
.418
.696
OBP Pct + SLG Pct
.732
120
Games Played
119
120
Games Started
119
42
Hit By Pitch
48
0.0
Wins Above Replacement
0.0
0.0
Offensive Wins Above Replacement
0.0
25
Caught Stealing
19
1
Is Qualified
1
487.0
Runs Created
541.3
4.1
Runs Created Per 27 Outs
4.6
.086
Walks Per Plate Appearance
.078
0.38
Walk To Strikeout Ratio
0.36
.153
Isolated Power
.169
.258
Secondary Average
.266
3.93
Pitches Per Plate Appearance
3.88
312
Extra Base Hits
358
4524
Plate Appearances
4486
27.9
At Bats Per Home Run
25.4
16
Sacrifice Hit
6
30
Sacrifice Flies
35
Pitching
120
Team Games Played
119
33
Quality Starts
42
53
Wins
71
67
Losses
48
21
Saves
37
49
Holds
86
971
Hits
903
489
Earned runs
428
127
Home Runs
135
427
Walks
412
1086
Strikeouts
1026
9.1
Strikeouts Per 9 Innings
8.7
149.6
Pitches Per Start
145.1
1.31
Walks Plus Hits Per Inning Pitched
1.24
4.11
Earned Run Average
3.64
67
Losses
48
1069.2
Innings pitched
1059.0
.442
Win Percentage
.597
35
Save Opportunities
53
.239
Opponent Batting Average
.229
.318
Opponent's On-base pct.
.306
.393
Opponent's Slugging pct.
.378
.711
Opponent's OPB Pct + SLG Pct
.684
4065
At Bats
3943
209
Doubles
149
18
Triples
16
58
Batters Hit
42
55
Stolen Bases
91
120
Games Played
119
0
Complete Games
0
5
Shutouts
6
29
Wild Pitches
25
522
Runs Batted In
444
3
Balks
3
1069.2
Innings pitched
1059.0
9.1
Strikeouts Per 9 Innings
8.7
25
Caught Stealing
17
120
Games Started
119
0.0
Wins Above Replacement
0.0
1
Is Qualified
1
547
Runs
464
489
Earned Runs
428
1597
Total Bases
1489
Fielding
120
Team Games Played
119
1070
Full Innings
1059
4243
Total Chances
4202
3209
Putouts
3177
955
Assists
969
79
Errors
56
151
Double Plays
190
0.981
Fielding Percentage
0.987
35.0
Range Factor
35.2
0.0
Zone Rating
0.0
120
Games Played
119
0
Games Started
0
0.0
Defensive Wins Above Replacement
0.0
1
Qualified
1