

Mets vs Braves Live Score (11 Aug, 2026)
Game Information
Stage
Standard
Season
2026
First Pitch
Tue, Aug 11, 7:15 pm
Venue
Truist Park
Location
Atlanta, Georgia
Attendance
24,711
Home Runs
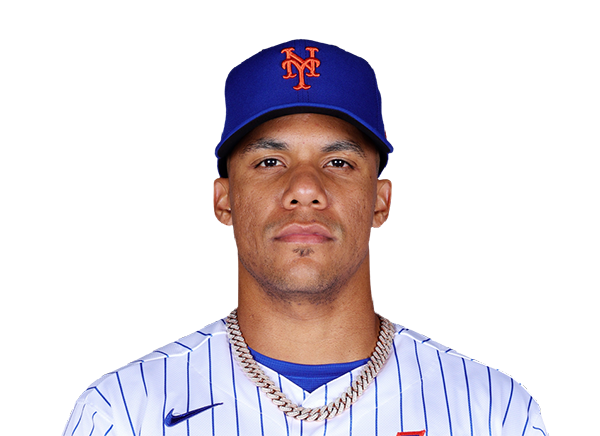
Juan Soto
21 HR
.283 AVG
52 RBI
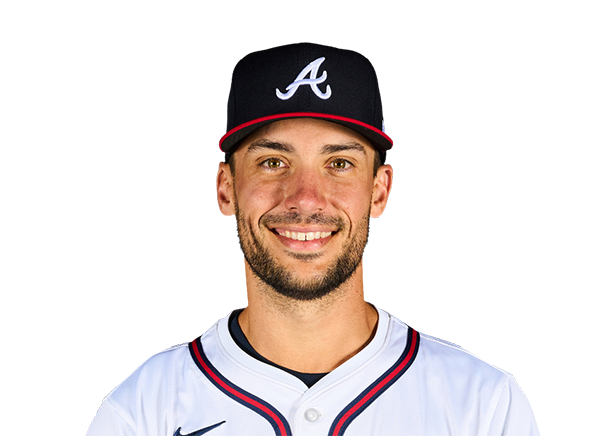
Matt Olson
34 HR
.266 AVG
72 RBI
Batting Average
Carson Benge
.270 AVG
.333 OBP
.409 SLG

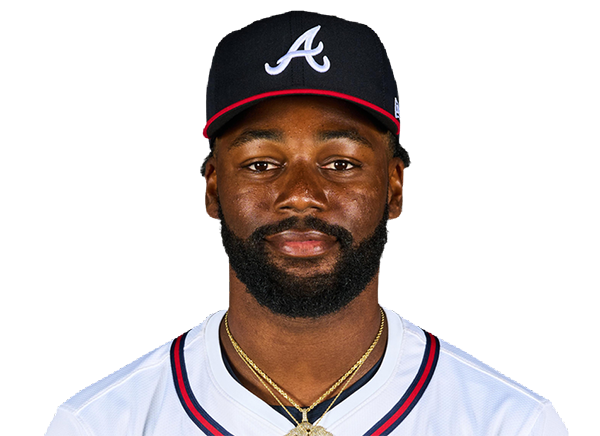
Michael Harris II
.292 AVG
.320 OBP
.494 SLG
Runs Batted In
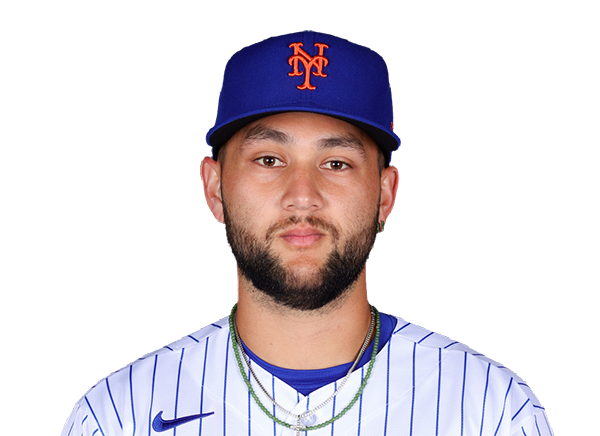
Bo Bichette
60 RBI
11 HR
.264 AVG
Matt Olson
72 RBI
34 HR
.266 AVG
Earned Run Average
Nolan McLean
3.51 ERA
8 W
156 K

Chris Sale
2.20 ERA
12 W
151 K

Wins
Nolan McLean
8 W
3.51 ERA
156 K
Chris Sale
12 W
2.20 ERA
151 K
Strikeouts
Nolan McLean
156 K
8 W
3.51 ERA
Chris Sale
151 K
12 W
2.20 ERA
Injury Report

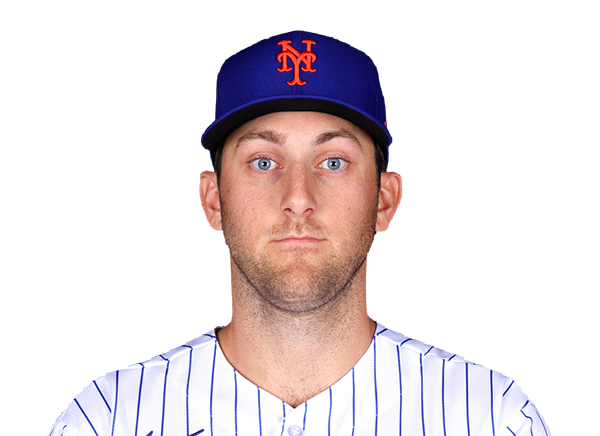
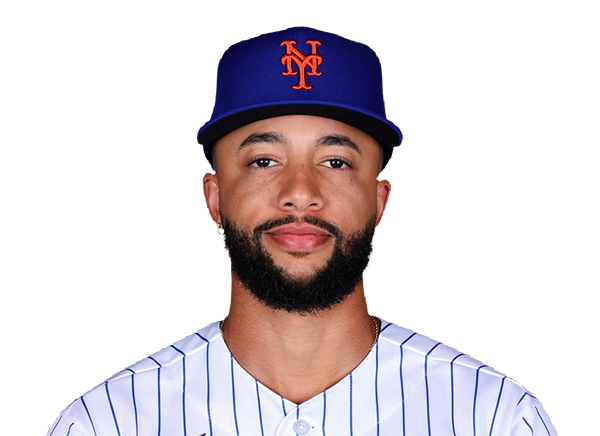
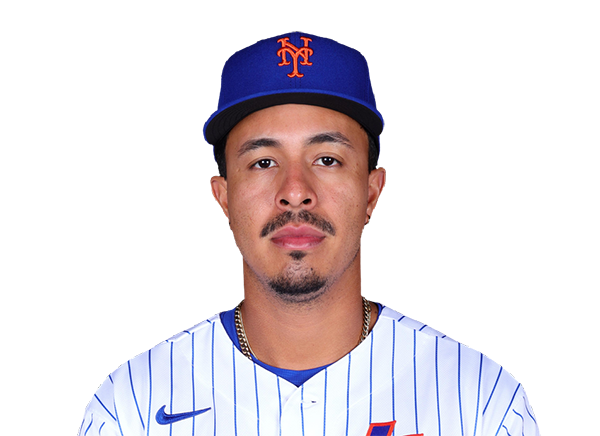
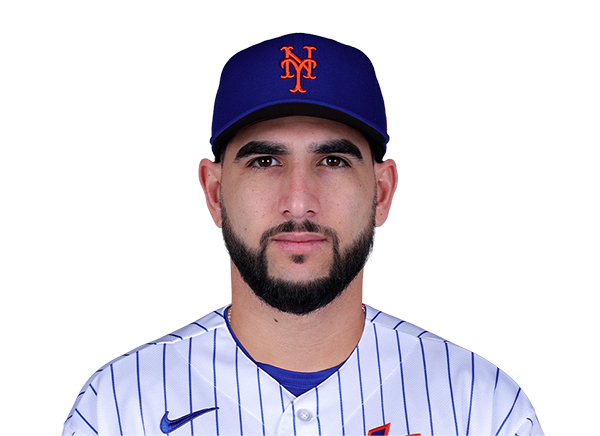

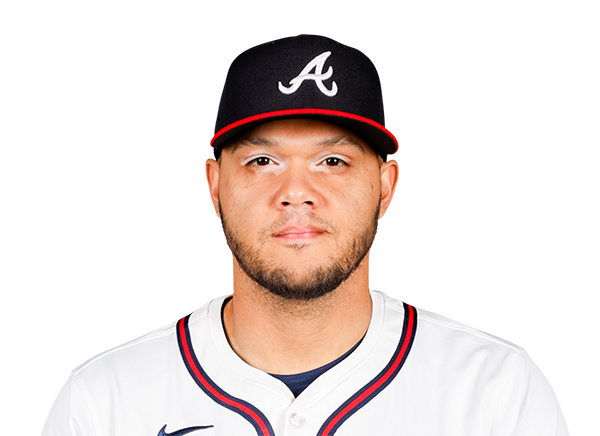
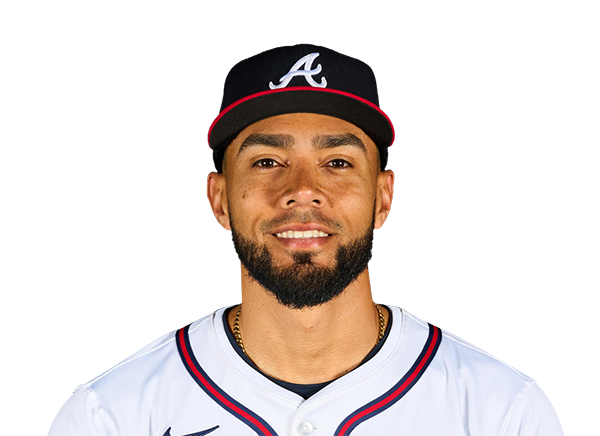
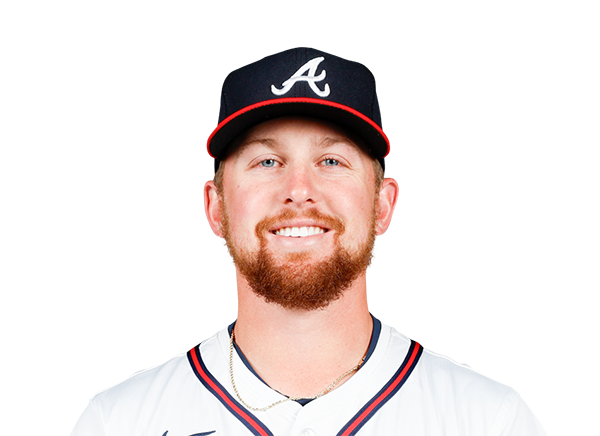
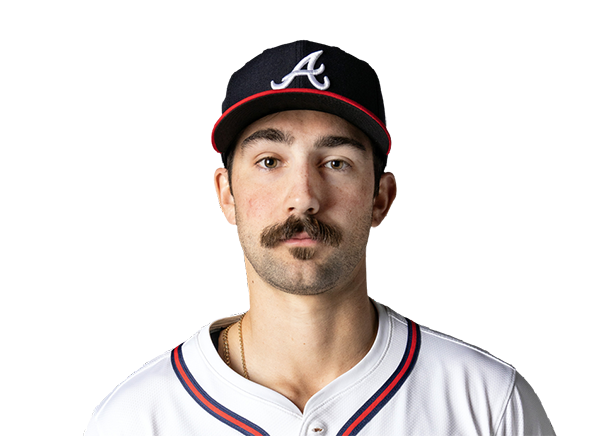
Team Stats
 NYM
ATL


Array
Runs
Array
4
Hits
3
0
Errors
0
—
Home Runs
—
—
Walks
—
—
Strikeouts
—
Standings
American League
| Team | W | L | PCT | GB | DIFF | STRK |
|---|---|---|---|---|---|---|
1 Rays | 76 | 53 | .589 | - | +42 | L3 |
2 White Sox | 67 | 62 | .519 | 9 | +42 | L1 |
3 Astros | 65 | 65 | .500 | 11.5 | -43 | L1 |
4 Yankees | 73 | 56 | .566 | 3 | +95 | L1 |
5 Red Sox | 70 | 59 | .543 | 6 | +98 | W2 |
6 Rangers | 64 | 66 | .492 | 12.5 | -48 | L1 |
7 Guardians | 64 | 66 | .492 | 12.5 | -14 | W3 |
8 Blue Jays | 64 | 67 | .489 | 13 | -50 | W1 |
9 Twins | 63 | 67 | .485 | 13.5 | -47 | L2 |
10 Orioles | 63 | 67 | .485 | 13.5 | -33 | W2 |
11 Mariners | 62 | 68 | .477 | 14.5 | -44 | W2 |
12 Tigers | 61 | 68 | .473 | 15 | +77 | L4 |
13 Royals | 57 | 74 | .435 | 20 | -95 | W7 |
14 Angels | 52 | 78 | .400 | 24.5 | -68 | W1 |
15 Athletics | 50 | 80 | .385 | 26.5 | -188 | W1 |
National League
| Team | W | L | PCT | GB | DIFF | STRK |
|---|---|---|---|---|---|---|
1 Brewers | 81 | 49 | .623 | - | +163 | W3 |
2 Dodgers | 79 | 51 | .608 | 2 | +147 | W5 |
| 3Braves | 75 | 55 | .577 | 6 | +108 | L2 |
4 Cubs | 74 | 56 | .569 | 7 | +98 | L3 |
5 Phillies | 72 | 58 | .554 | 9 | +25 | W8 |
6 Padres | 70 | 60 | .538 | 11 | +9 | W2 |
7 Diamondbacks | 68 | 62 | .523 | 13 | +7 | L1 |
8 Marlins | 66 | 64 | .508 | 15 | +17 | W2 |
9 Cardinals | 66 | 65 | .504 | 15.5 | 0 | L2 |
10 Pirates | 63 | 68 | .481 | 18.5 | +29 | L2 |
11 Reds | 62 | 68 | .477 | 19 | -92 | W1 |
12 Nationals | 61 | 70 | .466 | 20.5 | +14 | L3 |
| 13Mets | 59 | 71 | .454 | 22 | -39 | W1 |
14 Giants | 52 | 77 | .403 | 28.5 | -79 | L3 |
15 Rockies | 50 | 79 | .388 | 30.5 | -131 | L5 |
NYM
VS
ATL
Pitchers
Nolan McLean
Catchers
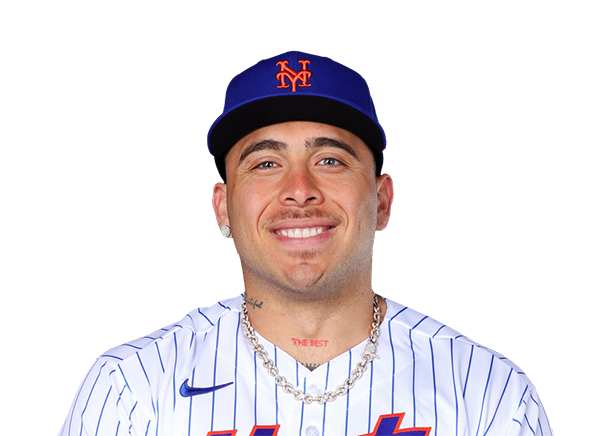
Francisco Alvarez
Infielders
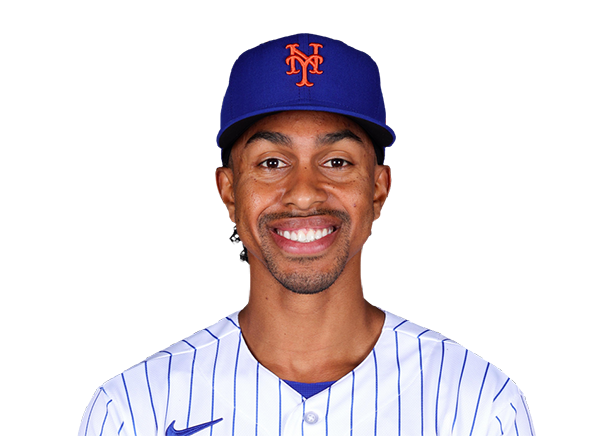
Francisco Lindor
Bo Bichette

Marcus Semien
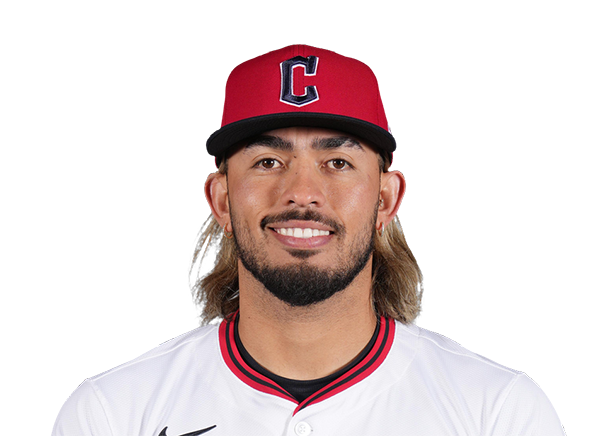
Gabriel Arias
Outfielders
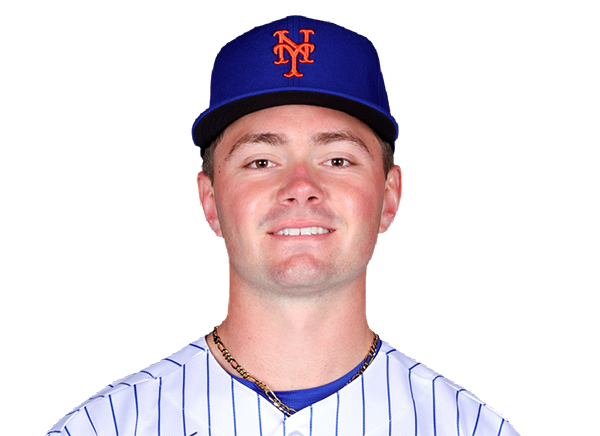
A.J. Ewing
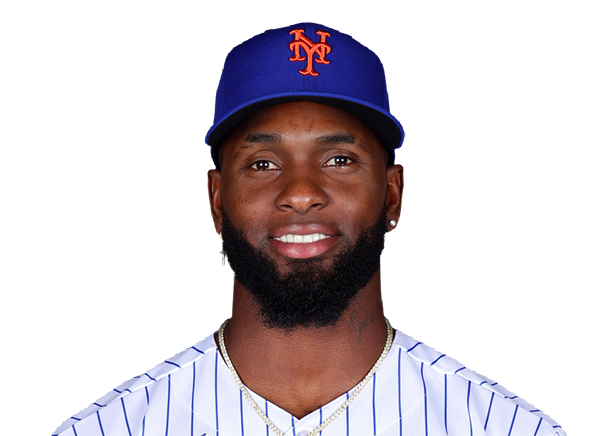
Luis Robert Jr.
Carson Benge
Designated Hitters
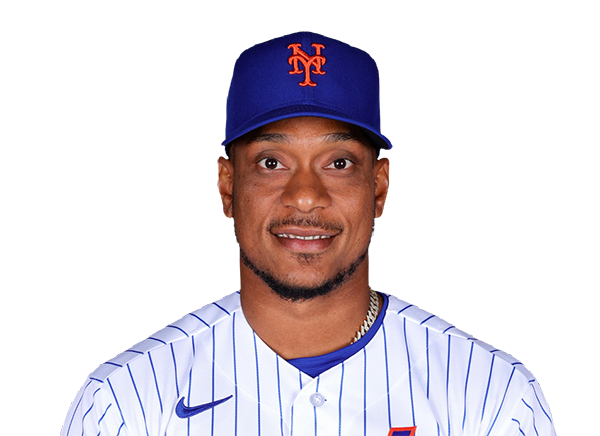
Jorge Polanco
Pitchers
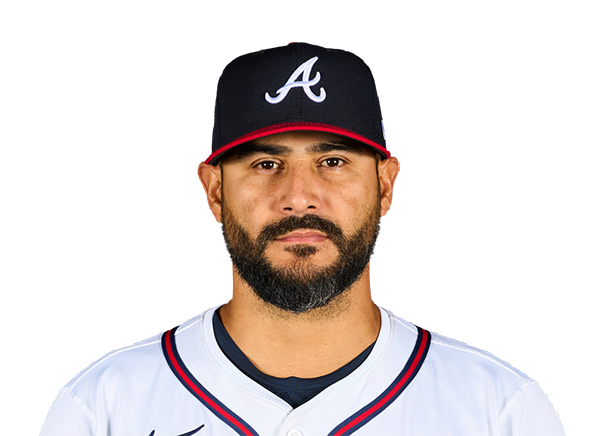
Martin Perez
Catchers
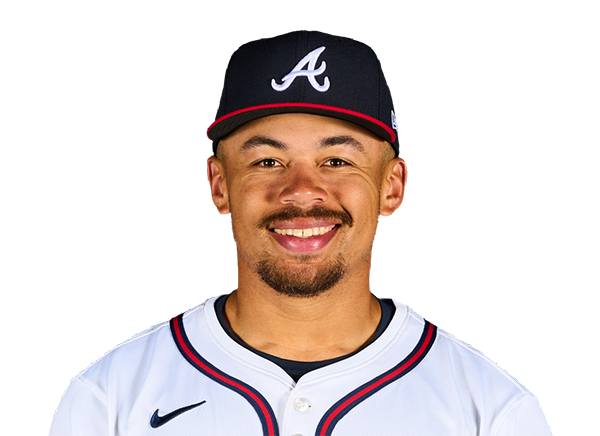
Drake Baldwin
Infielders
Matt Olson
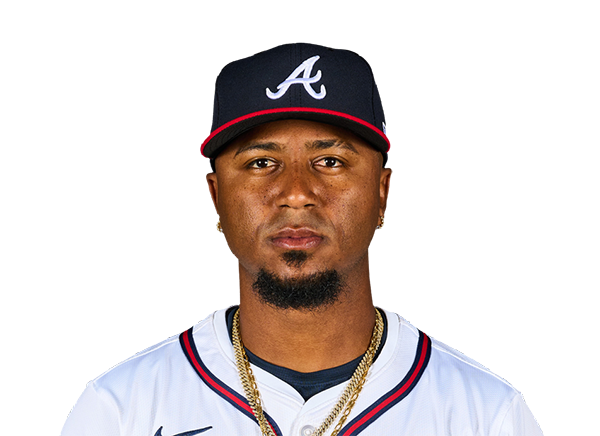
Ozzie Albies
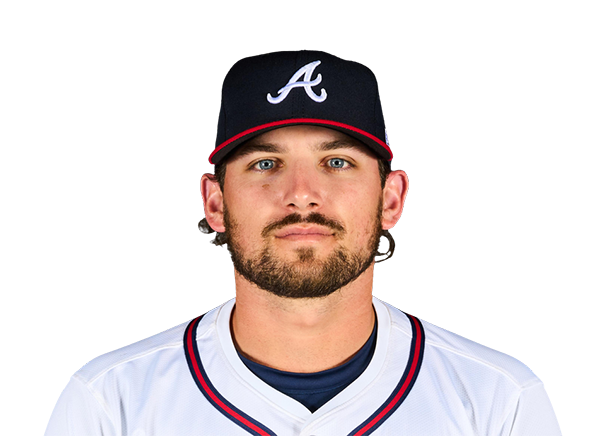
Austin Riley
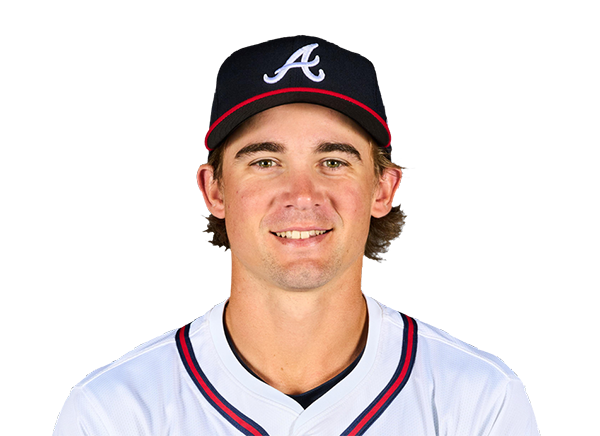
Jim Jarvis
Outfielders
Michael Harris II

Mauricio Dubon
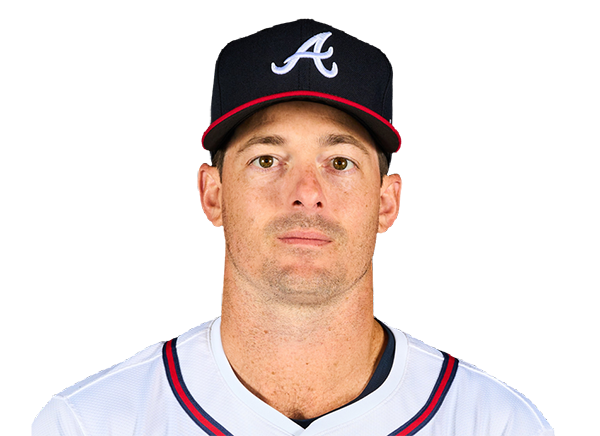
Mike Yastrzemski
Designated Hitters
Ronald Acuna Jr.
Mets
VS
Braves
Batting
121
Team Games Played
120
4074
At Bats
4067
959
Hits
1009
484
Runs Batted In
562
145
Home Runs
161
63
Stolen Bases
57
.235
Batting Average
.248
507
Runs
585
151
Doubles
190
16
Triples
9
1577
Total Bases
1700
390
Walks
358
1028
Strikeouts
969
.307
On Base Percentage
.314
.387
Slugging Percentage
.418
.694
OBP Pct + SLG Pct
.732
121
Games Played
120
121
Games Started
120
42
Hit By Pitch
48
0.0
Wins Above Replacement
0.0
0.0
Offensive Wins Above Replacement
0.0
25
Caught Stealing
20
1
Is Qualified
1
486.7
Runs Created
543.9
4.0
Runs Created Per 27 Outs
4.6
.086
Walks Per Plate Appearance
.079
0.38
Walk To Strikeout Ratio
0.37
.152
Isolated Power
.170
.257
Secondary Average
.267
3.93
Pitches Per Plate Appearance
3.89
312
Extra Base Hits
360
4556
Plate Appearances
4518
28.1
At Bats Per Home Run
25.3
16
Sacrifice Hit
6
30
Sacrifice Flies
36
Pitching
121
Team Games Played
120
34
Quality Starts
43
53
Wins
72
68
Losses
48
21
Saves
37
49
Holds
88
974
Hits
907
493
Earned runs
428
129
Home Runs
135
433
Walks
415
1090
Strikeouts
1031
9.1
Strikeouts Per 9 Innings
8.7
149.5
Pitches Per Start
144.8
1.31
Walks Plus Hits Per Inning Pitched
1.24
4.12
Earned Run Average
3.61
68
Losses
48
1077.2
Innings pitched
1068.0
.438
Win Percentage
.600
35
Save Opportunities
53
.238
Opponent Batting Average
.228
.318
Opponent's On-base pct.
.306
.393
Opponent's Slugging pct.
.376
.711
Opponent's OPB Pct + SLG Pct
.682
4090
At Bats
3972
209
Doubles
149
18
Triples
16
58
Batters Hit
42
55
Stolen Bases
91
121
Games Played
120
0
Complete Games
0
5
Shutouts
7
31
Wild Pitches
25
526
Runs Batted In
444
3
Balks
3
1077.2
Innings pitched
1068.0
9.1
Strikeouts Per 9 Innings
8.7
26
Caught Stealing
17
121
Games Started
120
0.0
Wins Above Replacement
0.0
1
Is Qualified
1
551
Runs
464
493
Earned Runs
428
1606
Total Bases
1493
Fielding
121
Team Games Played
120
1078
Full Innings
1068
4274
Total Chances
4238
3233
Putouts
3204
962
Assists
978
79
Errors
56
151
Double Plays
190
0.982
Fielding Percentage
0.987
35.0
Range Factor
35.2
0.0
Zone Rating
0.0
121
Games Played
120
0
Games Started
0
0.0
Defensive Wins Above Replacement
0.0
1
Qualified
1