

Mets vs Braves Live Score (12 Aug, 2026)
Game Information
Stage
Standard
Season
2026
First Pitch
Wed, Aug 12, 7:15 pm
Venue
Truist Park
Location
Atlanta, Georgia
Attendance
26,415
Home Runs
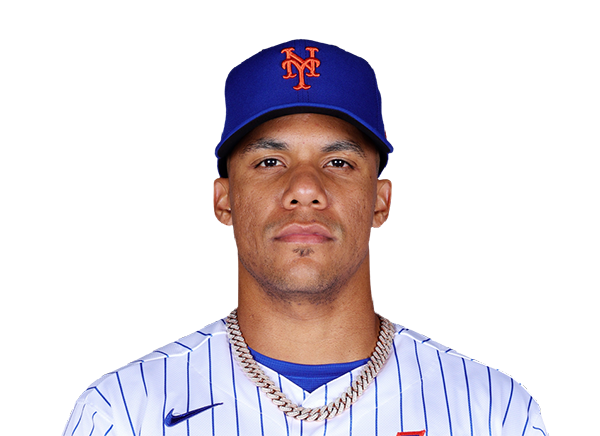
Juan Soto
21 HR
.283 AVG
52 RBI
Matt Olson
35 HR
.266 AVG
74 RBI

Batting Average
Carson Benge
.272 AVG
.334 OBP
.410 SLG

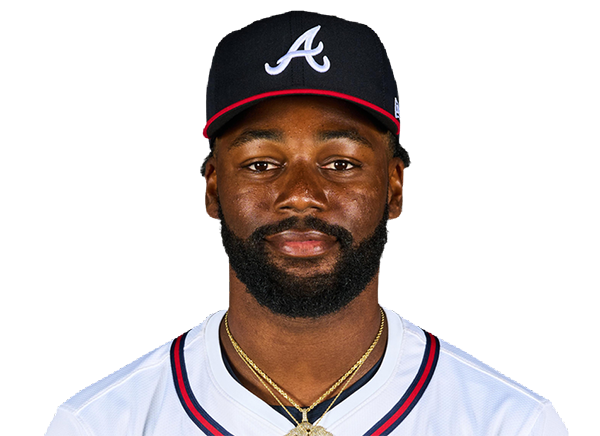
Michael Harris II
.293 AVG
.322 OBP
.493 SLG
Runs Batted In
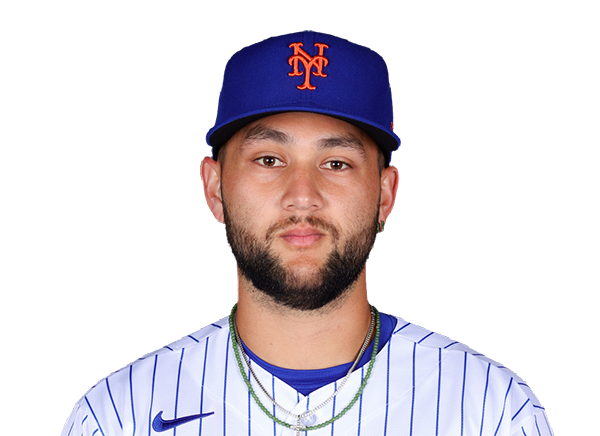
Bo Bichette
60 RBI
11 HR
.262 AVG
Matt Olson
74 RBI
35 HR
.266 AVG
Earned Run Average
Nolan McLean
3.42 ERA
8 W
159 K

Chris Sale
2.20 ERA
12 W
151 K

Wins
Nolan McLean
8 W
3.42 ERA
159 K
Chris Sale
12 W
2.20 ERA
151 K
Strikeouts
Nolan McLean
159 K
8 W
3.42 ERA
Chris Sale
151 K
12 W
2.20 ERA
Injury Report
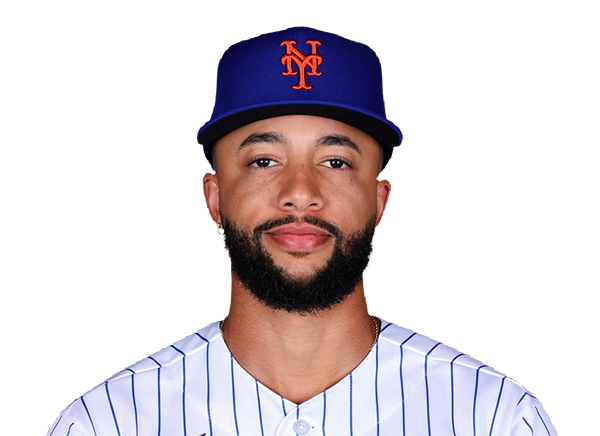
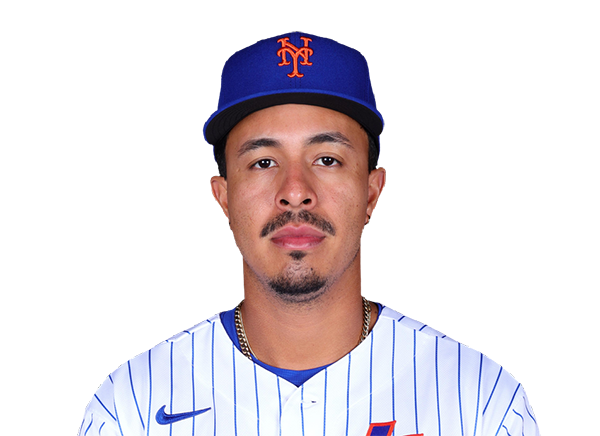
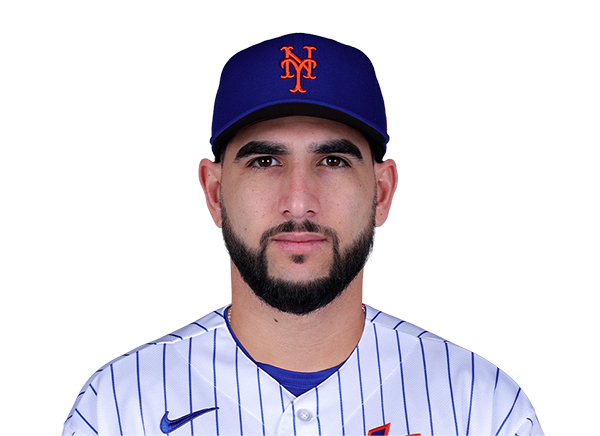

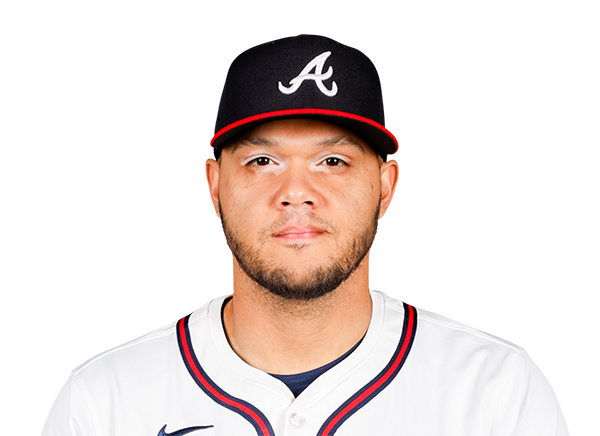
Team Stats
 NYM
ATL


Array
Runs
Array
7
Hits
12
0
Errors
0
—
Home Runs
—
—
Walks
—
—
Strikeouts
—
Standings
American League
| Team | W | L | PCT | GB | DIFF | STRK |
|---|---|---|---|---|---|---|
1 Rays | 76 | 52 | .594 | - | +43 | L2 |
2 White Sox | 67 | 61 | .523 | 9 | +47 | W1 |
3 Astros | 65 | 64 | .504 | 11.5 | -42 | W1 |
4 Yankees | 73 | 56 | .566 | 3.5 | +95 | L1 |
5 Red Sox | 69 | 59 | .539 | 7 | +97 | W1 |
6 Rangers | 64 | 65 | .496 | 12.5 | -45 | W2 |
7 Blue Jays | 64 | 67 | .489 | 13.5 | -50 | W1 |
8 Twins | 63 | 66 | .488 | 13.5 | -45 | L1 |
9 Guardians | 63 | 66 | .488 | 13.5 | -15 | W2 |
10 Orioles | 62 | 67 | .481 | 14.5 | -34 | W1 |
11 Tigers | 61 | 67 | .477 | 15 | +79 | L3 |
12 Mariners | 61 | 68 | .473 | 15.5 | -45 | W1 |
13 Royals | 56 | 74 | .431 | 21 | -97 | W6 |
14 Angels | 51 | 78 | .395 | 25.5 | -71 | L1 |
15 Athletics | 49 | 80 | .380 | 27.5 | -189 | L5 |
National League
| Team | W | L | PCT | GB | DIFF | STRK |
|---|---|---|---|---|---|---|
1 Brewers | 81 | 49 | .623 | - | +163 | W3 |
2 Dodgers | 78 | 51 | .605 | 2.5 | +146 | W4 |
| 3Braves | 75 | 55 | .577 | 6 | +108 | L2 |
4 Cubs | 74 | 55 | .574 | 6.5 | +99 | L2 |
5 Phillies | 71 | 58 | .550 | 9.5 | +16 | W7 |
6 Padres | 69 | 60 | .535 | 11.5 | +7 | W1 |
7 Diamondbacks | 68 | 61 | .527 | 12.5 | +13 | W2 |
8 Marlins | 66 | 64 | .508 | 15 | +17 | W2 |
9 Cardinals | 66 | 64 | .508 | 15 | +9 | L1 |
10 Pirates | 63 | 67 | .485 | 18 | +30 | L1 |
11 Reds | 61 | 68 | .473 | 19.5 | -98 | L2 |
12 Nationals | 61 | 70 | .466 | 20.5 | +14 | L3 |
| 13Mets | 58 | 71 | .450 | 22.5 | -44 | L1 |
14 Giants | 52 | 76 | .406 | 28 | -78 | L2 |
15 Rockies | 50 | 78 | .391 | 30 | -130 | L4 |
NYM
VS
ATL
Pitchers

Zac Thornton
Catchers
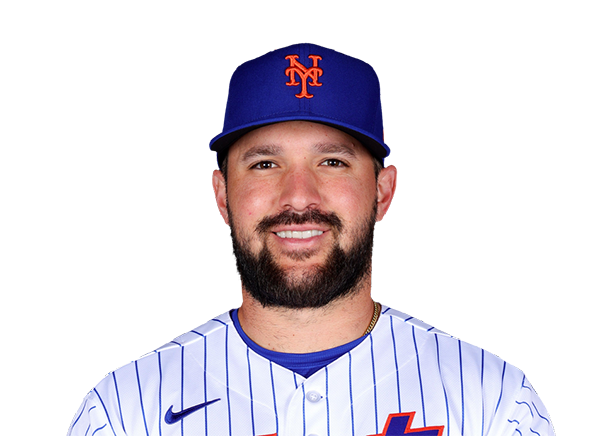
Luis Torrens
Infielders
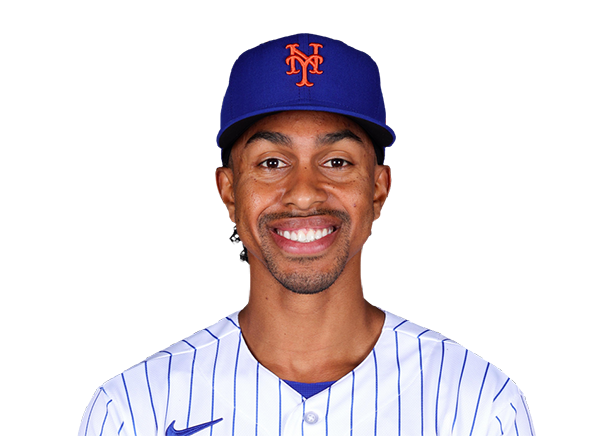
Francisco Lindor
Bo Bichette
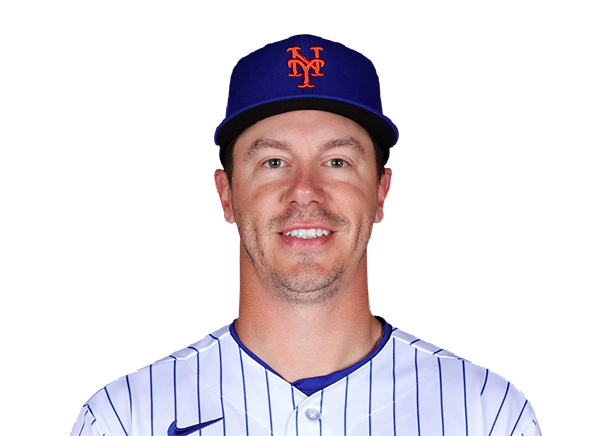
Jared Young

Brett Baty
Outfielders
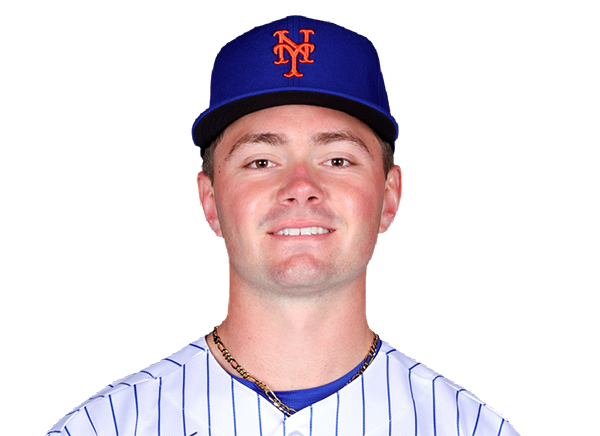
A.J. Ewing
Carson Benge
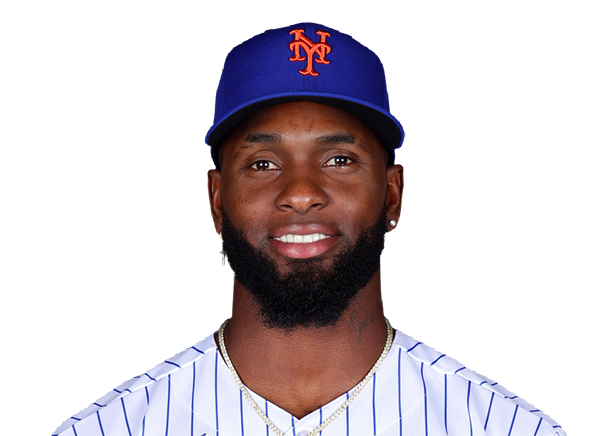
Luis Robert Jr.
Designated Hitters
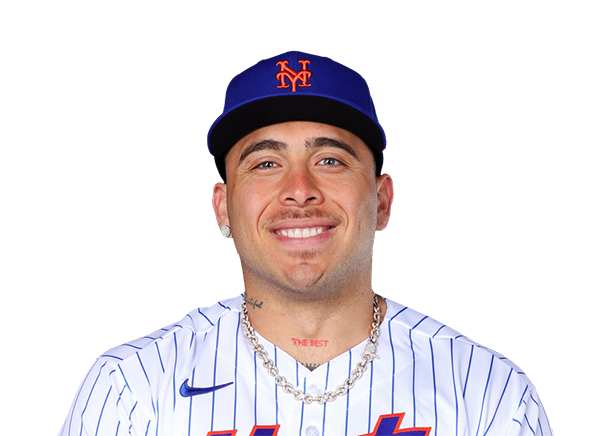
Francisco Alvarez
Pitchers
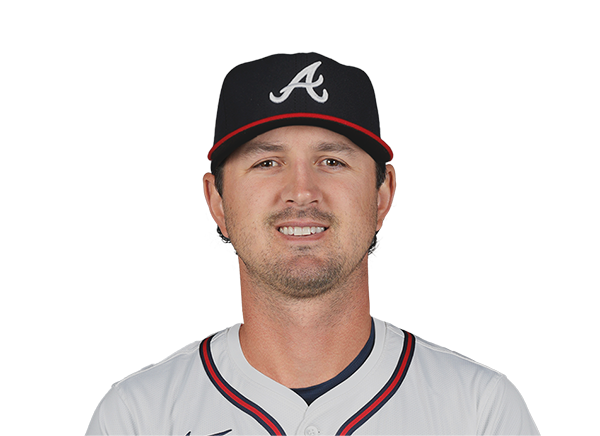
Tyler Mahle
Catchers

Sean Murphy
Infielders
Matt Olson
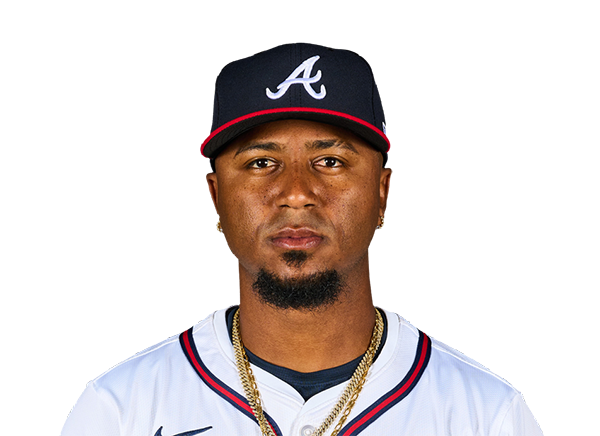
Ozzie Albies

Mauricio Dubon
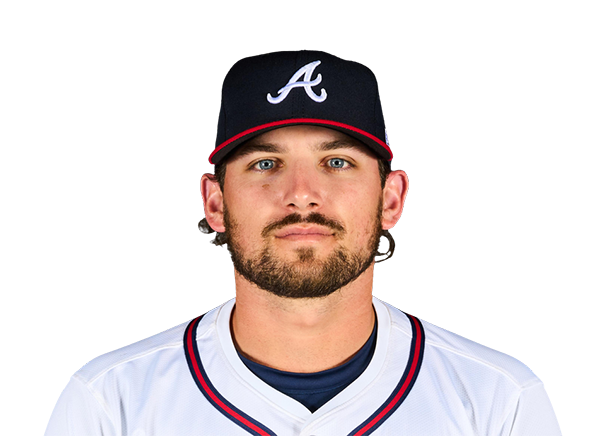
Austin Riley
Outfielders
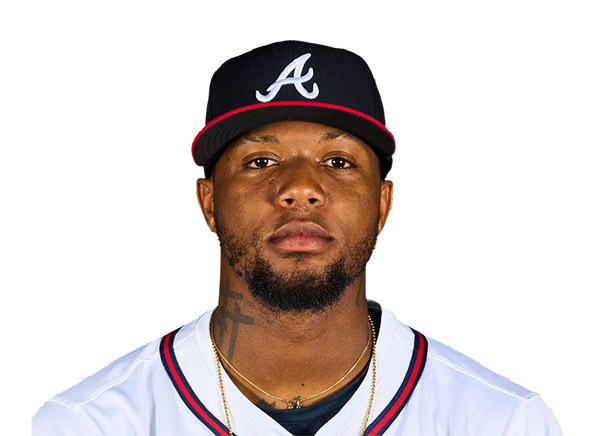
Ronald Acuna Jr.
Michael Harris II

Lane Thomas
Designated Hitters
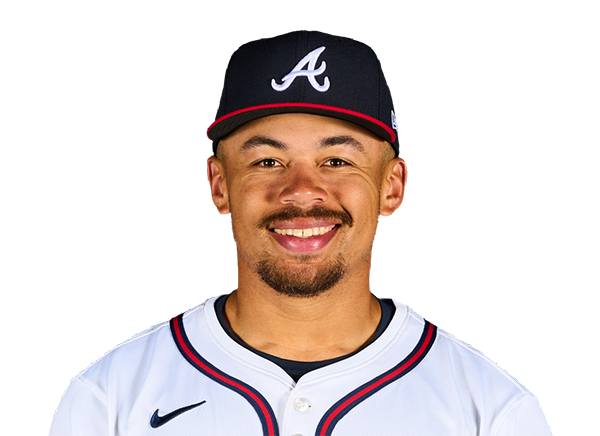
Drake Baldwin
Mets
VS
Braves
Batting
122
Team Games Played
121
4107
At Bats
4101
966
Hits
1021
487
Runs Batted In
567
148
Home Runs
164
63
Stolen Bases
57
.235
Batting Average
.249
510
Runs
591
152
Doubles
193
16
Triples
9
1594
Total Bases
1724
392
Walks
359
1037
Strikeouts
974
.306
On Base Percentage
.314
.388
Slugging Percentage
.420
.694
OBP Pct + SLG Pct
.735
122
Games Played
121
122
Games Started
121
42
Hit By Pitch
48
0.0
Wins Above Replacement
0.0
0.0
Offensive Wins Above Replacement
0.0
25
Caught Stealing
20
1
Is Qualified
1
491.3
Runs Created
551.7
4.0
Runs Created Per 27 Outs
4.7
.085
Walks Per Plate Appearance
.079
0.38
Walk To Strikeout Ratio
0.37
.153
Isolated Power
.171
.258
Secondary Average
.268
3.93
Pitches Per Plate Appearance
3.88
316
Extra Base Hits
366
4591
Plate Appearances
4553
27.8
At Bats Per Home Run
25.0
16
Sacrifice Hit
6
30
Sacrifice Flies
36
Pitching
122
Team Games Played
121
35
Quality Starts
44
53
Wins
73
69
Losses
48
21
Saves
37
49
Holds
89
986
Hits
914
499
Earned runs
431
132
Home Runs
138
434
Walks
417
1095
Strikeouts
1040
9.1
Strikeouts Per 9 Innings
8.7
149.2
Pitches Per Start
144.9
1.31
Walks Plus Hits Per Inning Pitched
1.24
4.14
Earned Run Average
3.60
69
Losses
48
1085.2
Innings pitched
1077.0
.434
Win Percentage
.603
35
Save Opportunities
53
.239
Opponent Batting Average
.228
.318
Opponent's On-base pct.
.305
.395
Opponent's Slugging pct.
.377
.714
Opponent's OPB Pct + SLG Pct
.682
4124
At Bats
4005
212
Doubles
150
18
Triples
16
58
Batters Hit
42
55
Stolen Bases
91
122
Games Played
121
0
Complete Games
0
5
Shutouts
7
31
Wild Pitches
25
531
Runs Batted In
447
3
Balks
3
1085.2
Innings pitched
1077.0
9.1
Strikeouts Per 9 Innings
8.7
26
Caught Stealing
17
122
Games Started
121
0.0
Wins Above Replacement
0.0
1
Is Qualified
1
557
Runs
467
499
Earned Runs
431
1630
Total Bases
1510
Fielding
122
Team Games Played
121
1086
Full Innings
1077
4306
Total Chances
4272
3257
Putouts
3231
970
Assists
985
79
Errors
56
152
Double Plays
193
0.982
Fielding Percentage
0.987
35.0
Range Factor
35.2
0.0
Zone Rating
0.0
122
Games Played
121
0
Games Started
0
0.0
Defensive Wins Above Replacement
0.0
1
Qualified
1