

Mets vs Giants Live Score (5 Apr, 2026)
Game Information
Stage
Standard
Season
2026
First Pitch
Sat, Apr 4, 9:05 pm
Venue
Oracle Park
Location
San Francisco, California
Attendance
36,553
Live Situation
0Balls
0Strikes
0Outs
—Pitcher
—At Bat
Pitch Sequence
1
BALL IN PLAY
Four-seam FB
91 MPH
Injury Report
Team Stats
 NYM
SF


9
Runs
0
12
Hits
3
1
Errors
3
1
Home Runs
0
2
Walks
2
10
Strikeouts
5
Player Box Score
New York Mets
| Player | H-AB | AB | R | H | RBI | HR | BB | K | #P | AVG | OBP | SLG |
|---|---|---|---|---|---|---|---|---|---|---|---|---|
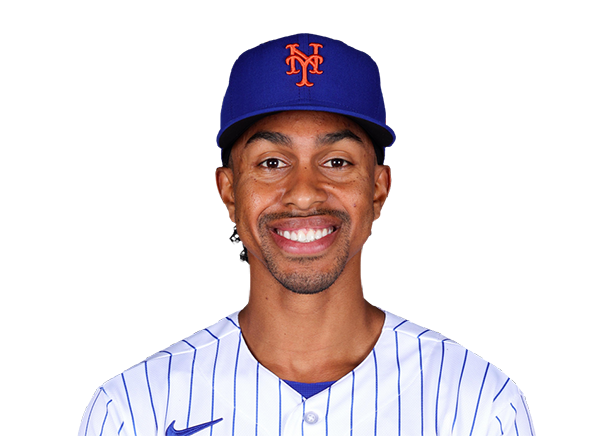 Francisco Lindor | 0-5 | 5 | 0 | 0 | 0 | 0 | 0 | 2 | 29 | .156 | .372 | .281 |
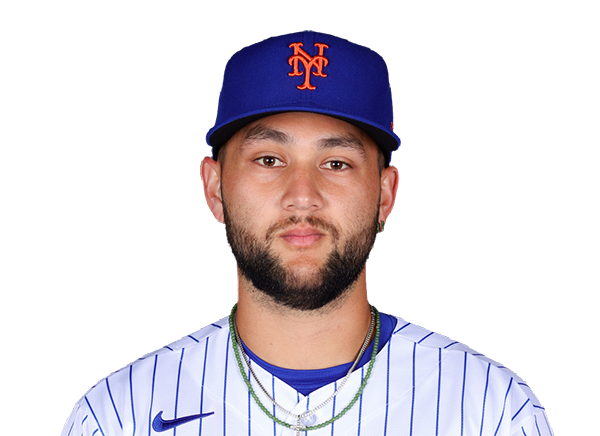 Bo Bichette | 2-5 | 5 | 1 | 2 | 1 | 0 | 0 | 2 | 24 | .220 | .233 | .268 |
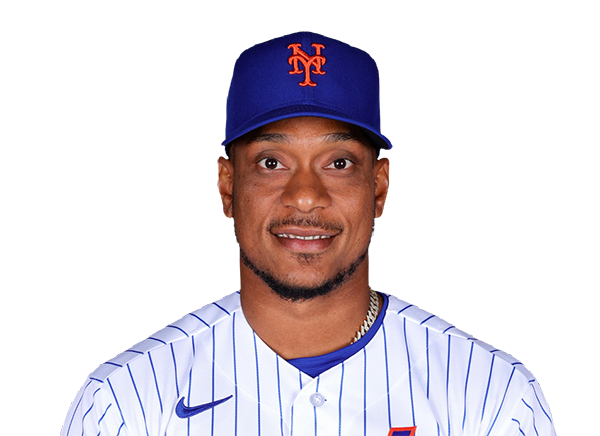 Jorge Polanco | 0-5 | 5 | 0 | 0 | 0 | 0 | 0 | 2 | 16 | .143 | .273 | .214 |
 Brett Baty | 2-5 | 5 | 2 | 2 | 0 | 0 | 0 | 1 | 12 | .242 | .242 | .364 |
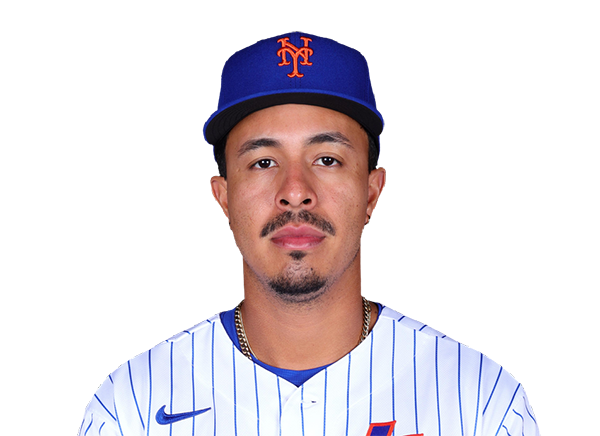 Mark Vientos | 3-5 | 5 | 2 | 3 | 1 | 0 | 0 | 0 | 19 | .471 | .526 | .765 |
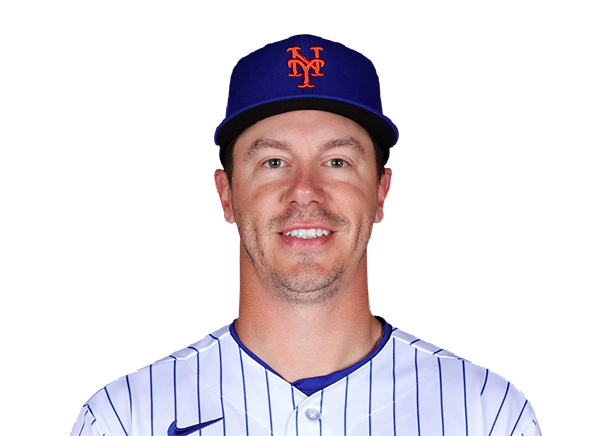 Jared Young | 0-1 | 1 | 1 | 0 | 0 | 0 | 1 | 0 | 8 | .200 | .333 | .300 |
 Tyrone Taylor | 2-3 | 3 | 1 | 2 | 4 | 1 | 0 | 0 | 9 | .167 | .167 | .417 |
 Marcus Semien | 2-3 | 3 | 1 | 2 | 0 | 0 | 1 | 1 | 17 | .258 | .351 | .387 |
 Carson Benge | 0-4 | 4 | 0 | 0 | 1 | 0 | 0 | 2 | 15 | .111 | .200 | .222 |
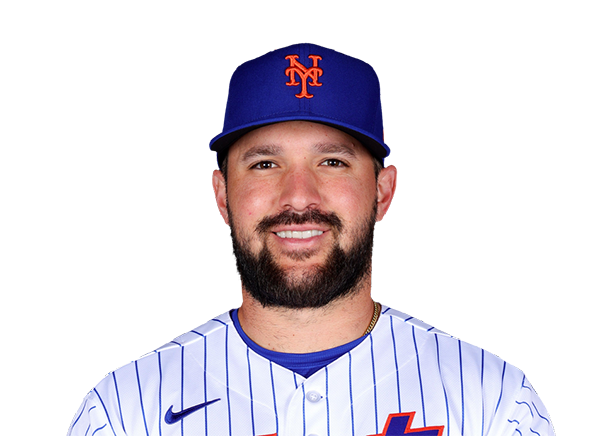 Luis Torrens | 1-4 | 4 | 1 | 1 | 1 | 0 | 0 | 0 | 12 | .300 | .300 | .300 |
San Francisco Giants
| Player | H-AB | AB | R | H | RBI | HR | BB | K | #P | AVG | OBP | SLG |
|---|---|---|---|---|---|---|---|---|---|---|---|---|
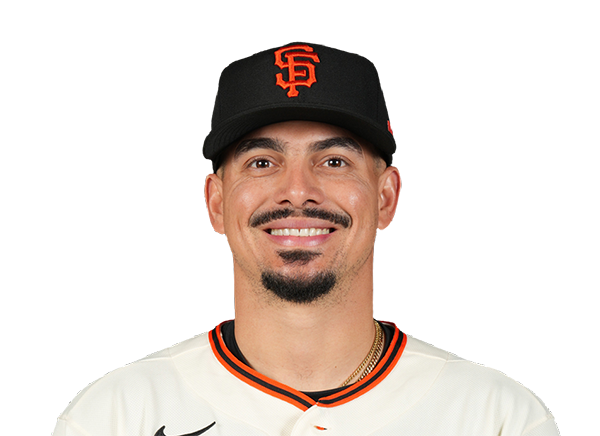 Willy Adames | 0-3 | 3 | 0 | 0 | 0 | 0 | 1 | 0 | 15 | .206 | .270 | .353 |
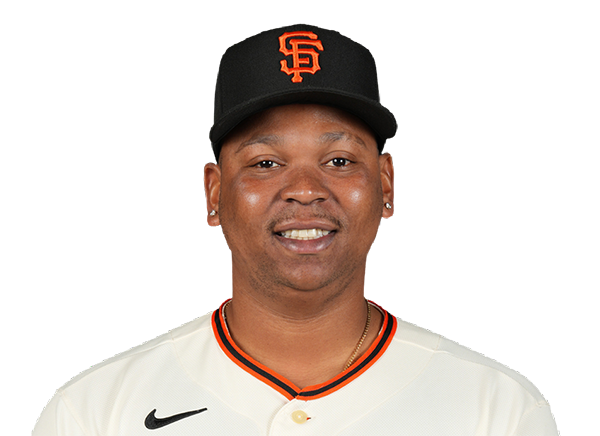 Rafael Devers | 0-4 | 4 | 0 | 0 | 0 | 0 | 0 | 1 | 16 | .200 | .263 | .314 |
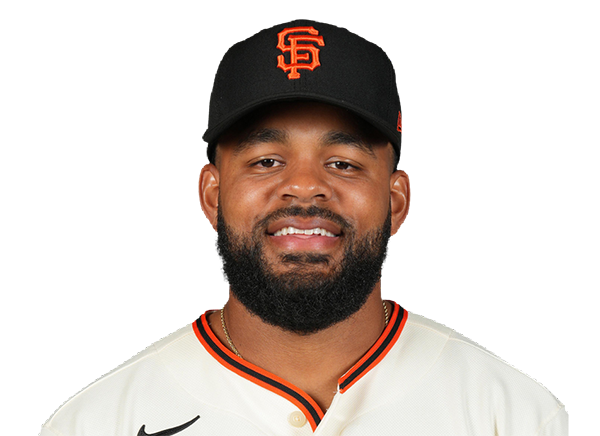 Heliot Ramos | 0-4 | 4 | 0 | 0 | 0 | 0 | 0 | 1 | 15 | .200 | .243 | .229 |
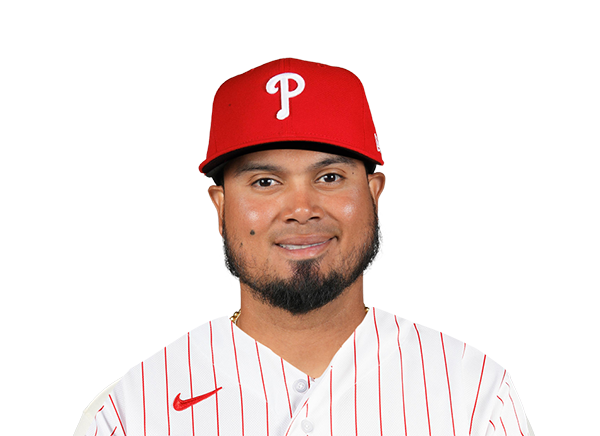 Luis Arraez | 0-4 | 4 | 0 | 0 | 0 | 0 | 0 | 0 | 19 | .278 | .289 | .361 |
 Matt Chapman | 1-4 | 4 | 0 | 1 | 0 | 0 | 0 | 0 | 11 | .200 | .263 | .314 |
 Jung Hoo Lee | 1-2 | 2 | 0 | 1 | 0 | 0 | 1 | 1 | 13 | .172 | .286 | .276 |
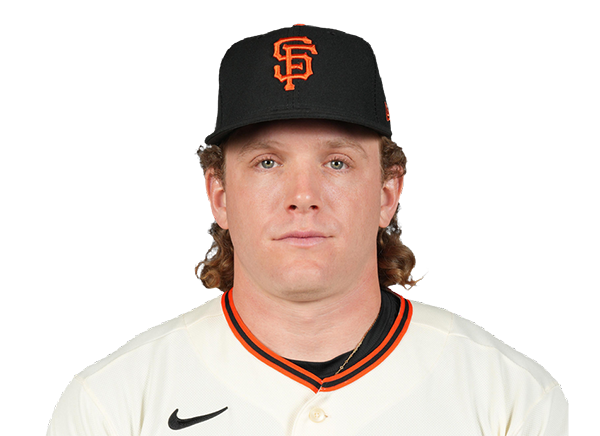 Harrison Bader | 0-3 | 3 | 0 | 0 | 0 | 0 | 0 | 2 | 10 | .129 | .176 | .258 |
 Jared Oliva | 0-0 | 0 | 0 | 0 | 0 | 0 | 0 | 0 | 0 | .000 | .000 | .000 |
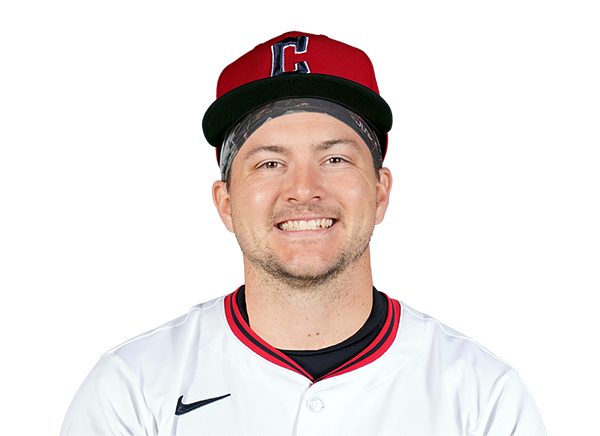 Patrick Bailey | 0-3 | 3 | 0 | 0 | 0 | 0 | 0 | 0 | 7 | .083 | .185 | .083 |
 Daniel Susac | 0-0 | 0 | 0 | 0 | 0 | 0 | 0 | 0 | 0 | 1.000 | 1.000 | 1.000 |
 Jerar Encarnacion | 1-3 | 3 | 0 | 1 | 0 | 0 | 0 | 0 | 14 | .286 | .286 | .429 |
New York Mets
| Player | IP | H | R | ER | BB | K | HR | PC-ST | ERA | PC |
|---|---|---|---|---|---|---|---|---|---|---|
 Clay Holmes | 7.0 | 3 | 0 | 0 | 2 | 4 | 0 | 90-61 | 1.42 | 90 |
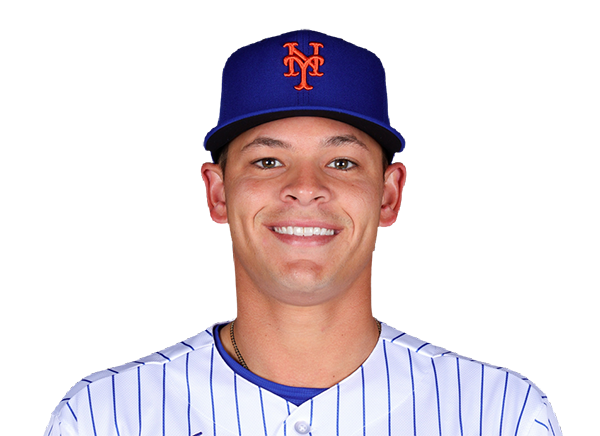 Tobias Myers | 2.0 | 0 | 0 | 0 | 0 | 1 | 0 | 30-21 | 1.13 | 30 |
San Francisco Giants
| Player | IP | H | R | ER | BB | K | HR | PC-ST | ERA | PC |
|---|---|---|---|---|---|---|---|---|---|---|
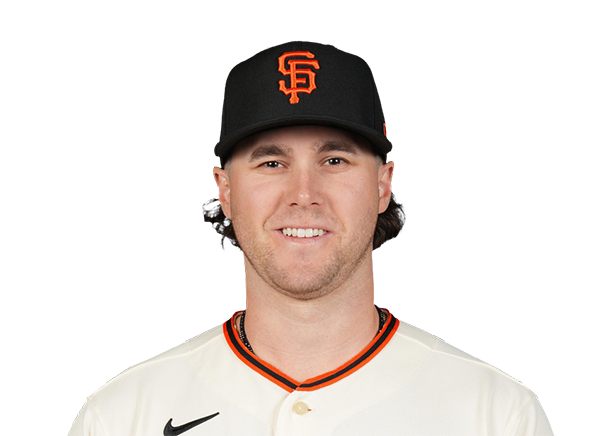 Landen Roupp | 4.2 | 7 | 7 | 5 | 1 | 7 | 0 | 95-63 | 4.22 | 95 |
 Ryan Borucki | 1.1 | 3 | 1 | 1 | 0 | 1 | 1 | 22-18 | 4.91 | 22 |
 Keaton Winn | 1.0 | 2 | 1 | 1 | 1 | 1 | 0 | 23-13 | 2.25 | 23 |
 Caleb Kilian | 1.0 | 0 | 0 | 0 | 0 | 1 | 0 | 12-8 | 0.00 | 12 |
 Christian Koss | 1.0 | 0 | 0 | 0 | 0 | 0 | 0 | 9-5 | 0.00 | 9 |
H2H / Season Series
SF2–5
NYM
SF0–9
NYM
SF3–10
NYM
SF7–2
NYM
Last 5 Games
| Date | Opponent | Result |
|---|---|---|
| Aug 22 |  @ CHW | W10–5 |
| Aug 21 | @ CHW | L4–6 |
| Aug 19 |  vs SD | W4–2 |
| Aug 18 | vs SD | L2–5 |
| Aug 17 | vs SD | W2–1 |
| Date | Opponent | Result |
|---|---|---|
| Aug 22 |  @ BOS | L2–3 |
| Aug 21 | @ BOS | L4–6 |
| Aug 20 |  @ CLE | L2–5 |
| Aug 19 | @ CLE | W1–0 |
| Aug 18 | @ CLE | L1–8 |
Standings
American League
| Team | W | L | PCT | GB | DIFF | STRK |
|---|---|---|---|---|---|---|
1 Rays | 76 | 53 | .589 | - | +42 | L3 |
| 2White Sox | 67 | 62 | .519 | 9 | +42 | L1 |
3 Astros | 65 | 65 | .500 | 11.5 | -43 | L1 |
4 Yankees | 73 | 56 | .566 | 3 | +95 | L1 |
| 5Red Sox | 70 | 59 | .543 | 6 | +98 | W2 |
6 Rangers | 64 | 66 | .492 | 12.5 | -48 | L1 |
| 7Guardians | 64 | 66 | .492 | 12.5 | -14 | W3 |
8 Blue Jays | 64 | 67 | .489 | 13 | -50 | W1 |
9 Twins | 63 | 67 | .485 | 13.5 | -47 | L2 |
10 Orioles | 63 | 67 | .485 | 13.5 | -33 | W2 |
11 Mariners | 62 | 68 | .477 | 14.5 | -44 | W2 |
12 Tigers | 61 | 68 | .473 | 15 | +77 | L4 |
13 Royals | 57 | 74 | .435 | 20 | -95 | W7 |
14 Angels | 52 | 78 | .400 | 24.5 | -68 | W1 |
15 Athletics | 50 | 80 | .385 | 26.5 | -188 | W1 |
National League
| Team | W | L | PCT | GB | DIFF | STRK |
|---|---|---|---|---|---|---|
1 Brewers | 81 | 49 | .623 | - | +163 | W3 |
2 Dodgers | 79 | 51 | .608 | 2 | +147 | W5 |
3 Braves | 75 | 55 | .577 | 6 | +108 | L2 |
4 Cubs | 74 | 56 | .569 | 7 | +98 | L3 |
5 Phillies | 72 | 58 | .554 | 9 | +25 | W8 |
| 6Padres | 70 | 60 | .538 | 11 | +9 | W2 |
7 Diamondbacks | 68 | 62 | .523 | 13 | +7 | L1 |
8 Marlins | 66 | 64 | .508 | 15 | +17 | W2 |
9 Cardinals | 66 | 65 | .504 | 15.5 | 0 | L2 |
10 Pirates | 63 | 68 | .481 | 18.5 | +29 | L2 |
11 Reds | 62 | 68 | .477 | 19 | -92 | W1 |
12 Nationals | 61 | 70 | .466 | 20.5 | +14 | L3 |
| 13Mets | 59 | 71 | .454 | 22 | -39 | W1 |
| 14Giants | 52 | 77 | .403 | 28.5 | -79 | L3 |
15 Rockies | 50 | 79 | .388 | 30.5 | -131 | L5 |
NYM
VS
SF
Pitchers
Clay Holmes
Tobias Myers
Catchers
Luis Torrens
Infielders
Francisco Lindor
Bo Bichette
Mark Vientos
Marcus Semien
Outfielders
Brett Baty
Jared Young
Tyrone Taylor
Carson Benge
Designated Hitters
Jorge Polanco
Pitchers
Landen Roupp
Ryan Borucki
Keaton Winn
Caleb Kilian
Christian Koss
Catchers
Patrick Bailey
Daniel Susac
Infielders
Willy Adames
Luis Arraez
Matt Chapman
Jerar Encarnacion
Outfielders
Heliot Ramos
Jung Hoo Lee
Harrison Bader
Jared Oliva
Designated Hitters
Rafael Devers
Mets
VS
Giants
Batting
130
Team Games Played
129
4370
At Bats
4381
1033
Hits
1082
522
Runs Batted In
499
161
Home Runs
143
68
Stolen Bases
57
.236
Batting Average
.247
545
Runs
519
163
Doubles
214
17
Triples
24
1713
Total Bases
1773
417
Walks
343
1102
Strikeouts
1029
.307
On Base Percentage
.305
.392
Slugging Percentage
.405
.699
OBP Pct + SLG Pct
.710
130
Games Played
129
130
Games Started
129
42
Hit By Pitch
41
0.0
Wins Above Replacement
0.0
0.0
Offensive Wins Above Replacement
0.0
28
Caught Stealing
18
1
Is Qualified
1
529.2
Runs Created
545.3
4.1
Runs Created Per 27 Outs
4.3
.085
Walks Per Plate Appearance
.071
0.38
Walk To Strikeout Ratio
0.33
.156
Isolated Power
.158
.260
Secondary Average
.245
3.93
Pitches Per Plate Appearance
3.86
341
Extra Base Hits
381
4880
Plate Appearances
4823
27.1
At Bats Per Home Run
30.6
16
Sacrifice Hit
22
31
Sacrifice Flies
36
Pitching
130
Team Games Played
129
37
Quality Starts
45
59
Wins
52
71
Losses
77
25
Saves
24
57
Holds
63
1040
Hits
1061
525
Earned runs
549
144
Home Runs
118
465
Walks
486
1173
Strikeouts
971
9.1
Strikeouts Per 9 Innings
7.7
148.8
Pitches Per Start
147.7
1.30
Walks Plus Hits Per Inning Pitched
1.36
4.08
Earned Run Average
4.35
71
Losses
77
1157.1
Innings pitched
1136.1
.454
Win Percentage
.403
39
Save Opportunities
44
.237
Opponent Batting Average
.247
.318
Opponent's On-base pct.
.329
.394
Opponent's Slugging pct.
.387
.712
Opponent's OPB Pct + SLG Pct
.716
4380
At Bats
4289
216
Doubles
188
19
Triples
28
65
Batters Hit
57
56
Stolen Bases
104
130
Games Played
129
0
Complete Games
1
5
Shutouts
9
32
Wild Pitches
47
558
Runs Batted In
562
3
Balks
4
1157.1
Innings pitched
1136.1
9.1
Strikeouts Per 9 Innings
7.7
27
Caught Stealing
34
130
Games Started
129
0.0
Wins Above Replacement
0.0
1
Is Qualified
1
584
Runs
598
525
Earned Runs
549
1726
Total Bases
1659
Fielding
130
Team Games Played
129
1157
Full Innings
1136
4577
Total Chances
4707
3472
Putouts
3409
1023
Assists
1214
82
Errors
84
163
Double Plays
214
0.982
Fielding Percentage
0.982
35.0
Range Factor
36.6
0.0
Zone Rating
0.0
130
Games Played
129
0
Games Started
0
0.0
Defensive Wins Above Replacement
0.0
1
Qualified
1