

Mets vs Nationals Live Score (26 Sep, 2026)
Game Information
Stage
STD
Season
2026
First Pitch
Sat, Sep 26, 12:35 pm
Venue
Nationals Park
Location
Washington, District of Columbia
Venue Type
Outdoor
Broadcast
ESPN Unlmtd
Attendance
27,284
Live Situation
0Balls
1Strikes
0Outs
—Pitcher
—At Bat
Pitch Sequence
1
STRIKE SWINGING
Curve
71 MPH
2
BALL IN PLAY
Cutter
86 MPH
Injury Report




Team Stats
 NYM
WSH


7
Runs
1
9
Hits
3
1
Errors
1
3
Home Runs
0
4
Walks
1
8
Strikeouts
14
Player Box Score
New York Mets
| Player | H-AB | AB | R | H | RBI | HR | BB | K | #P | AVG | OBP | SLG |
|---|---|---|---|---|---|---|---|---|---|---|---|---|
 Francisco Lindor | 0-4 | 4 | 0 | 0 | 0 | 0 | 1 | 2 | 20 | .222 | .306 | .415 |
 Juan Soto | 2-4 | 4 | 0 | 2 | 0 | 0 | 0 | 1 | 25 | .278 | .397 | .522 |
 Nick Morabito | 0-0 | 0 | 0 | 0 | 0 | 0 | 0 | 0 | 0 | .195 | .283 | .244 |
 Bo Bichette | 1-4 | 4 | 0 | 1 | 0 | 0 | 1 | 1 | 20 | .261 | .313 | .392 |
 Carson Benge | 3-5 | 5 | 2 | 3 | 0 | 0 | 0 | 0 | 19 | .280 | .344 | .429 |
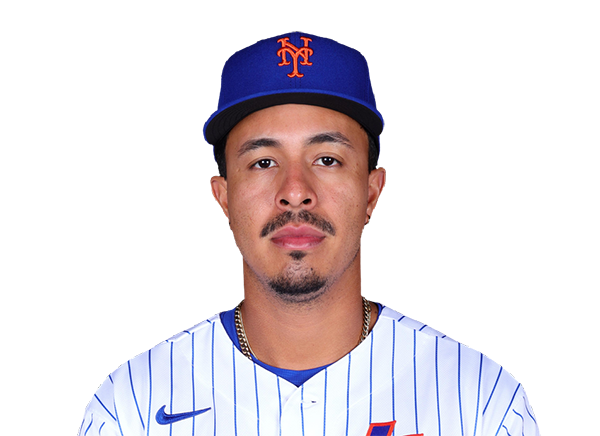 Mark Vientos | 0-5 | 5 | 0 | 0 | 0 | 0 | 0 | 1 | 15 | .212 | .258 | .394 |
 Brett Baty | 0-4 | 4 | 0 | 0 | 0 | 0 | 0 | 1 | 20 | .238 | .312 | .375 |
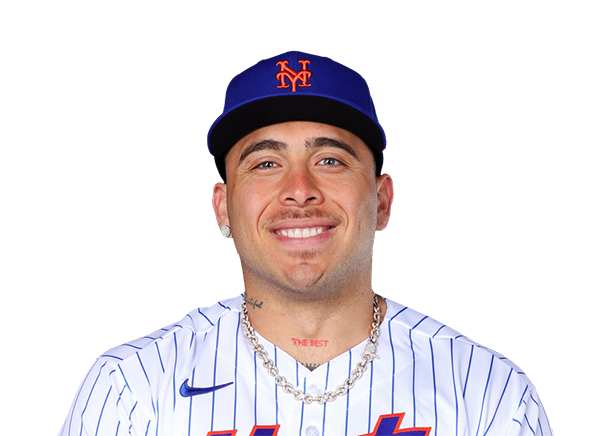 Francisco Alvarez | 0-3 | 3 | 1 | 0 | 0 | 0 | 1 | 1 | 16 | .233 | .311 | .399 |
 A.J. Ewing | 1-3 | 3 | 2 | 1 | 3 | 1 | 1 | 1 | 18 | .254 | .324 | .379 |
 Ronny Mauricio | 2-4 | 4 | 2 | 2 | 3 | 2 | 0 | 0 | 11 | .196 | .224 | .375 |
Washington Nationals
| Player | H-AB | AB | R | H | RBI | HR | BB | K | #P | AVG | OBP | SLG |
|---|---|---|---|---|---|---|---|---|---|---|---|---|
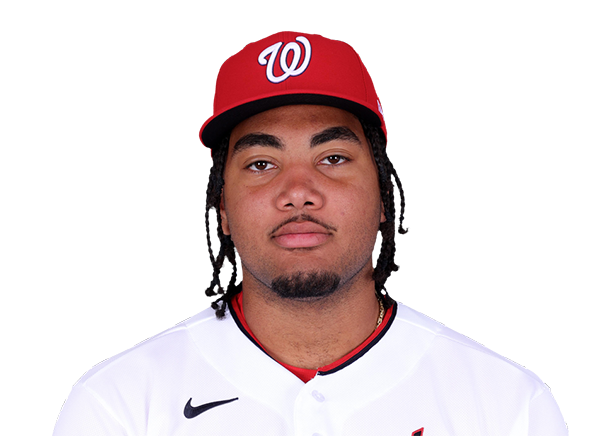 James Wood | 2-4 | 4 | 0 | 2 | 0 | 0 | 0 | 1 | 15 | .267 | .389 | .506 |
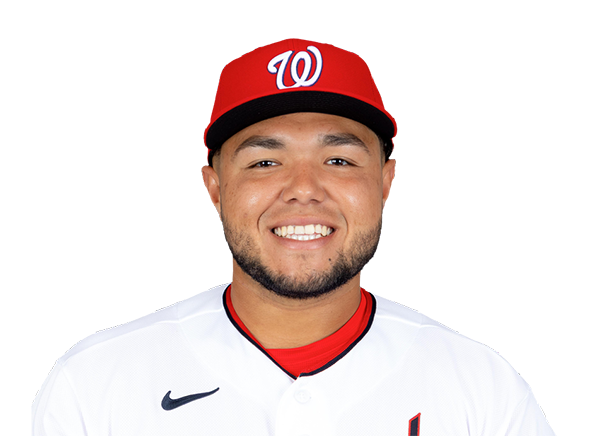 Abimelec Ortiz | 0-3 | 3 | 0 | 0 | 1 | 0 | 0 | 1 | 20 | .188 | .228 | .344 |
 Dylan Crews | 0-3 | 3 | 0 | 0 | 0 | 0 | 1 | 3 | 23 | .223 | .289 | .373 |
 CJ Abrams | 0-4 | 4 | 0 | 0 | 0 | 0 | 0 | 3 | 14 | .261 | .337 | .496 |
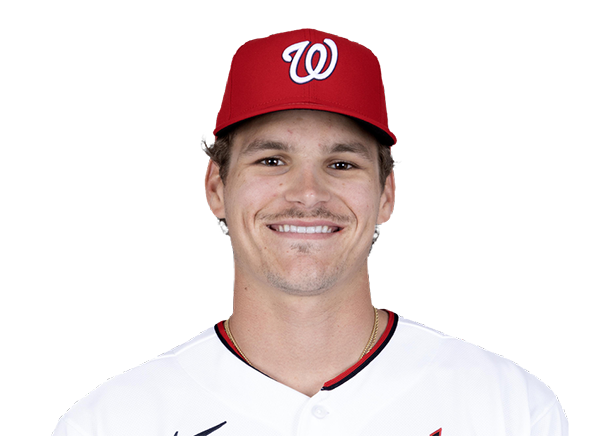 Brady House | 1-3 | 3 | 0 | 1 | 0 | 0 | 0 | 1 | 10 | .246 | .311 | .397 |
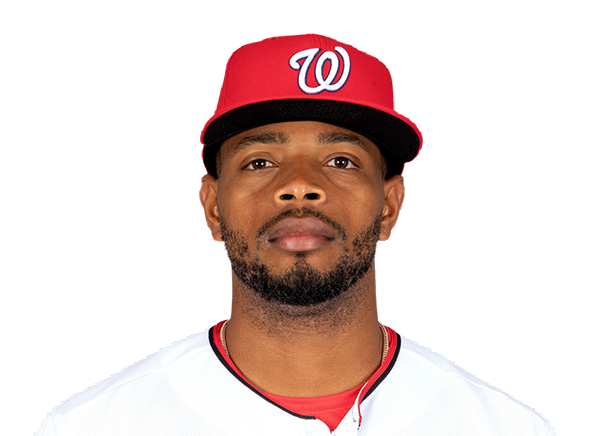 Jose Tena | 0-1 | 1 | 0 | 0 | 0 | 0 | 0 | 1 | 4 | .222 | .302 | .370 |
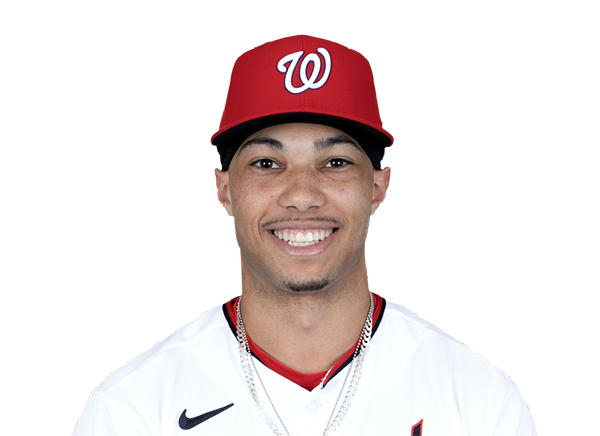 Daylen Lile | 0-4 | 4 | 0 | 0 | 0 | 0 | 0 | 0 | 10 | .247 | .298 | .431 |
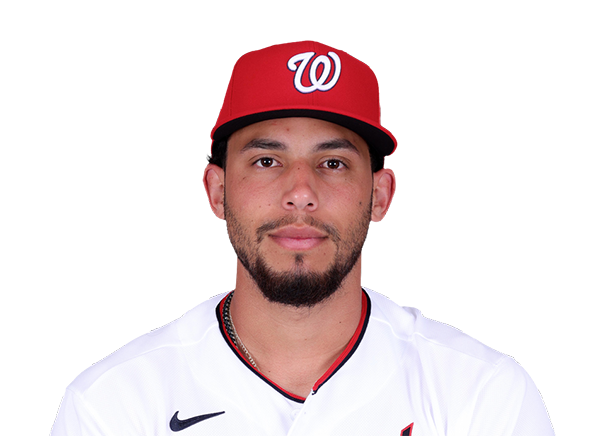 Yohandy Morales | 0-3 | 3 | 0 | 0 | 0 | 0 | 0 | 2 | 17 | .255 | .255 | .596 |
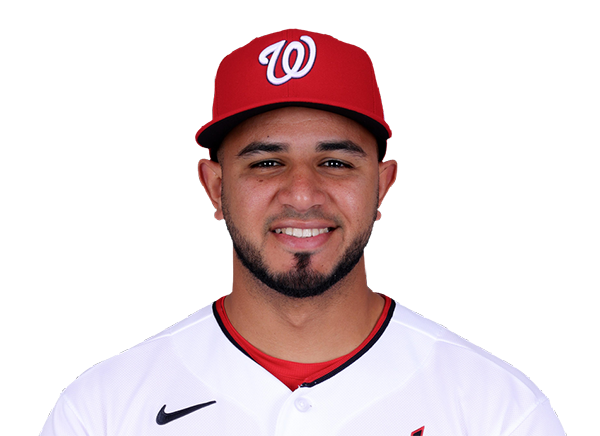 Keibert Ruiz | 0-3 | 3 | 0 | 0 | 0 | 0 | 0 | 1 | 12 | .280 | .316 | .443 |
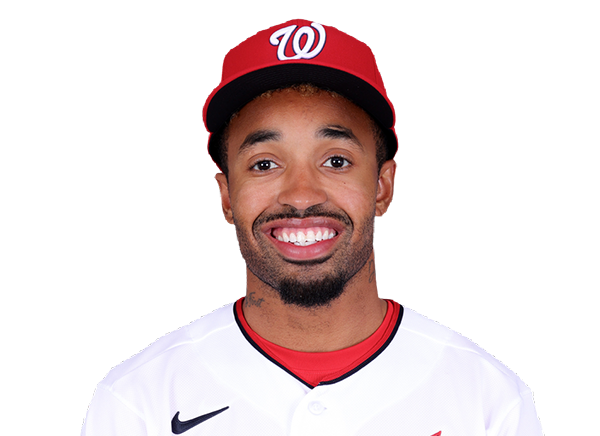 Nasim Nunez | 0-1 | 1 | 1 | 0 | 0 | 0 | 0 | 1 | 11 | .208 | .292 | .241 |
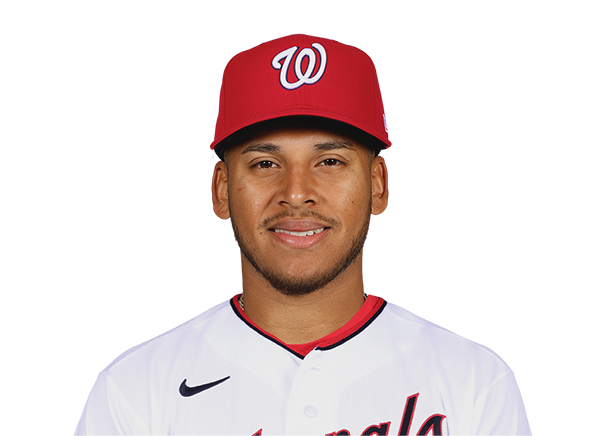 Jorbit Vivas | 0-1 | 1 | 0 | 0 | 0 | 0 | 0 | 0 | 8 | .238 | .331 | .322 |
New York Mets
| Player | IP | H | R | ER | BB | K | HR | PC-ST | ERA | PC |
|---|---|---|---|---|---|---|---|---|---|---|
 Jonah Tong | 5.0 | 3 | 1 | 1 | 1 | 9 | 0 | 87-52 | 3.82 | 87 |
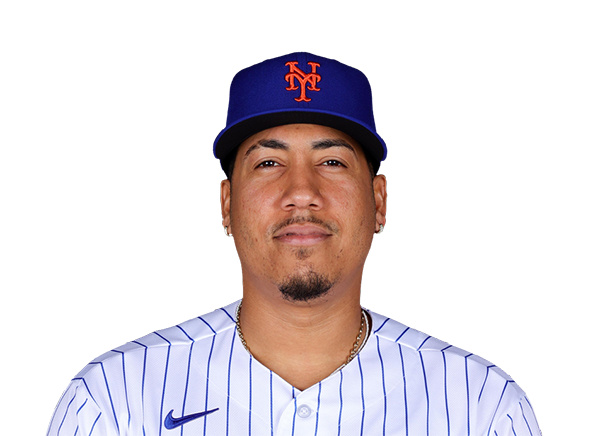 Dedniel Nunez | 1.0 | 0 | 0 | 0 | 0 | 3 | 0 | 12-10 | 3.32 | 12 |
 Nate Lavender | 1.0 | 0 | 0 | 0 | 0 | 0 | 0 | 13-8 | 1.66 | 13 |
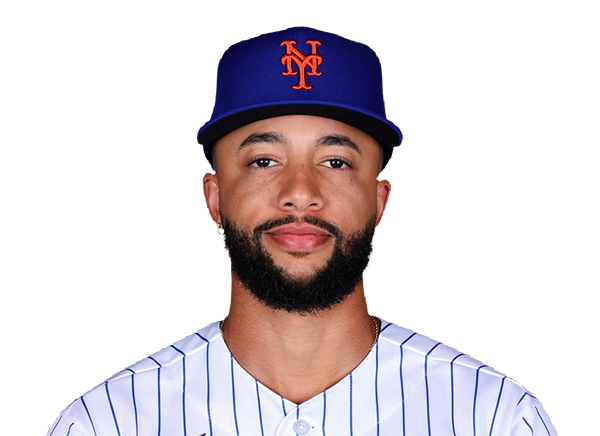 Devin Williams | 1.0 | 0 | 0 | 0 | 0 | 0 | 0 | 18-11 | 4.43 | 18 |
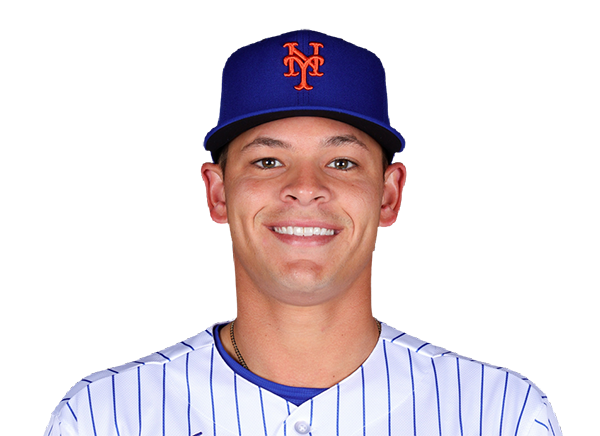 Tobias Myers | 1.0 | 0 | 0 | 0 | 0 | 2 | 0 | 14-11 | 5.53 | 14 |
Washington Nationals
| Player | IP | H | R | ER | BB | K | HR | PC-ST | ERA | PC |
|---|---|---|---|---|---|---|---|---|---|---|
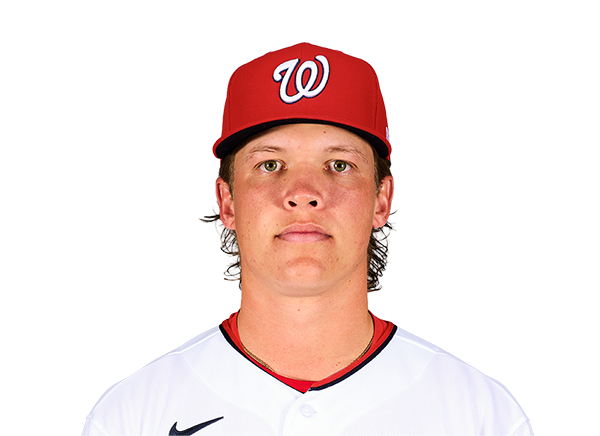 Connelly Early | 3.0 | 1 | 0 | 0 | 0 | 1 | 0 | 34-21 | 3.33 | 34 |
 Jake Irvin | 5.0 | 7 | 5 | 4 | 2 | 6 | 2 | 101-68 | 5.48 | 101 |
 Richard Lovelady | 1.0 | 1 | 2 | 2 | 2 | 1 | 1 | 29-13 | 4.11 | 29 |
H2H / Season Series
WSH1–7
NYM
WSH7–6
NYM
NYM4–3
WSH
NYM5–4
WSH
NYM4–1
WSH
WSH1–2
NYM
WSH8–4
NYM
WSH9–6
NYM
WSH7–16
NYM
NYM4–5
WSH
Last 5 Games
| Date | Opponent | Result |
|---|---|---|
| Sep 26 | @ WSH | W7–1 |
| Sep 25 | @ WSH | L6–7 |
| Sep 24 |  @ TEX | L1–3 |
| Sep 23 | @ TEX | W7–2 |
| Sep 22 | @ TEX | W6–3 |
| Date | Opponent | Result |
|---|---|---|
| Sep 26 | vs NYM | L1–7 |
| Sep 25 | vs NYM | W7–6 |
| Sep 23 |  @ DET | W4–2 |
| Sep 22 | @ DET | W3–1 |
| Sep 21 | @ DET | L2–9 |
Standings
American League
| Team | W | L | PCT | GB | DIFF | STRK |
|---|---|---|---|---|---|---|
1 Rays | 98 | 63 | .609 | - | +90 | W2 |
2 Guardians | 85 | 76 | .528 | 13 | +12 | W3 |
| 3Rangers | 80 | 81 | .497 | 18 | -44 | W1 |
4 Yankees | 93 | 68 | .578 | 5 | +138 | W1 |
5 Red Sox | 87 | 74 | .540 | 11 | +82 | W2 |
6 White Sox | 83 | 78 | .516 | 15 | +54 | L1 |
7 Astros | 79 | 81 | .494 | 18.5 | -52 | L1 |
8 Orioles | 79 | 82 | .491 | 19 | -21 | L1 |
9 Blue Jays | 78 | 83 | .484 | 20 | -50 | L1 |
10 Twins | 76 | 85 | .472 | 22 | -60 | L1 |
| 11Tigers | 76 | 85 | .472 | 22 | +73 | W2 |
12 Mariners | 74 | 86 | .463 | 23.5 | -66 | L2 |
13 Royals | 68 | 93 | .422 | 30 | -121 | L3 |
14 Athletics | 64 | 96 | .400 | 33.5 | -218 | W1 |
15 Angels | 62 | 98 | .388 | 35.5 | -89 | W2 |
National League
| Team | W | L | PCT | GB | DIFF | STRK |
|---|---|---|---|---|---|---|
1 Brewers | 102 | 59 | .634 | - | +212 | W4 |
2 Dodgers | 99 | 62 | .615 | 3 | +197 | W2 |
3 Braves | 94 | 67 | .584 | 8 | +118 | W1 |
4 Padres | 90 | 71 | .559 | 12 | +36 | W1 |
5 Cubs | 88 | 73 | .547 | 14 | +143 | L2 |
6 Phillies | 87 | 74 | .540 | 15 | +11 | L4 |
7 Diamondbacks | 86 | 75 | .534 | 16 | +14 | L1 |
8 Pirates | 81 | 80 | .503 | 21 | +26 | L2 |
9 Marlins | 79 | 82 | .491 | 23 | +1 | L1 |
10 Cardinals | 77 | 84 | .478 | 25 | -27 | L3 |
| 11Nationals | 76 | 85 | .472 | 26 | +4 | L1 |
12 Reds | 75 | 86 | .466 | 27 | -156 | W1 |
| 13Mets | 74 | 87 | .460 | 28 | -30 | W1 |
14 Giants | 65 | 96 | .404 | 37 | -87 | L4 |
15 Rockies | 58 | 103 | .360 | 44 | -190 | W1 |
NYM
VS
WSH
Pitchers
Jonah Tong
Catchers
Francisco Alvarez
Infielders
Bo Bichette
Mark Vientos
Brett Baty
Ronny Mauricio
Outfielders
Juan Soto
Carson Benge
A.J. Ewing
Designated Hitters
Francisco Lindor
Pitchers
Connelly Early
Catchers
Keibert Ruiz
Infielders
CJ Abrams
Brady House
Yohandy Morales
Nasim Nunez
Outfielders
James Wood
Dylan Crews
Daylen Lile
Designated Hitters
Abimelec Ortiz
Mets
VS
Nationals
Batting
161
Team Games Played
161
5437
At Bats
5476
1298
Hits
1347
664
Runs Batted In
771
202
Home Runs
208
83
Stolen Bases
178
.239
Batting Average
.246
695
Runs
815
208
Doubles
278
18
Triples
30
2148
Total Bases
2309
524
Walks
552
1352
Strikeouts
1345
.309
On Base Percentage
.321
.395
Slugging Percentage
.422
.705
OBP Pct + SLG Pct
.742
161
Games Played
161
161
Games Started
161
50
Hit By Pitch
69
0.0
Wins Above Replacement
0.0
0.0
Offensive Wins Above Replacement
0.0
34
Caught Stealing
40
1
Is Qualified
1
670.6
Runs Created
769.6
4.2
Runs Created Per 27 Outs
4.8
.086
Walks Per Plate Appearance
.090
0.39
Walk To Strikeout Ratio
0.41
.156
Isolated Power
.176
.262
Secondary Average
.302
3.93
Pitches Per Plate Appearance
3.83
428
Extra Base Hits
516
6071
Plate Appearances
6159
26.9
At Bats Per Home Run
26.3
18
Sacrifice Hit
19
38
Sacrifice Flies
39
Pitching
161
Team Games Played
161
48
Quality Starts
36
74
Wins
76
87
Losses
85
31
Saves
41
77
Holds
82
1298
Hits
1384
659
Earned runs
741
182
Home Runs
216
549
Walks
601
1445
Strikeouts
1274
9.1
Strikeouts Per 9 Innings
8.0
147.9
Pitches Per Start
151.1
1.29
Walks Plus Hits Per Inning Pitched
1.39
4.14
Earned Run Average
4.67
87
Losses
85
1433.2
Innings pitched
1428.0
.460
Win Percentage
.472
50
Save Opportunities
83
.239
Opponent Batting Average
.253
.316
Opponent's On-base pct.
.333
.396
Opponent's Slugging pct.
.423
.712
Opponent's OPB Pct + SLG Pct
.757
5426
At Bats
5466
255
Doubles
258
24
Triples
12
79
Batters Hit
82
69
Stolen Bases
115
161
Games Played
161
0
Complete Games
0
5
Shutouts
5
43
Wild Pitches
65
695
Runs Batted In
776
3
Balks
1
1433.2
Innings pitched
1428.0
9.1
Strikeouts Per 9 Innings
8.0
33
Caught Stealing
33
161
Games Started
161
0.0
Wins Above Replacement
0.0
1
Is Qualified
1
725
Runs
811
659
Earned Runs
741
2147
Total Bases
2314
Fielding
161
Team Games Played
161
1434
Full Innings
1428
5633
Total Chances
5836
4301
Putouts
4284
1238
Assists
1447
94
Errors
105
208
Double Plays
278
0.983
Fielding Percentage
0.982
34.8
Range Factor
36.1
0.0
Zone Rating
0.0
161
Games Played
161
0
Games Started
0
0.0
Defensive Wins Above Replacement
0.0
1
Qualified
1