

Mets vs Nationals Live Score (27 Sep, 2026)
Game Information
Stage
STD
Season
2026
First Pitch
Sun, Sep 27, 1:05 pm
Venue
Nationals Park
Location
Washington, District of Columbia
Venue Type
Outdoor
Broadcast
MLB.TV
Attendance
23,753
Live Situation
1Balls
3Strikes
0Outs
—Pitcher
—At Bat
Pitch Sequence
1
BALL
Slider
87 MPH
2
STRIKE SWINGING
Slider
85 MPH
3
STRIKE SWINGING
Slider
84 MPH
4
STRIKE SWINGING
Slider
85 MPH
Injury Report


Team Stats
 NYM
WSH


4
Runs
6
9
Hits
9
0
Errors
1
2
Home Runs
2
4
Walks
3
9
Strikeouts
5
Player Box Score
New York Mets
| Player | H-AB | AB | R | H | RBI | HR | BB | K | #P | AVG | OBP | SLG |
|---|---|---|---|---|---|---|---|---|---|---|---|---|
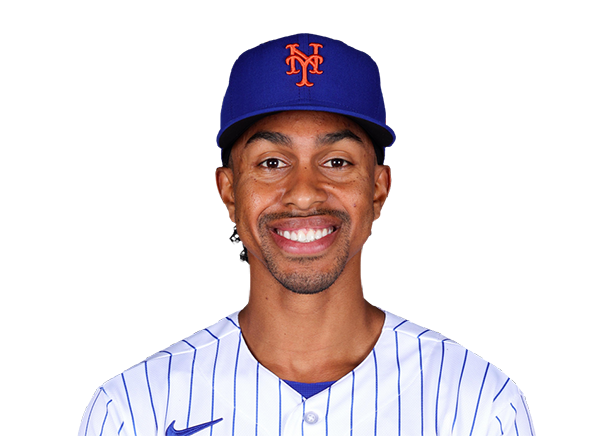 Francisco Lindor | 2-4 | 4 | 2 | 2 | 1 | 1 | 1 | 0 | 18 | .225 | .309 | .423 |
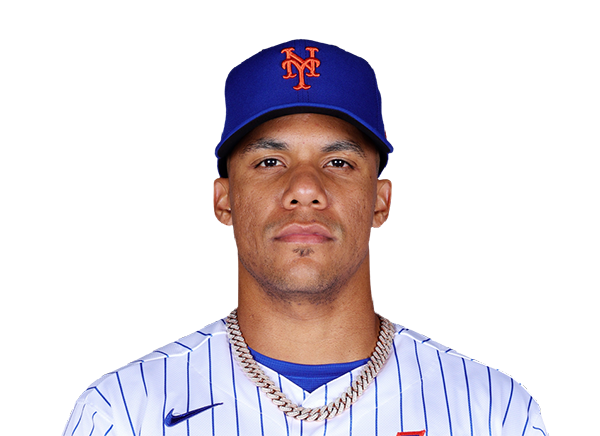 Juan Soto | 0-5 | 5 | 0 | 0 | 0 | 0 | 0 | 0 | 19 | .275 | .393 | .515 |
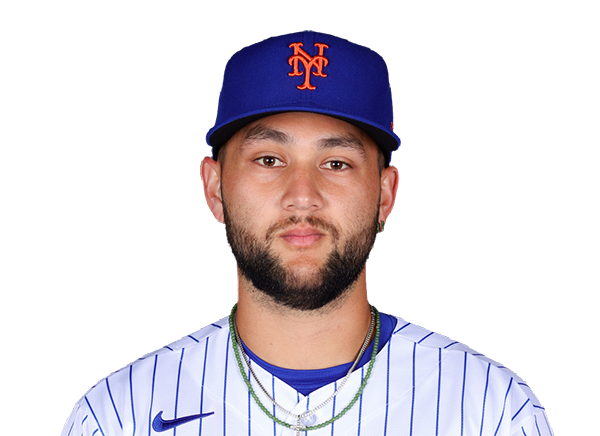 Bo Bichette | 1-5 | 5 | 0 | 1 | 0 | 0 | 0 | 1 | 18 | .260 | .312 | .390 |
 Carson Benge | 3-5 | 5 | 0 | 3 | 1 | 0 | 0 | 2 | 20 | .282 | .346 | .430 |
 Marcus Semien | 1-4 | 4 | 0 | 1 | 0 | 0 | 0 | 1 | 17 | .215 | .280 | .340 |
 Brett Baty | 0-4 | 4 | 0 | 0 | 0 | 0 | 0 | 2 | 16 | .236 | .309 | .371 |
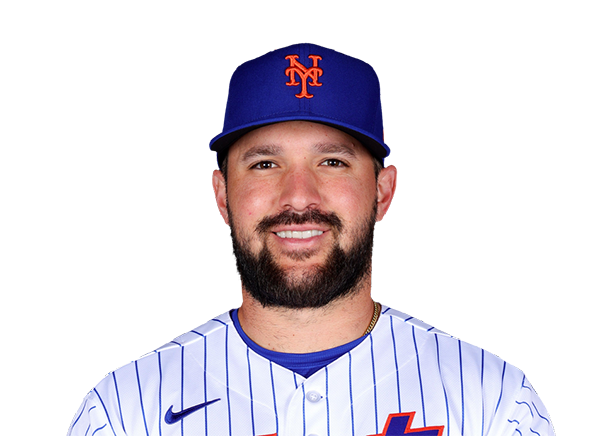 Luis Torrens | 0-3 | 3 | 1 | 0 | 0 | 0 | 1 | 1 | 26 | .235 | .295 | .396 |
 A.J. Ewing | 0-3 | 3 | 0 | 0 | 0 | 0 | 1 | 1 | 19 | .252 | .324 | .376 |
 Ronny Mauricio | 2-3 | 3 | 1 | 2 | 2 | 1 | 1 | 1 | 18 | .220 | .258 | .441 |
Washington Nationals
| Player | H-AB | AB | R | H | RBI | HR | BB | K | #P | AVG | OBP | SLG |
|---|---|---|---|---|---|---|---|---|---|---|---|---|
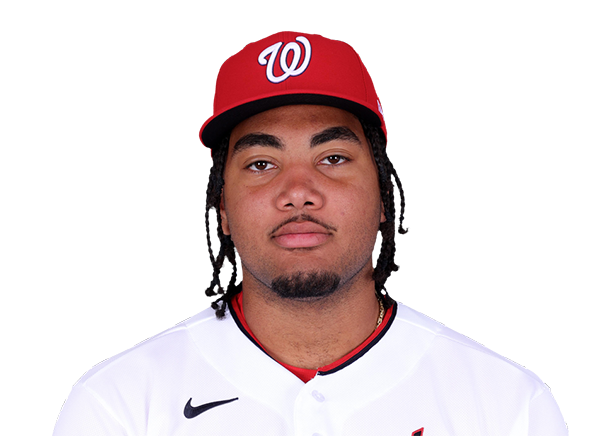 James Wood | 0-3 | 3 | 1 | 0 | 0 | 0 | 1 | 2 | 18 | .265 | .388 | .503 |
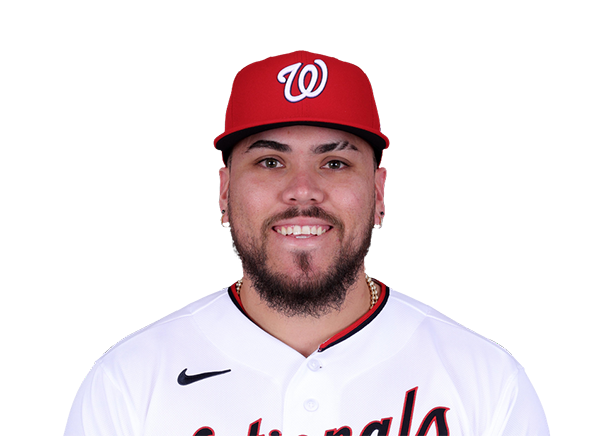 Andres Chaparro | 3-4 | 4 | 2 | 3 | 2 | 2 | 0 | 0 | 17 | .268 | .364 | .530 |
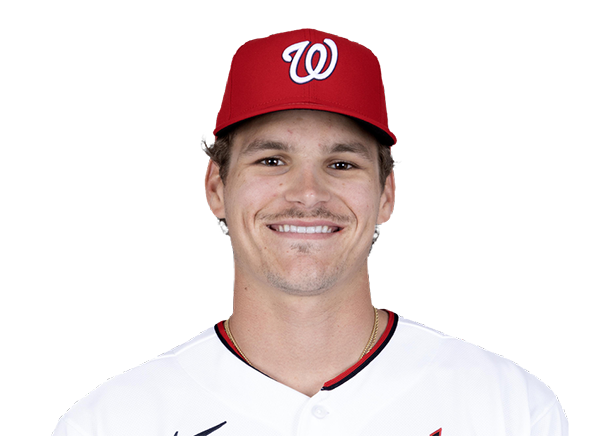 Brady House | 1-3 | 3 | 1 | 1 | 1 | 0 | 1 | 0 | 21 | .247 | .313 | .397 |
 CJ Abrams | 1-4 | 4 | 0 | 1 | 1 | 0 | 0 | 0 | 15 | .261 | .336 | .497 |
 Dylan Crews | 1-4 | 4 | 1 | 1 | 0 | 0 | 0 | 1 | 8 | .223 | .289 | .374 |
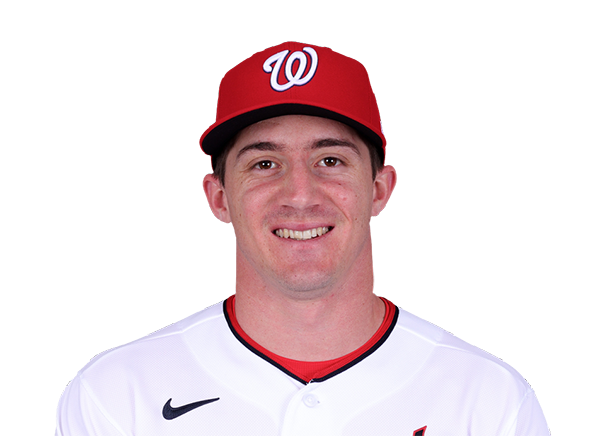 Jacob Young | 1-4 | 4 | 0 | 1 | 1 | 0 | 0 | 1 | 12 | .252 | .318 | .390 |
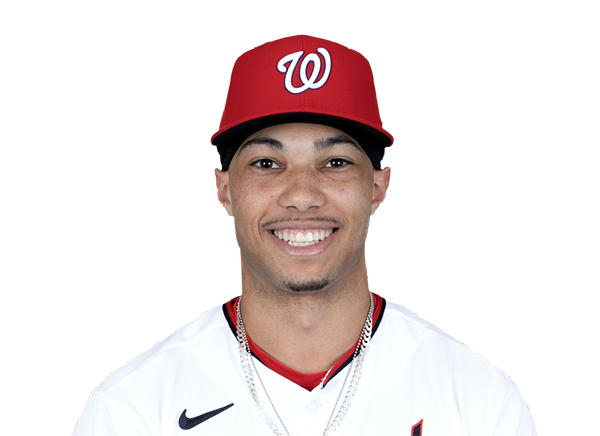 Daylen Lile | 0-4 | 4 | 0 | 0 | 0 | 0 | 0 | 1 | 24 | .246 | .296 | .429 |
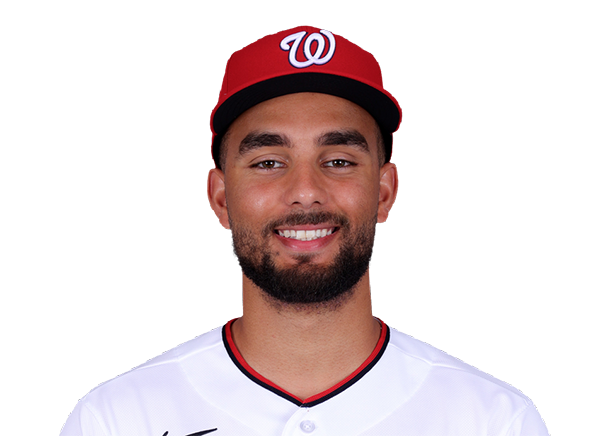 Harry Ford | 1-3 | 3 | 1 | 1 | 0 | 0 | 1 | 0 | 12 | .190 | .314 | .350 |
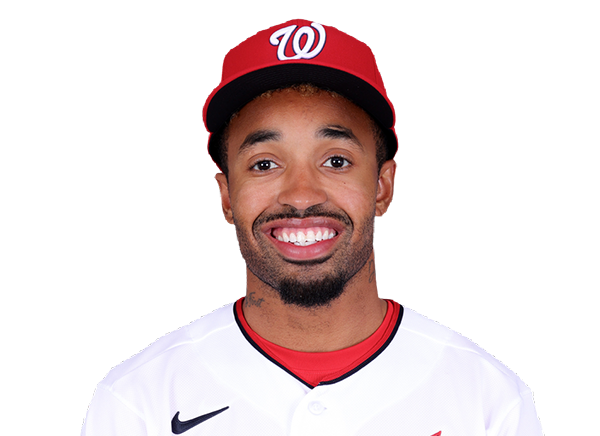 Nasim Nunez | 1-4 | 4 | 0 | 1 | 1 | 0 | 0 | 0 | 18 | .209 | .291 | .244 |
New York Mets
| Player | IP | H | R | ER | BB | K | HR | PC-ST | ERA | PC |
|---|---|---|---|---|---|---|---|---|---|---|
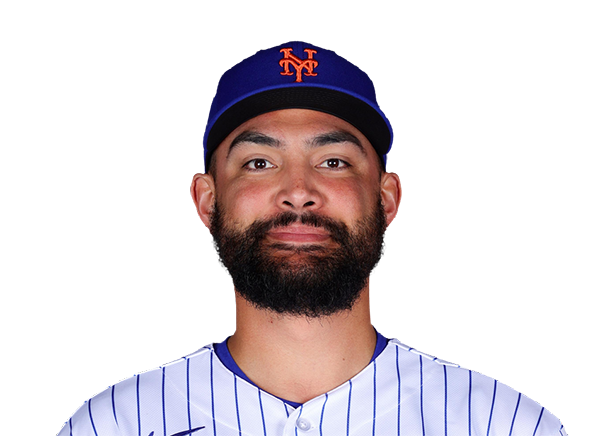 Sean Manaea | 6.0 | 7 | 5 | 5 | 1 | 3 | 2 | 100-63 | 4.78 | 100 |
 Austin Warren | 1.0 | 2 | 1 | 1 | 1 | 0 | 0 | 24-12 | 4.11 | 24 |
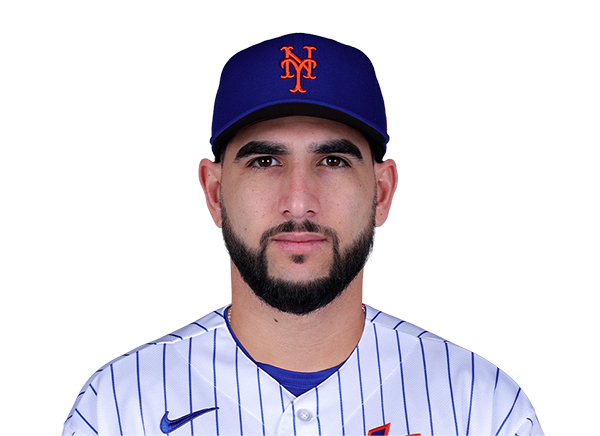 Cionel Perez | 1.0 | 0 | 0 | 0 | 1 | 2 | 0 | 21-12 | 4.76 | 21 |
Washington Nationals
| Player | IP | H | R | ER | BB | K | HR | PC-ST | ERA | PC |
|---|---|---|---|---|---|---|---|---|---|---|
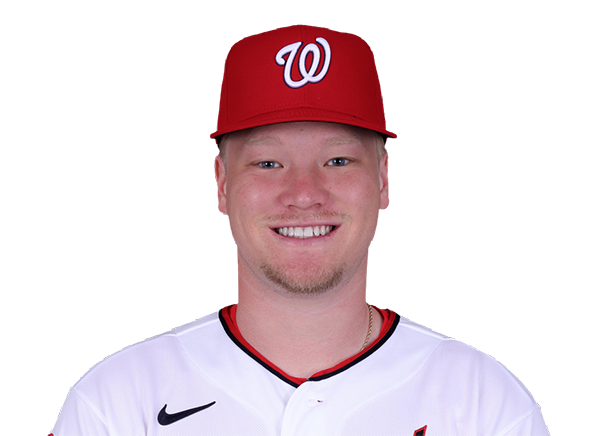 DJ Herz | 3.0 | 6 | 4 | 4 | 1 | 2 | 2 | 65-45 | 10.29 | 65 |
 Will Dion | 2.0 | 1 | 0 | 0 | 1 | 2 | 0 | 37-24 | 3.62 | 37 |
 Riley Cornelio | 2.0 | 1 | 0 | 0 | 1 | 2 | 0 | 31-17 | 3.68 | 31 |
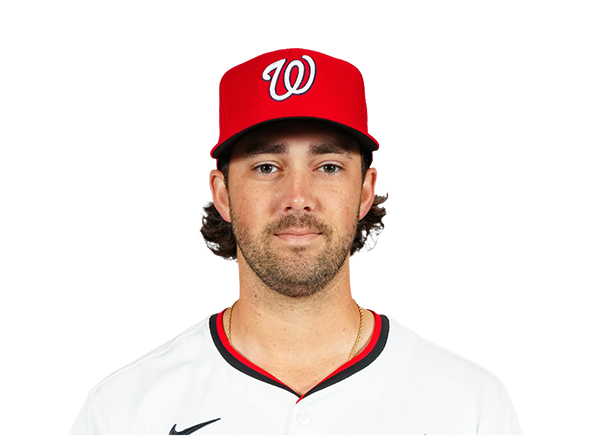 Jack Sinclair | 0.2 | 0 | 0 | 0 | 0 | 1 | 0 | 16-10 | 2.45 | 16 |
|
Erik Tolman | 1.1 | 1 | 0 | 0 | 1 | 2 | 0 | 22-15 | 2.93 | 22 |
H2H / Season Series
WSH6–4
NYM
WSH1–7
NYM
WSH7–6
NYM
NYM4–3
WSH
NYM5–4
WSH
NYM4–1
WSH
WSH1–2
NYM
WSH8–4
NYM
WSH9–6
NYM
WSH7–16
NYM
Last 5 Games
| Date | Opponent | Result |
|---|---|---|
| Sep 27 | @ WSH | L4–6 |
| Sep 26 | @ WSH | W7–1 |
| Sep 25 | @ WSH | L6–7 |
| Sep 24 |  @ TEX | L1–3 |
| Sep 23 | @ TEX | W7–2 |
| Date | Opponent | Result |
|---|---|---|
| Sep 27 | vs NYM | W6–4 |
| Sep 26 | vs NYM | L1–7 |
| Sep 25 | vs NYM | W7–6 |
| Sep 23 |  @ DET | W4–2 |
| Sep 22 | @ DET | W3–1 |
Standings
American League
| Team | W | L | PCT | GB | DIFF | STRK |
|---|---|---|---|---|---|---|
1 Rays | 98 | 64 | .605 | - | +86 | L1 |
2 Guardians | 85 | 77 | .525 | 13 | +11 | L1 |
3 Astros | 81 | 81 | .500 | 17 | -32 | W2 |
4 Yankees | 93 | 68 | .578 | 4.5 | +138 | W1 |
5 Red Sox | 87 | 75 | .537 | 11 | +78 | L1 |
6 White Sox | 84 | 78 | .519 | 14 | +56 | W1 |
| 7Rangers | 80 | 82 | .494 | 18 | -46 | L1 |
8 Orioles | 79 | 82 | .491 | 18.5 | -21 | L1 |
9 Blue Jays | 79 | 83 | .488 | 19 | -46 | W1 |
10 Twins | 77 | 85 | .475 | 21 | -58 | W1 |
| 11Tigers | 76 | 86 | .469 | 22 | +71 | L1 |
12 Mariners | 76 | 86 | .469 | 22 | -58 | W2 |
13 Royals | 69 | 93 | .426 | 29 | -120 | W1 |
14 Athletics | 64 | 98 | .395 | 34 | -238 | L2 |
15 Angels | 62 | 100 | .383 | 36 | -97 | L2 |
National League
| Team | W | L | PCT | GB | DIFF | STRK |
|---|---|---|---|---|---|---|
1 Brewers | 103 | 59 | .636 | - | +214 | W5 |
2 Dodgers | 100 | 62 | .617 | 3 | +201 | W3 |
3 Braves | 94 | 68 | .580 | 9 | +116 | L1 |
4 Padres | 91 | 71 | .562 | 12 | +41 | W2 |
5 Cubs | 89 | 73 | .549 | 14 | +147 | W1 |
6 Phillies | 88 | 74 | .543 | 15 | +15 | W1 |
7 Diamondbacks | 86 | 76 | .531 | 17 | +9 | L2 |
8 Pirates | 82 | 80 | .506 | 21 | +28 | W1 |
9 Marlins | 80 | 82 | .494 | 23 | +3 | W1 |
10 Cardinals | 77 | 85 | .475 | 26 | -29 | L4 |
| 11Nationals | 77 | 85 | .475 | 26 | +6 | W1 |
12 Reds | 75 | 87 | .463 | 28 | -160 | L1 |
| 13Mets | 74 | 88 | .457 | 29 | -32 | L1 |
14 Giants | 65 | 97 | .401 | 38 | -91 | L5 |
15 Rockies | 58 | 104 | .358 | 45 | -192 | L1 |
NYM
VS
WSH
Pitchers
Sean Manaea
Catchers
Luis Torrens
Infielders
Francisco Lindor
Bo Bichette
Marcus Semien
Brett Baty
Outfielders
Juan Soto
Carson Benge
A.J. Ewing
Designated Hitters
Ronny Mauricio
Pitchers
DJ Herz
Catchers
Harry Ford
Infielders
Andres Chaparro
Brady House
CJ Abrams
Nasim Nunez
Outfielders
Dylan Crews
Jacob Young
Daylen Lile
Designated Hitters
James Wood
Mets
VS
Nationals
Batting
162
Team Games Played
162
5473
At Bats
5509
1307
Hits
1356
668
Runs Batted In
777
204
Home Runs
210
83
Stolen Bases
178
.239
Batting Average
.246
699
Runs
821
209
Doubles
281
18
Triples
31
2164
Total Bases
2329
528
Walks
555
1361
Strikeouts
1350
.310
On Base Percentage
.321
.395
Slugging Percentage
.423
.705
OBP Pct + SLG Pct
.744
162
Games Played
162
162
Games Started
162
50
Hit By Pitch
69
0.0
Wins Above Replacement
0.0
0.0
Offensive Wins Above Replacement
0.0
34
Caught Stealing
40
1
Is Qualified
1
676.0
Runs Created
776.2
4.2
Runs Created Per 27 Outs
4.8
.086
Walks Per Plate Appearance
.090
0.39
Walk To Strikeout Ratio
0.41
.157
Isolated Power
.177
.262
Secondary Average
.302
3.93
Pitches Per Plate Appearance
3.83
431
Extra Base Hits
522
6111
Plate Appearances
6195
26.8
At Bats Per Home Run
26.2
18
Sacrifice Hit
19
38
Sacrifice Flies
39
Pitching
162
Team Games Played
162
48
Quality Starts
36
74
Wins
77
88
Losses
85
31
Saves
42
77
Holds
84
1307
Hits
1393
665
Earned runs
745
184
Home Runs
218
552
Walks
605
1450
Strikeouts
1283
9.1
Strikeouts Per 9 Innings
8.0
147.9
Pitches Per Start
151.3
1.29
Walks Plus Hits Per Inning Pitched
1.39
4.15
Earned Run Average
4.67
88
Losses
85
1441.2
Innings pitched
1437.0
.457
Win Percentage
.475
50
Save Opportunities
84
.239
Opponent Batting Average
.253
.316
Opponent's On-base pct.
.333
.397
Opponent's Slugging pct.
.423
.713
Opponent's OPB Pct + SLG Pct
.757
5459
At Bats
5502
258
Doubles
259
25
Triples
12
79
Batters Hit
82
69
Stolen Bases
115
162
Games Played
162
0
Complete Games
0
5
Shutouts
5
43
Wild Pitches
66
701
Runs Batted In
780
3
Balks
2
1441.2
Innings pitched
1437.0
9.1
Strikeouts Per 9 Innings
8.0
33
Caught Stealing
33
162
Games Started
162
0.0
Wins Above Replacement
0.0
1
Is Qualified
1
731
Runs
815
665
Earned Runs
745
2167
Total Bases
2330
Fielding
162
Team Games Played
162
1442
Full Innings
1437
5664
Total Chances
5871
4325
Putouts
4311
1245
Assists
1454
94
Errors
106
209
Double Plays
281
0.983
Fielding Percentage
0.982
34.8
Range Factor
36.1
0.0
Zone Rating
0.0
162
Games Played
162
0
Games Started
0
0.0
Defensive Wins Above Replacement
0.0
1
Qualified
1