

Mets vs Rangers Live Score (23 Sep, 2026)
Game Information
Stage
STD
Season
2026
First Pitch
Tue, Sep 22, 8:05 pm
Venue
Globe Life Field
Location
Arlington, Texas
Venue Type
Indoor
Broadcast
MLB.TV
Attendance
24,191
Live Situation
2Balls
1Strikes
0Outs
—Pitcher
—At Bat
Pitch Sequence
1
BALL
Four-seam FB
96 MPH
2
BALL
Four-seam FB
96 MPH
3
STRIKE LOOKING
Cutter
92 MPH
4
BALL IN PLAY
Cutter
93 MPH
Injury Report








Team Stats
 NYM
TEX


6
Runs
3
10
Hits
3
1
Errors
1
0
Home Runs
0
5
Walks
2
4
Strikeouts
15
Player Box Score
New York Mets
| Player | H-AB | AB | R | H | RBI | HR | BB | K | #P | AVG | OBP | SLG |
|---|---|---|---|---|---|---|---|---|---|---|---|---|
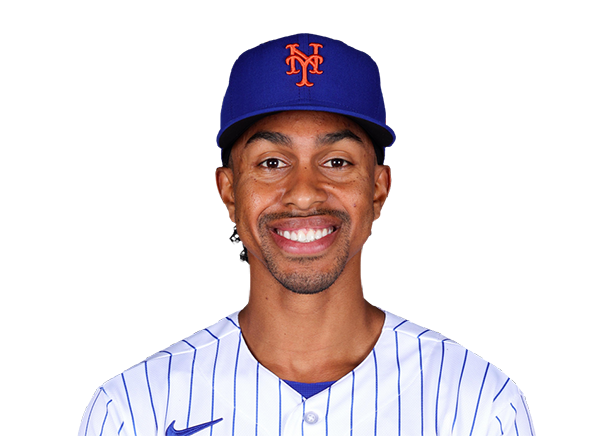 Francisco Lindor | 1-4 | 4 | 0 | 1 | 0 | 0 | 1 | 0 | 23 | .225 | .310 | .424 |
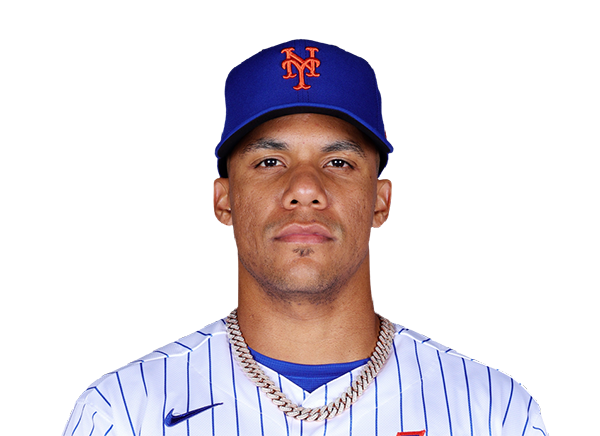 Juan Soto | 2-5 | 5 | 0 | 2 | 1 | 0 | 0 | 0 | 20 | .275 | .389 | .518 |
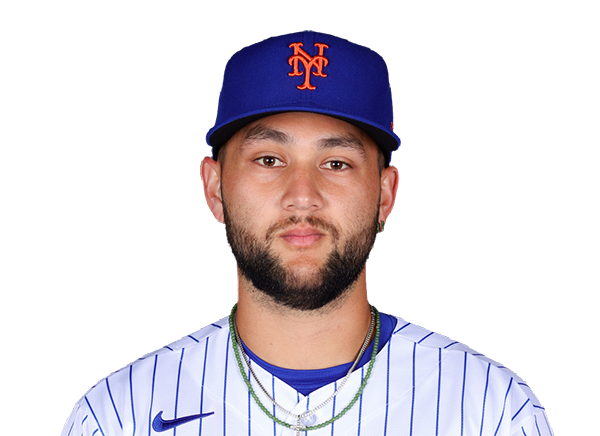 Bo Bichette | 1-4 | 4 | 0 | 1 | 0 | 0 | 1 | 1 | 21 | .263 | .313 | .391 |
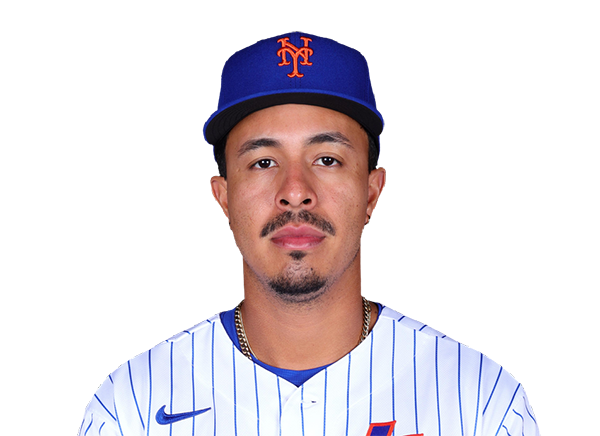 Mark Vientos | 0-2 | 2 | 0 | 0 | 0 | 0 | 0 | 1 | 5 | .217 | .265 | .403 |
 Brett Baty | 1-2 | 2 | 1 | 1 | 0 | 0 | 1 | 0 | 10 | .236 | .312 | .369 |
 Carson Benge | 2-4 | 4 | 2 | 2 | 1 | 0 | 1 | 1 | 21 | .277 | .341 | .423 |
 Marcus Semien | 0-5 | 5 | 1 | 0 | 0 | 0 | 0 | 0 | 20 | .217 | .282 | .338 |
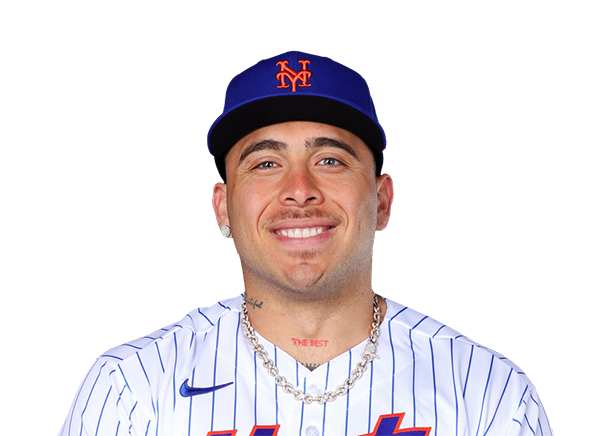 Francisco Alvarez | 2-5 | 5 | 2 | 2 | 2 | 0 | 0 | 1 | 17 | .234 | .313 | .405 |
 A.J. Ewing | 1-3 | 3 | 0 | 1 | 0 | 0 | 1 | 0 | 17 | .257 | .326 | .379 |
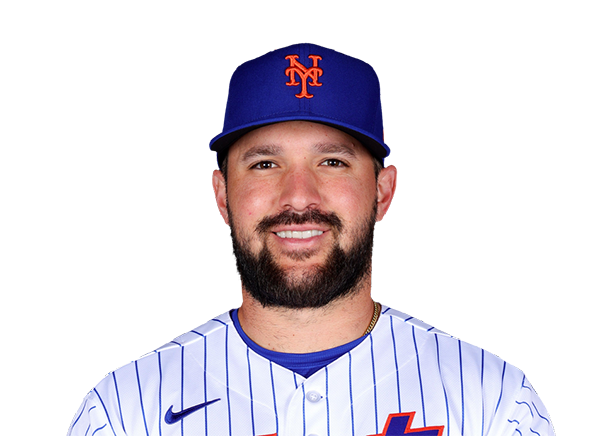 Luis Torrens | 0-3 | 3 | 0 | 0 | 1 | 0 | 0 | 0 | 14 | .241 | .299 | .406 |
Texas Rangers
| Player | H-AB | AB | R | H | RBI | HR | BB | K | #P | AVG | OBP | SLG |
|---|---|---|---|---|---|---|---|---|---|---|---|---|
 Wyatt Langford | 0-3 | 3 | 0 | 0 | 1 | 0 | 0 | 3 | 17 | .242 | .339 | .434 |
 Corey Seager | 0-4 | 4 | 0 | 0 | 0 | 0 | 0 | 3 | 13 | .229 | .318 | .421 |
 Josh Jung | 1-4 | 4 | 0 | 1 | 1 | 0 | 0 | 2 | 13 | .294 | .359 | .450 |
 Jake Burger | 0-4 | 4 | 0 | 0 | 0 | 0 | 0 | 3 | 15 | .231 | .305 | .425 |
 Brandon Nimmo | 2-4 | 4 | 1 | 2 | 0 | 0 | 0 | 1 | 12 | .261 | .326 | .408 |
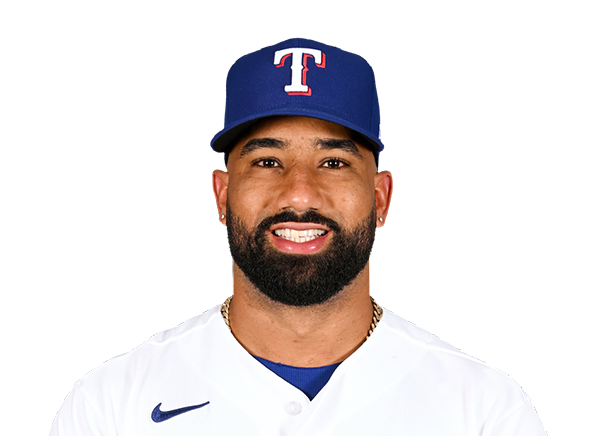 Ezequiel Duran | 0-3 | 3 | 1 | 0 | 0 | 0 | 1 | 1 | 26 | .263 | .324 | .428 |
 Justin Foscue | 0-2 | 2 | 0 | 0 | 0 | 0 | 0 | 1 | 13 | .269 | .332 | .489 |
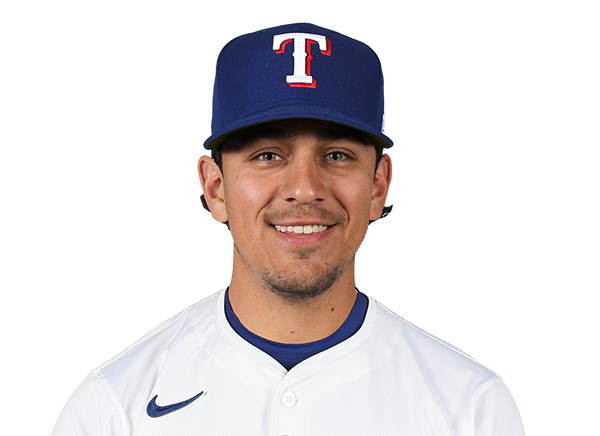 Nicky Lopez | 0-0 | 0 | 0 | 0 | 0 | 0 | 0 | 0 | 4 | .269 | .320 | .308 |
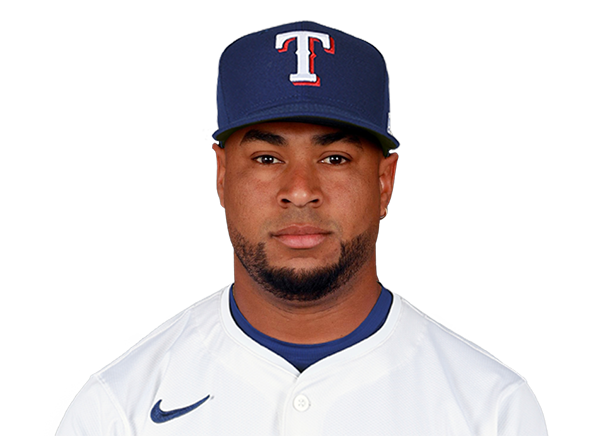 Elias Diaz | 0-2 | 2 | 0 | 0 | 1 | 0 | 0 | 0 | 12 | .234 | .266 | .393 |
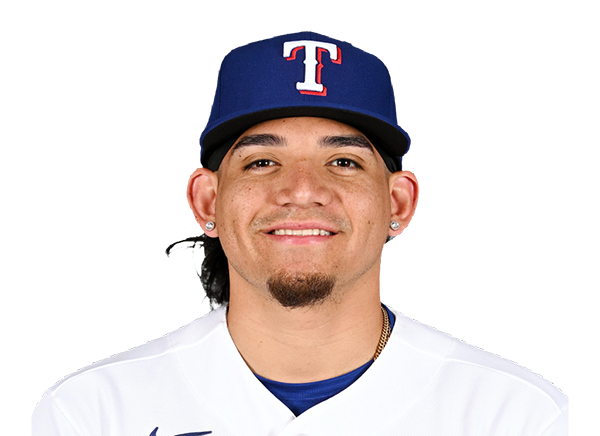 Alejandro Osuna | 0-1 | 1 | 0 | 0 | 0 | 0 | 0 | 1 | 4 | .258 | .347 | .298 |
 Danny Jansen | 0-2 | 2 | 1 | 0 | 0 | 0 | 1 | 0 | 14 | .199 | .296 | .359 |
New York Mets
| Player | IP | H | R | ER | BB | K | HR | PC-ST | ERA | PC |
|---|---|---|---|---|---|---|---|---|---|---|
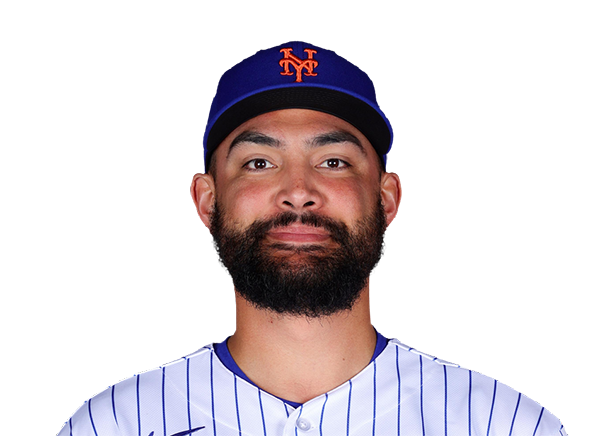 Sean Manaea | 6.0 | 3 | 3 | 2 | 2 | 9 | 0 | 99-68 | 4.67 | 99 |
 Nate Lavender | 1.0 | 0 | 0 | 0 | 0 | 2 | 0 | 17-11 | 1.83 | 17 |
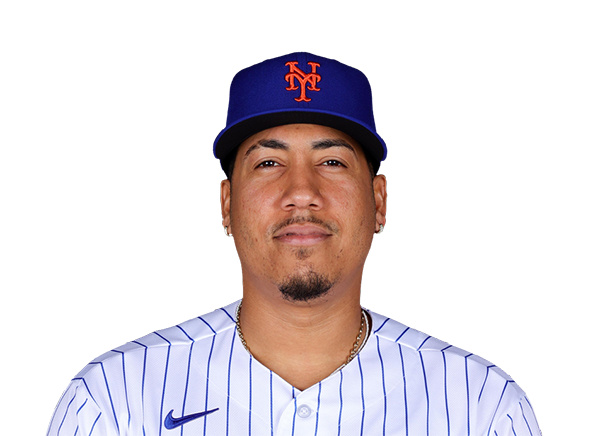 Dedniel Nunez | 1.0 | 0 | 0 | 0 | 0 | 2 | 0 | 8-7 | 3.50 | 8 |
 Kodai Senga | 1.0 | 0 | 0 | 0 | 0 | 2 | 0 | 19-11 | 7.34 | 19 |
Texas Rangers
| Player | IP | H | R | ER | BB | K | HR | PC-ST | ERA | PC |
|---|---|---|---|---|---|---|---|---|---|---|
 MacKenzie Gore | 5.0 | 4 | 2 | 1 | 1 | 2 | 0 | 77-50 | 4.59 | 77 |
 Nathan Eovaldi | 1.0 | 3 | 3 | 3 | 1 | 0 | 0 | 29-19 | 4.27 | 29 |
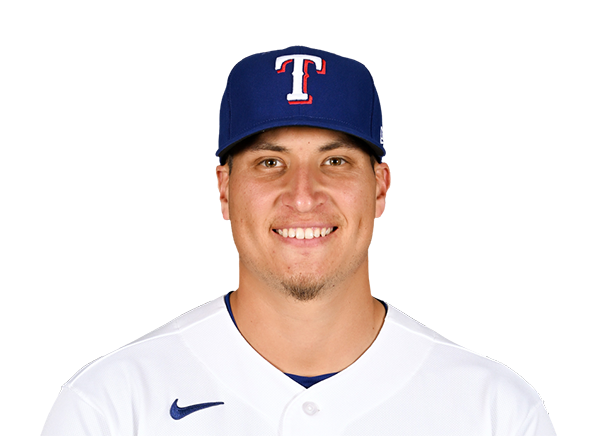 Robert Garcia | 0.2 | 1 | 1 | 1 | 1 | 0 | 0 | 19-10 | 2.87 | 19 |
 Jakob Junis | 1.1 | 1 | 0 | 0 | 1 | 0 | 0 | 28-16 | 3.57 | 28 |
 Peyton Gray | 1.0 | 1 | 0 | 0 | 1 | 2 | 0 | 15-9 | 3.86 | 15 |
H2H / Season Series
TEX3–6
NYM
Last 5 Games
| Date | Opponent | Result |
|---|---|---|
| Sep 22 | @ TEX | W6–3 |
| Sep 20 |  vs PHI | L2–7 |
| Sep 19 | vs PHI | W10–3 |
| Sep 18 | vs PHI | W6–3 |
| Sep 17 | vs PHI | L0–3 |
| Date | Opponent | Result |
|---|---|---|
| Sep 22 | vs NYM | L3–6 |
| Sep 20 |  vs TOR | L2–7 |
| Sep 19 | vs TOR | W6–2 |
| Sep 18 | vs TOR | W7–1 |
| Sep 17 |  vs BOS | L3–4 |
Standings
American League
| Team | W | L | PCT | GB | DIFF | STRK |
|---|---|---|---|---|---|---|
1 Rays | 96 | 61 | .611 | - | +86 | W1 |
2 Guardians | 82 | 75 | .522 | 14 | +3 | W6 |
3 Astros | 78 | 79 | .497 | 18 | -52 | W1 |
4 Yankees | 90 | 67 | .573 | 6 | +134 | L1 |
| 5Red Sox | 84 | 73 | .535 | 12 | +79 | L3 |
6 White Sox | 81 | 76 | .516 | 15 | +45 | W3 |
| 7Rangers | 78 | 79 | .497 | 18 | -37 | L2 |
| 8Blue Jays | 77 | 80 | .490 | 19 | -43 | L1 |
9 Orioles | 76 | 81 | .484 | 20 | -30 | W1 |
10 Twins | 74 | 84 | .468 | 22.5 | -66 | W1 |
11 Tigers | 74 | 84 | .468 | 22.5 | +73 | L1 |
12 Mariners | 73 | 84 | .465 | 23 | -63 | L1 |
13 Royals | 67 | 90 | .427 | 29 | -105 | L5 |
14 Athletics | 62 | 95 | .395 | 34 | -221 | W1 |
15 Angels | 60 | 97 | .382 | 36 | -89 | L2 |
National League
| Team | W | L | PCT | GB | DIFF | STRK |
|---|---|---|---|---|---|---|
1 Brewers | 98 | 59 | .624 | - | +200 | L1 |
2 Dodgers | 97 | 60 | .618 | 1 | +200 | W5 |
3 Braves | 92 | 65 | .586 | 6 | +116 | L1 |
| 4Phillies | 87 | 70 | .554 | 11 | +31 | W2 |
5 Cubs | 87 | 70 | .554 | 11 | +146 | L1 |
6 Padres | 87 | 70 | .554 | 11 | +34 | L1 |
7 Diamondbacks | 83 | 74 | .529 | 15 | +4 | W3 |
8 Pirates | 80 | 77 | .510 | 18 | +31 | W5 |
9 Marlins | 77 | 80 | .490 | 21 | +3 | W1 |
10 Cardinals | 76 | 81 | .484 | 22 | -25 | L1 |
11 Nationals | 74 | 84 | .468 | 24.5 | +7 | W1 |
12 Reds | 73 | 84 | .465 | 25 | -159 | W1 |
| 13Mets | 72 | 85 | .459 | 26 | -38 | W1 |
14 Giants | 65 | 93 | .411 | 33.5 | -82 | L1 |
15 Rockies | 57 | 100 | .363 | 41 | -182 | L2 |
NYM
VS
TEX
Pitchers
Sean Manaea
Catchers
Luis Torrens
Infielders
Francisco Lindor
Bo Bichette
Mark Vientos
Marcus Semien
Outfielders
Juan Soto
Carson Benge
A.J. Ewing
Designated Hitters
Francisco Alvarez
Pitchers
MacKenzie Gore
Catchers
Danny Jansen
Infielders
Corey Seager
Josh Jung
Jake Burger
Justin Foscue
Outfielders
Wyatt Langford
Brandon Nimmo
Ezequiel Duran
Designated Hitters
Elias Diaz
Mets
VS
Rangers
Batting
157
Team Games Played
157
5303
At Bats
5203
1268
Hits
1261
644
Runs Batted In
632
194
Home Runs
176
83
Stolen Bases
76
.239
Batting Average
.242
674
Runs
656
203
Doubles
229
18
Triples
22
2089
Total Bases
2062
509
Walks
517
1318
Strikeouts
1349
.310
On Base Percentage
.318
.394
Slugging Percentage
.396
.704
OBP Pct + SLG Pct
.714
157
Games Played
157
157
Games Started
157
49
Hit By Pitch
77
0.0
Wins Above Replacement
0.0
0.0
Offensive Wins Above Replacement
0.0
33
Caught Stealing
21
1
Is Qualified
1
652.6
Runs Created
665.5
4.2
Runs Created Per 27 Outs
4.3
.086
Walks Per Plate Appearance
.088
0.39
Walk To Strikeout Ratio
0.38
.155
Isolated Power
.154
.260
Secondary Average
.264
3.93
Pitches Per Plate Appearance
3.87
415
Extra Base Hits
427
5919
Plate Appearances
5872
27.3
At Bats Per Home Run
29.6
18
Sacrifice Hit
37
36
Sacrifice Flies
37
Pitching
157
Team Games Played
157
47
Quality Starts
49
72
Wins
78
85
Losses
79
31
Saves
42
75
Holds
80
1273
Hits
1312
646
Earned runs
655
179
Home Runs
184
539
Walks
480
1413
Strikeouts
1301
9.1
Strikeouts Per 9 Innings
8.5
148.1
Pitches Per Start
145.2
1.29
Walks Plus Hits Per Inning Pitched
1.30
4.15
Earned Run Average
4.28
85
Losses
79
1399.2
Innings pitched
1376.1
.459
Win Percentage
.497
50
Save Opportunities
62
.240
Opponent Batting Average
.248
.317
Opponent's On-base pct.
.316
.398
Opponent's Slugging pct.
.408
.715
Opponent's OPB Pct + SLG Pct
.725
5305
At Bats
5296
253
Doubles
253
24
Triples
23
78
Batters Hit
67
66
Stolen Bases
94
157
Games Played
157
0
Complete Games
0
5
Shutouts
13
37
Wild Pitches
43
684
Runs Batted In
672
3
Balks
2
1399.2
Innings pitched
1376.1
9.1
Strikeouts Per 9 Innings
8.5
30
Caught Stealing
24
157
Games Started
157
0.0
Wins Above Replacement
0.0
1
Is Qualified
1
712
Runs
693
646
Earned Runs
655
2111
Total Bases
2163
Fielding
157
Team Games Played
157
1400
Full Innings
1376
5498
Total Chances
5428
4199
Putouts
4129
1207
Assists
1232
92
Errors
67
203
Double Plays
229
0.983
Fielding Percentage
0.988
34.8
Range Factor
35.1
0.0
Zone Rating
0.0
157
Games Played
157
0
Games Started
0
0.0
Defensive Wins Above Replacement
0.0
1
Qualified
1