

Mets vs Rangers Live Score (24 Sep, 2026)
Game Information
Stage
STD
Season
2026
First Pitch
Thu, Sep 24, 2:35 pm
Venue
Globe Life Field
Location
Arlington, Texas
Venue Type
Indoor
Broadcast
MLB.TV
Attendance
25,320
Live Situation
2Balls
3Strikes
0Outs
—Pitcher
—At Bat
Pitch Sequence
1
STRIKE LOOKING
Slider
83 MPH
2
BALL
Slider
83 MPH
3
BALL
Sinker
89 MPH
4
STRIKE LOOKING
Sinker
90 MPH
5
STRIKE SWINGING
Sinker
91 MPH
Injury Report








Team Stats
 NYM
TEX


1
Runs
3
4
Hits
7
0
Errors
0
0
Home Runs
2
2
Walks
3
7
Strikeouts
8
Player Box Score
New York Mets
| Player | H-AB | AB | R | H | RBI | HR | BB | K | #P | AVG | OBP | SLG |
|---|---|---|---|---|---|---|---|---|---|---|---|---|
 Francisco Lindor | 1-4 | 4 | 1 | 1 | 0 | 0 | 0 | 1 | 19 | .225 | .308 | .422 |
 Juan Soto | 0-3 | 3 | 0 | 0 | 0 | 0 | 1 | 0 | 11 | .274 | .393 | .522 |
 Bo Bichette | 0-4 | 4 | 0 | 0 | 0 | 0 | 0 | 0 | 12 | .259 | .310 | .386 |
 Carson Benge | 1-4 | 4 | 0 | 1 | 1 | 0 | 0 | 1 | 14 | .274 | .338 | .419 |
 Brett Baty | 1-3 | 3 | 0 | 1 | 0 | 0 | 0 | 0 | 12 | .238 | .313 | .377 |
 Marcus Semien | 0-2 | 2 | 0 | 0 | 0 | 0 | 1 | 1 | 15 | .216 | .283 | .342 |
 A.J. Ewing | 0-3 | 3 | 0 | 0 | 0 | 0 | 0 | 0 | 17 | .256 | .326 | .376 |
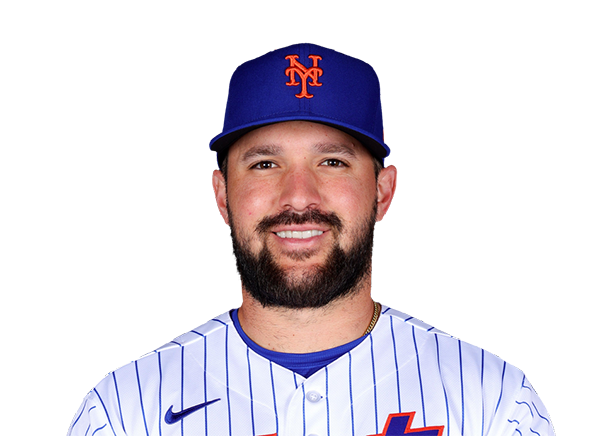 Luis Torrens | 0-3 | 3 | 0 | 0 | 0 | 0 | 0 | 2 | 14 | .238 | .296 | .401 |
 Nick Morabito | 1-3 | 3 | 0 | 1 | 0 | 0 | 0 | 2 | 12 | .195 | .283 | .244 |
Texas Rangers
| Player | H-AB | AB | R | H | RBI | HR | BB | K | #P | AVG | OBP | SLG |
|---|---|---|---|---|---|---|---|---|---|---|---|---|
 Justin Foscue | 1-3 | 3 | 1 | 1 | 0 | 0 | 0 | 0 | 10 | .270 | .332 | .486 |
 Evan Carter | 0-0 | 0 | 0 | 0 | 0 | 0 | 1 | 0 | 5 | .193 | .288 | .313 |
 Corey Seager | 1-4 | 4 | 1 | 1 | 1 | 1 | 0 | 2 | 22 | .226 | .314 | .423 |
 Josh Jung | 3-3 | 3 | 1 | 3 | 2 | 1 | 1 | 0 | 14 | .299 | .363 | .462 |
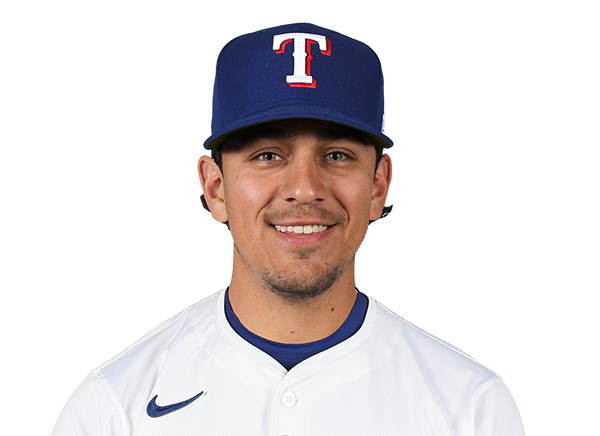 Nicky Lopez | 0-0 | 0 | 0 | 0 | 0 | 0 | 0 | 0 | 0 | .270 | .320 | .309 |
 Jake Burger | 0-4 | 4 | 0 | 0 | 0 | 0 | 0 | 0 | 10 | .230 | .303 | .421 |
 Brandon Nimmo | 0-2 | 2 | 0 | 0 | 0 | 0 | 1 | 1 | 12 | .260 | .326 | .405 |
 Wyatt Langford | 2-3 | 3 | 0 | 2 | 0 | 0 | 0 | 1 | 10 | .241 | .336 | .429 |
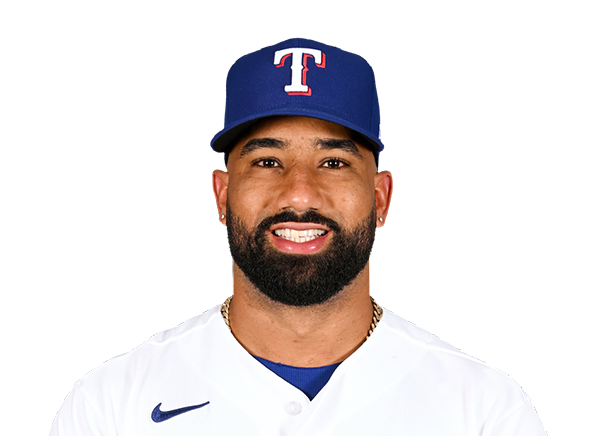 Ezequiel Duran | 0-3 | 3 | 0 | 0 | 0 | 0 | 0 | 2 | 22 | .259 | .320 | .422 |
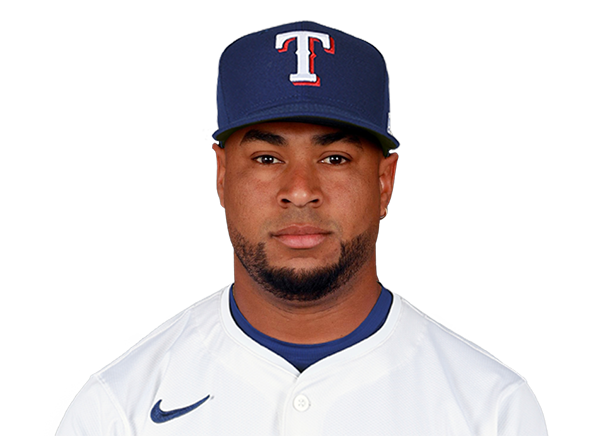 Elias Diaz | 0-3 | 3 | 0 | 0 | 0 | 0 | 0 | 1 | 24 | .230 | .263 | .387 |
 Danny Jansen | 0-3 | 3 | 0 | 0 | 0 | 0 | 0 | 1 | 10 | .194 | .292 | .349 |
New York Mets
| Player | IP | H | R | ER | BB | K | HR | PC-ST | ERA | PC |
|---|---|---|---|---|---|---|---|---|---|---|
 Zac Thornton | 5.0 | 4 | 2 | 2 | 1 | 4 | 1 | 83-58 | 3.42 | 83 |
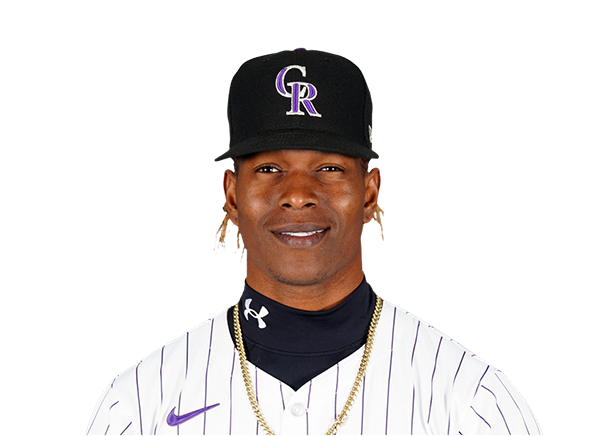 Jefry Yan | 0.2 | 2 | 1 | 1 | 1 | 1 | 1 | 16-9 | 4.34 | 16 |
|
Austin Warren | 1.1 | 0 | 0 | 0 | 0 | 2 | 0 | 20-13 | 4.01 | 20 |
|
Jack Weisenburger | 1.0 | 1 | 0 | 0 | 1 | 1 | 0 | 20-13 | 2.13 | 20 |
Texas Rangers
| Player | IP | H | R | ER | BB | K | HR | PC-ST | ERA | PC |
|---|---|---|---|---|---|---|---|---|---|---|
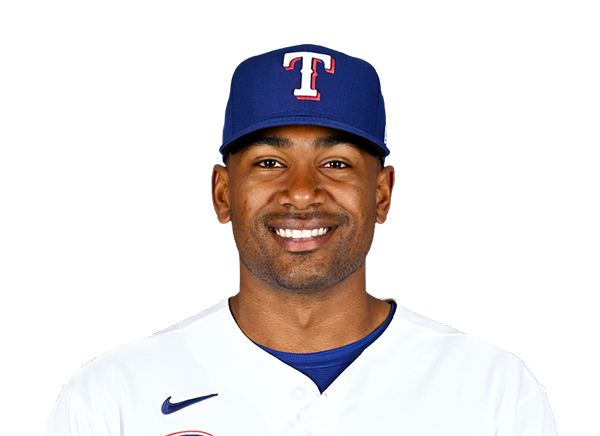 Kumar Rocker | 5.0 | 3 | 1 | 1 | 2 | 4 | 0 | 74-45 | 4.38 | 74 |
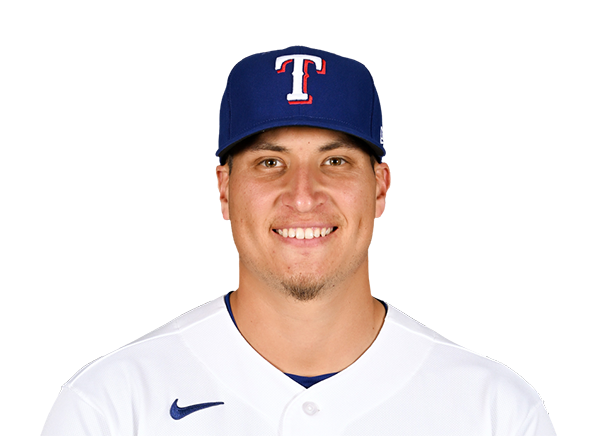 Robert Garcia | 1.0 | 0 | 0 | 0 | 0 | 0 | 0 | 10-6 | 2.70 | 10 |
 Tyler Alexander | 1.0 | 1 | 0 | 0 | 0 | 0 | 0 | 20-14 | 3.55 | 20 |
 Chase Silseth | 1.0 | 0 | 0 | 0 | 0 | 2 | 0 | 14-9 | 3.32 | 14 |
 Jordan Montgomery | 1.0 | 0 | 0 | 0 | 0 | 1 | 0 | 8-5 | 4.63 | 8 |
H2H / Season Series
TEX3–1
NYM
TEX2–7
NYM
TEX3–6
NYM
Last 5 Games
| Date | Opponent | Result |
|---|---|---|
| Sep 24 | @ TEX | L1–3 |
| Sep 23 | @ TEX | W7–2 |
| Sep 22 | @ TEX | W6–3 |
| Sep 20 |  vs PHI | L2–7 |
| Sep 19 | vs PHI | W10–3 |
| Date | Opponent | Result |
|---|---|---|
| Sep 24 | vs NYM | W3–1 |
| Sep 23 | vs NYM | L2–7 |
| Sep 22 | vs NYM | L3–6 |
| Sep 20 |  vs TOR | L2–7 |
| Sep 19 | vs TOR | W6–2 |
Standings
American League
| Team | W | L | PCT | GB | DIFF | STRK |
|---|---|---|---|---|---|---|
1 Rays | 96 | 63 | .604 | - | +77 | L2 |
2 Guardians | 83 | 76 | .522 | 13 | +3 | W1 |
3 Astros | 79 | 80 | .497 | 17 | -51 | W1 |
4 Yankees | 92 | 67 | .579 | 4 | +143 | W2 |
5 Red Sox | 85 | 74 | .535 | 11 | +79 | L1 |
6 White Sox | 82 | 77 | .516 | 14 | +52 | W1 |
| 7Rangers | 79 | 80 | .497 | 17 | -40 | W1 |
8 Orioles | 78 | 81 | .491 | 18 | -26 | W3 |
| 9Blue Jays | 77 | 82 | .484 | 19 | -47 | L3 |
10 Twins | 75 | 84 | .472 | 21 | -64 | W2 |
11 Tigers | 74 | 85 | .465 | 22 | +71 | L2 |
12 Mariners | 74 | 85 | .465 | 22 | -64 | L1 |
13 Royals | 68 | 91 | .428 | 28 | -112 | L1 |
14 Athletics | 63 | 96 | .396 | 33 | -219 | L1 |
15 Angels | 61 | 98 | .384 | 35 | -91 | W1 |
National League
| Team | W | L | PCT | GB | DIFF | STRK |
|---|---|---|---|---|---|---|
1 Brewers | 100 | 59 | .629 | - | +207 | W2 |
2 Dodgers | 97 | 62 | .610 | 3 | +194 | L2 |
3 Braves | 93 | 66 | .585 | 7 | +116 | L1 |
4 Padres | 89 | 70 | .560 | 11 | +40 | W2 |
5 Cubs | 88 | 71 | .553 | 12 | +146 | W1 |
| 6Phillies | 87 | 72 | .547 | 13 | +24 | L2 |
7 Diamondbacks | 85 | 74 | .535 | 15 | +10 | W5 |
8 Pirates | 81 | 78 | .509 | 19 | +28 | W1 |
9 Marlins | 78 | 81 | .491 | 22 | +3 | L1 |
10 Cardinals | 77 | 82 | .484 | 23 | -22 | L1 |
11 Nationals | 75 | 84 | .472 | 25 | +9 | W2 |
12 Reds | 74 | 85 | .465 | 26 | -159 | W1 |
| 13Mets | 73 | 86 | .459 | 27 | -35 | L1 |
14 Giants | 65 | 94 | .409 | 35 | -84 | L2 |
15 Rockies | 57 | 102 | .358 | 43 | -188 | L4 |
NYM
VS
TEX
Pitchers
Zac Thornton
Catchers
Luis Torrens
Infielders
Francisco Lindor
Bo Bichette
Brett Baty
Marcus Semien
Outfielders
Carson Benge
A.J. Ewing
Nick Morabito
Designated Hitters
Juan Soto
Pitchers
Kumar Rocker
Catchers
Elias Diaz
Infielders
Justin Foscue
Corey Seager
Josh Jung
Jake Burger
Outfielders
Brandon Nimmo
Wyatt Langford
Ezequiel Duran
Designated Hitters
Danny Jansen
Mets
VS
Rangers
Batting
159
Team Games Played
159
5368
At Bats
5262
1280
Hits
1271
652
Runs Batted In
637
197
Home Runs
178
83
Stolen Bases
77
.238
Batting Average
.242
682
Runs
661
205
Doubles
230
18
Triples
22
2112
Total Bases
2079
516
Walks
521
1332
Strikeouts
1363
.309
On Base Percentage
.317
.393
Slugging Percentage
.395
.703
OBP Pct + SLG Pct
.712
159
Games Played
159
159
Games Started
159
49
Hit By Pitch
77
0.0
Wins Above Replacement
0.0
0.0
Offensive Wins Above Replacement
0.0
34
Caught Stealing
23
1
Is Qualified
1
658.2
Runs Created
668.0
4.2
Runs Created Per 27 Outs
4.3
.086
Walks Per Plate Appearance
.088
0.39
Walk To Strikeout Ratio
0.38
.155
Isolated Power
.154
.260
Secondary Average
.263
3.92
Pitches Per Plate Appearance
3.88
420
Extra Base Hits
430
5991
Plate Appearances
5935
27.2
At Bats Per Home Run
29.6
18
Sacrifice Hit
37
36
Sacrifice Flies
37
Pitching
159
Team Games Played
159
48
Quality Starts
49
73
Wins
79
86
Losses
80
31
Saves
43
76
Holds
83
1284
Hits
1324
651
Earned runs
663
181
Home Runs
187
543
Walks
487
1427
Strikeouts
1315
9.1
Strikeouts Per 9 Innings
8.5
147.8
Pitches Per Start
145.0
1.29
Walks Plus Hits Per Inning Pitched
1.30
4.14
Earned Run Average
4.28
86
Losses
80
1416.2
Innings pitched
1394.1
.459
Win Percentage
.497
50
Save Opportunities
63
.239
Opponent Batting Average
.247
.316
Opponent's On-base pct.
.316
.397
Opponent's Slugging pct.
.408
.713
Opponent's OPB Pct + SLG Pct
.723
5364
At Bats
5361
254
Doubles
255
24
Triples
23
78
Batters Hit
67
67
Stolen Bases
94
159
Games Played
159
0
Complete Games
0
5
Shutouts
13
37
Wild Pitches
43
689
Runs Batted In
680
3
Balks
2
1416.2
Innings pitched
1394.1
9.1
Strikeouts Per 9 Innings
8.5
32
Caught Stealing
25
159
Games Started
159
0.0
Wins Above Replacement
0.0
1
Is Qualified
1
717
Runs
701
651
Earned Runs
663
2129
Total Bases
2186
Fielding
159
Team Games Played
159
1417
Full Innings
1394
5569
Total Chances
5500
4250
Putouts
4183
1227
Assists
1249
92
Errors
68
205
Double Plays
230
0.983
Fielding Percentage
0.988
34.8
Range Factor
35.1
0.0
Zone Rating
0.0
159
Games Played
159
0
Games Started
0
0.0
Defensive Wins Above Replacement
0.0
1
Qualified
1