

Mets vs Rays Live Score (31 Aug, 2026)
Game Information
Stage
STD
Season
2026
First Pitch
Mon, Aug 31, 6:40 pm
Venue
Tropicana Field
Location
St. Petersburg, Florida
Venue Type
Indoor
Broadcast
MLB.TV
Attendance
13,618
Live Situation
0Balls
3Strikes
0Outs
—Pitcher
—At Bat
Pitch Sequence
1
STRIKE LOOKING
Four-seam FB
97 MPH
2
STRIKE FOUL
Forkball
83 MPH
3
STRIKE LOOKING
Forkball
85 MPH
Injury Report
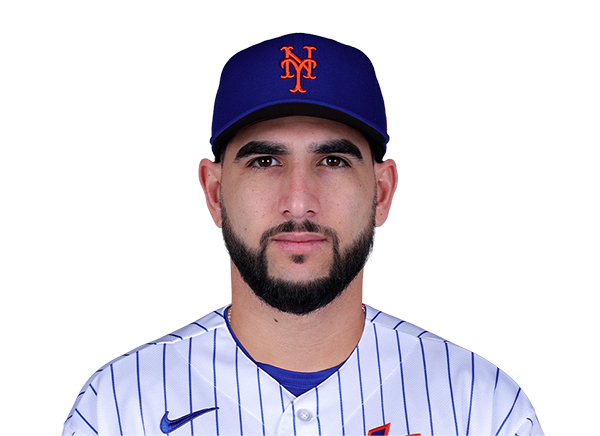

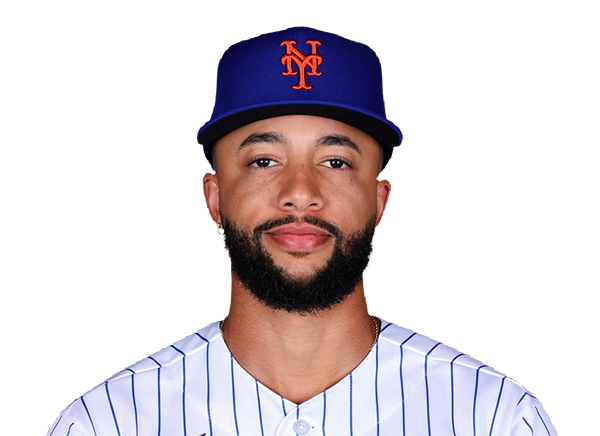





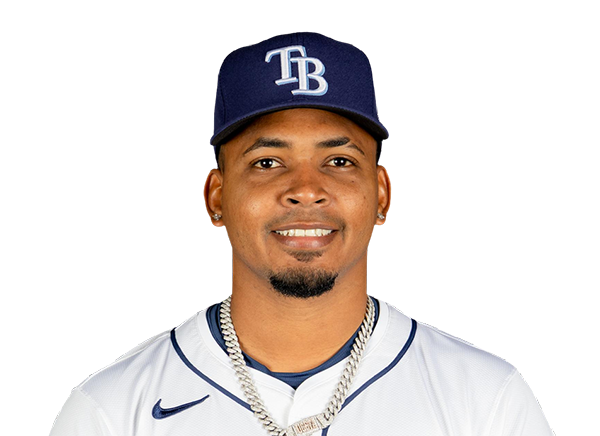

Team Stats
 NYM
TB


3
Runs
2
10
Hits
9
0
Errors
0
1
Home Runs
0
0
Walks
2
12
Strikeouts
6
Player Box Score
New York Mets
| Player | H-AB | AB | R | H | RBI | HR | BB | K | #P | AVG | OBP | SLG |
|---|---|---|---|---|---|---|---|---|---|---|---|---|
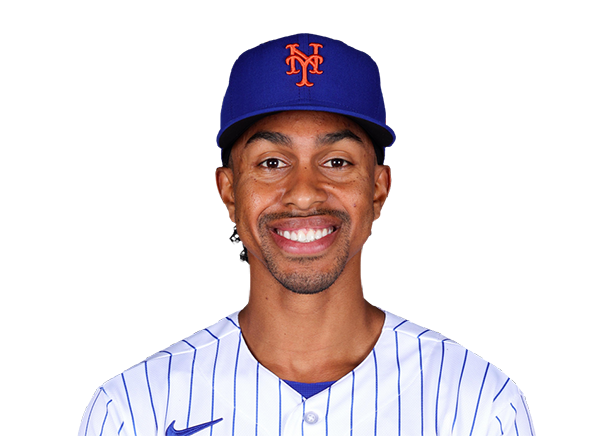 Francisco Lindor | 0-4 | 4 | 0 | 0 | 0 | 0 | 0 | 1 | 15 | .231 | .316 | .420 |
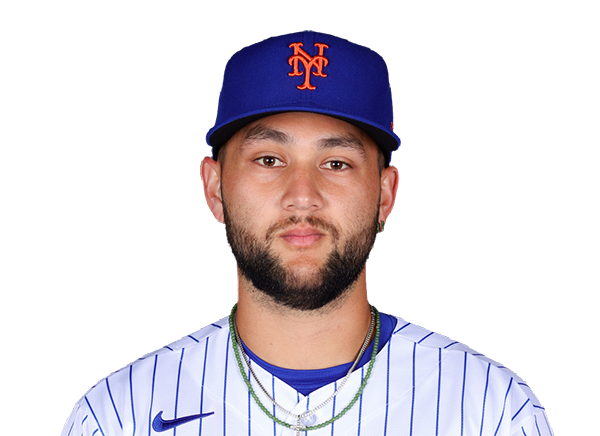 Bo Bichette | 1-4 | 4 | 1 | 1 | 0 | 0 | 0 | 1 | 13 | .263 | .310 | .391 |
 Carson Benge | 1-4 | 4 | 0 | 1 | 0 | 0 | 0 | 3 | 18 | .277 | .336 | .421 |
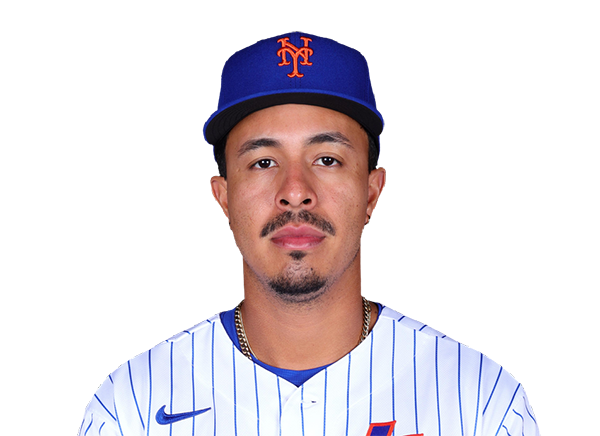 Mark Vientos | 1-4 | 4 | 1 | 1 | 1 | 1 | 0 | 1 | 12 | .212 | .256 | .398 |
 Jared Young | 1-4 | 4 | 0 | 1 | 0 | 0 | 0 | 1 | 17 | .269 | .328 | .443 |
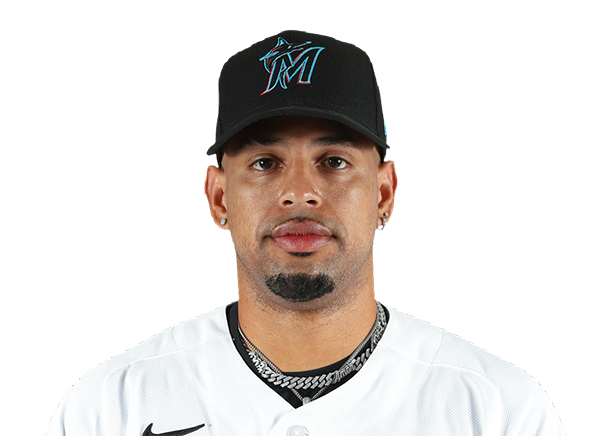 Christopher Morel | 1-3 | 3 | 0 | 1 | 0 | 0 | 0 | 1 | 9 | .171 | .236 | .207 |
 Cristian Pache | 1-1 | 1 | 1 | 1 | 0 | 0 | 0 | 0 | 6 | .125 | .125 | .125 |
 Marcus Semien | 1-4 | 4 | 0 | 1 | 0 | 0 | 0 | 0 | 16 | .218 | .279 | .347 |
 A.J. Ewing | 2-4 | 4 | 0 | 2 | 0 | 0 | 0 | 1 | 14 | .239 | .311 | .352 |
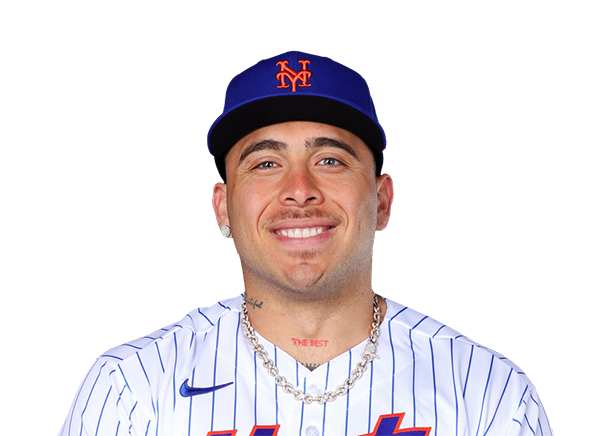 Francisco Alvarez | 1-3 | 3 | 0 | 1 | 1 | 0 | 0 | 2 | 12 | .234 | .320 | .397 |
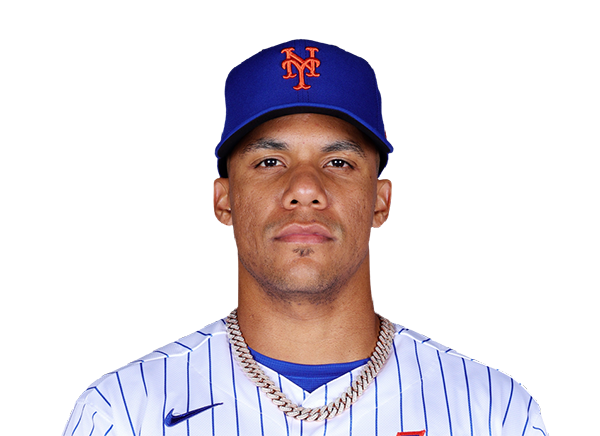 Juan Soto | 0-1 | 1 | 0 | 0 | 0 | 0 | 0 | 1 | 3 | .282 | .406 | .542 |
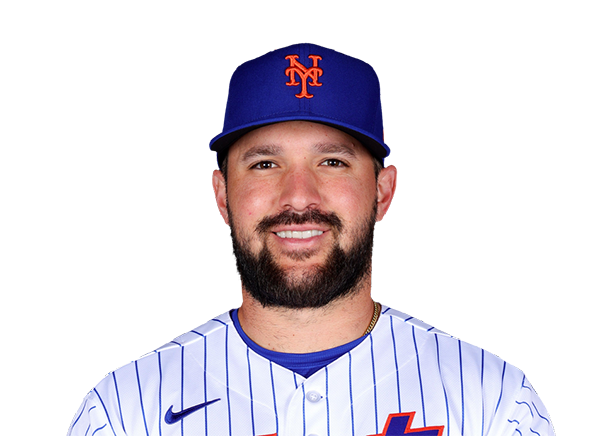 Luis Torrens | 0-0 | 0 | 0 | 0 | 0 | 0 | 0 | 0 | 0 | .239 | .302 | .401 |
Tampa Bay Rays
| Player | H-AB | AB | R | H | RBI | HR | BB | K | #P | AVG | OBP | SLG |
|---|---|---|---|---|---|---|---|---|---|---|---|---|
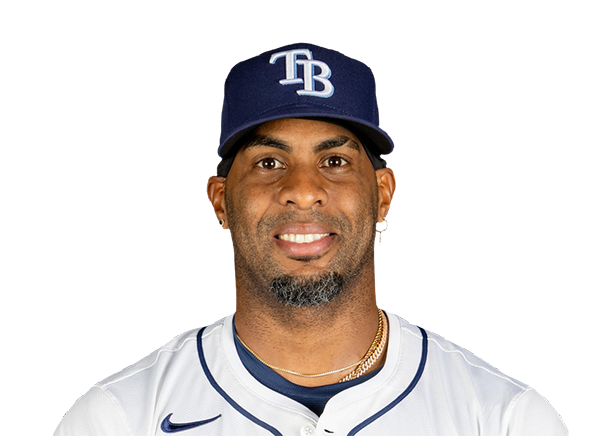 Yandy Diaz | 0-5 | 5 | 0 | 0 | 0 | 0 | 0 | 3 | 18 | .300 | .368 | .461 |
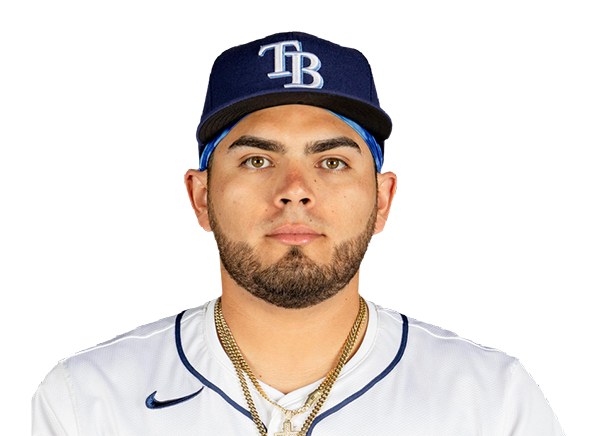 Jonathan Aranda | 0-3 | 3 | 1 | 0 | 0 | 0 | 1 | 0 | 20 | .277 | .360 | .419 |
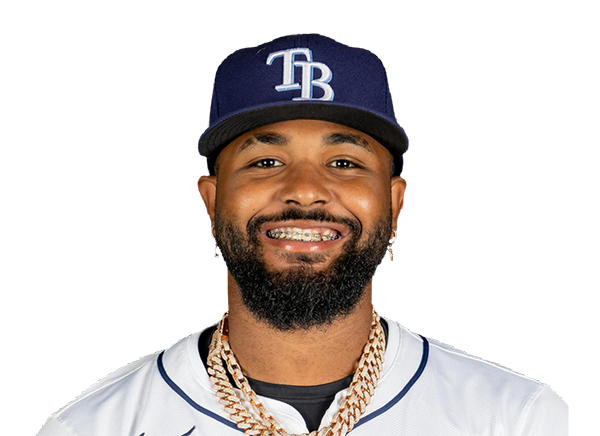 Junior Caminero | 1-4 | 4 | 0 | 1 | 0 | 0 | 0 | 1 | 15 | .282 | .369 | .536 |
 Liam Hicks | 2-4 | 4 | 0 | 2 | 1 | 0 | 0 | 0 | 9 | .290 | .373 | .447 |
 Jorge Mateo | 0-0 | 0 | 0 | 0 | 0 | 0 | 0 | 0 | 0 | .232 | .281 | .374 |
 Kenny Piper | 0-0 | 0 | 0 | 0 | 0 | 0 | 0 | 0 | 0 | .222 | .300 | .556 |
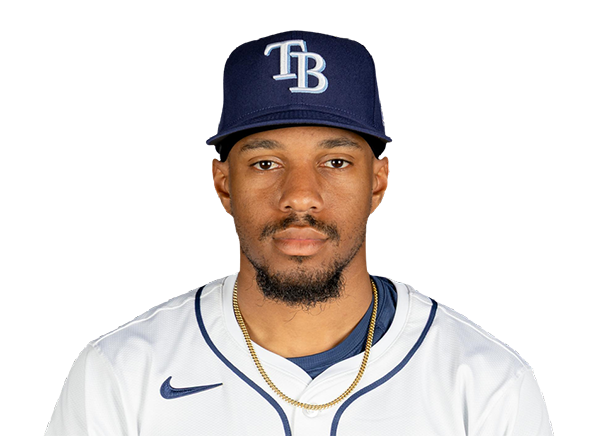 Chandler Simpson | 2-4 | 4 | 0 | 2 | 1 | 0 | 0 | 0 | 13 | .311 | .339 | .364 |
 Cedric Mullins | 1-4 | 4 | 0 | 1 | 0 | 0 | 0 | 0 | 18 | .206 | .287 | .354 |
 Jonny DeLuca | 1-3 | 3 | 0 | 1 | 0 | 0 | 1 | 2 | 13 | .267 | .299 | .434 |
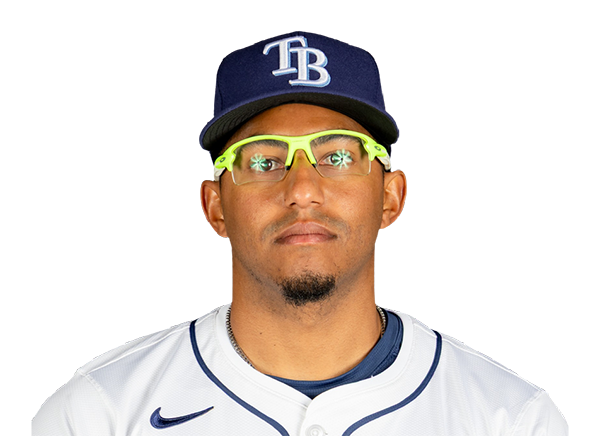 Richie Palacios | 1-4 | 4 | 0 | 1 | 0 | 0 | 0 | 0 | 17 | .226 | .321 | .332 |
 Taylor Walls | 1-4 | 4 | 1 | 1 | 0 | 0 | 0 | 0 | 15 | .219 | .305 | .290 |
New York Mets
| Player | IP | H | R | ER | BB | K | HR | PC-ST | ERA | PC |
|---|---|---|---|---|---|---|---|---|---|---|
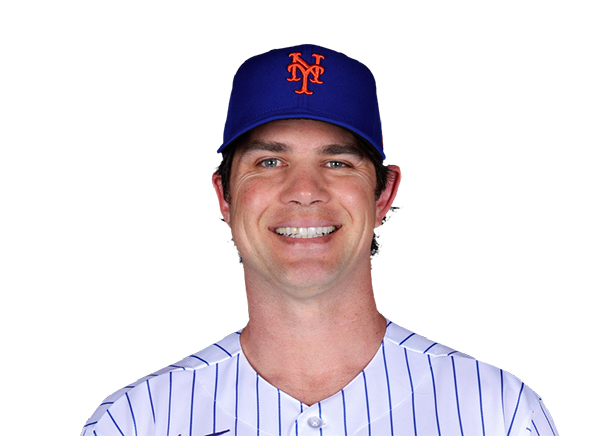 Robert Stock | 5.1 | 5 | 0 | 0 | 0 | 4 | 0 | 72-50 | 5.88 | 72 |
 Nate Lavender | 0.2 | 1 | 0 | 0 | 0 | 0 | 0 | 9-5 | 0.00 | 9 |
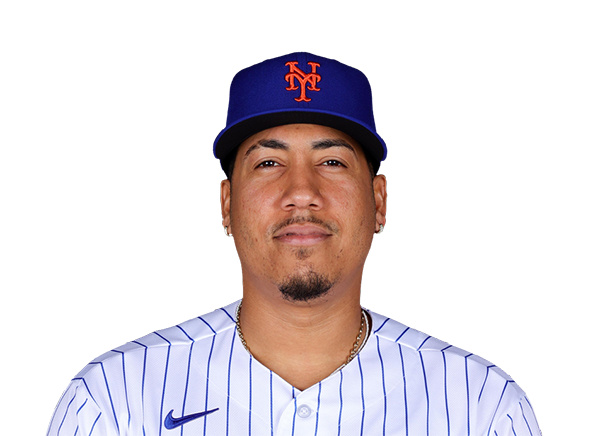 Dedniel Nunez | 1.0 | 0 | 0 | 0 | 0 | 1 | 0 | 11-7 | 5.23 | 11 |
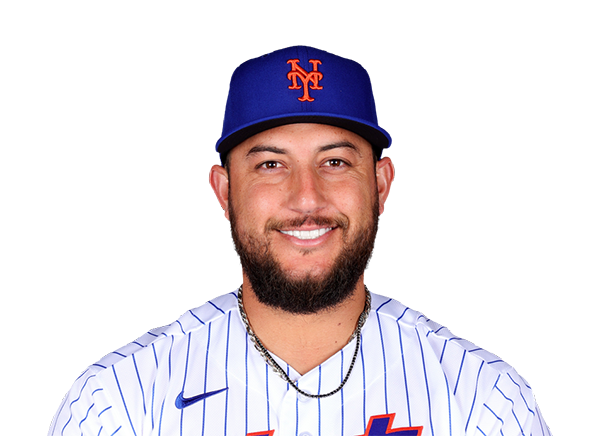 Daniel Duarte | 0.2 | 3 | 2 | 2 | 1 | 0 | 0 | 24-14 | 2.19 | 24 |
 Chris Devenski | 0.1 | 0 | 0 | 0 | 0 | 0 | 0 | 5-5 | 4.91 | 5 |
 Kodai Senga | 1.0 | 0 | 0 | 0 | 1 | 1 | 0 | 17-9 | 7.36 | 17 |
Tampa Bay Rays
| Player | IP | H | R | ER | BB | K | HR | PC-ST | ERA | PC |
|---|---|---|---|---|---|---|---|---|---|---|
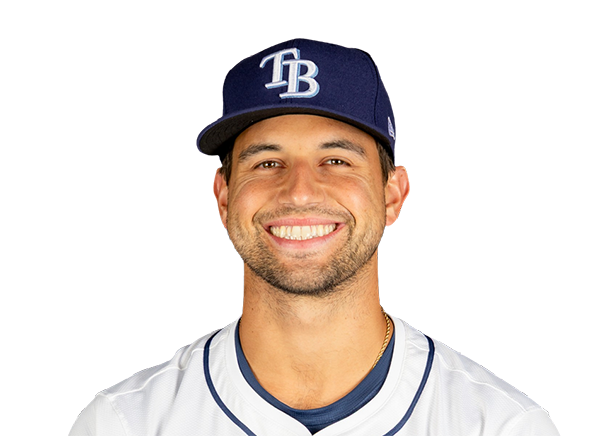 Ian Seymour | 6.1 | 6 | 3 | 3 | 0 | 10 | 1 | 88-65 | 4.21 | 88 |
 Casey Legumina | 0.2 | 2 | 0 | 0 | 0 | 0 | 0 | 15-9 | 3.73 | 15 |
 Garrett Cleavinger | 1.0 | 0 | 0 | 0 | 0 | 1 | 0 | 10-7 | 4.17 | 10 |
 Steven Matz | 1.0 | 2 | 0 | 0 | 0 | 1 | 0 | 22-16 | 5.90 | 22 |
H2H / Season Series
TB2–3
NYM
Last 5 Games
| Date | Opponent | Result |
|---|---|---|
| Aug 31 | @ TB | W3–2 |
| Aug 30 |  vs HOU | L3–6 |
| Aug 29 | vs HOU | W6–2 |
| Aug 28 | vs HOU | L1–3 |
| Aug 27 |  vs MIL | L2–8 |
| Date | Opponent | Result |
|---|---|---|
| Aug 31 | vs NYM | L2–3 |
| Aug 30 |  vs SD | W5–4 |
| Aug 29 | vs SD | W7–6 |
| Aug 28 | vs SD | W9–4 |
| Aug 26 |  @ DET | W3–0 |
Standings
American League
| Team | W | L | PCT | GB | DIFF | STRK |
|---|---|---|---|---|---|---|
| 1Rays | 82 | 55 | .599 | - | +53 | L1 |
2 White Sox | 72 | 65 | .526 | 10 | +41 | L2 |
| 3Astros | 70 | 68 | .507 | 12.5 | -40 | W2 |
4 Yankees | 78 | 60 | .565 | 4.5 | +108 | L1 |
5 Red Sox | 75 | 63 | .543 | 7.5 | +85 | W1 |
6 Guardians | 69 | 68 | .504 | 13 | -2 | W1 |
7 Orioles | 69 | 69 | .500 | 13.5 | -17 | W4 |
8 Rangers | 68 | 70 | .493 | 14.5 | -44 | W2 |
9 Blue Jays | 68 | 70 | .493 | 14.5 | -50 | W3 |
10 Twins | 66 | 72 | .478 | 16.5 | -46 | W2 |
11 Mariners | 64 | 74 | .464 | 18.5 | -73 | L5 |
| 12Tigers | 63 | 74 | .460 | 19 | +55 | L2 |
13 Royals | 62 | 76 | .449 | 20.5 | -83 | L1 |
14 Athletics | 53 | 85 | .384 | 29.5 | -198 | L4 |
15 Angels | 53 | 85 | .384 | 29.5 | -73 | W1 |
National League
| Team | W | L | PCT | GB | DIFF | STRK |
|---|---|---|---|---|---|---|
| 1Brewers | 85 | 53 | .616 | - | +163 | L2 |
2 Dodgers | 82 | 55 | .599 | 2.5 | +153 | W1 |
3 Braves | 82 | 56 | .594 | 3 | +113 | L1 |
4 Cubs | 78 | 60 | .565 | 7 | +141 | W1 |
5 Phillies | 78 | 60 | .565 | 7 | +31 | W5 |
| 6Padres | 73 | 65 | .529 | 12 | +15 | W1 |
7 Diamondbacks | 73 | 66 | .525 | 12.5 | +4 | L2 |
8 Marlins | 69 | 69 | .500 | 16 | +12 | L1 |
9 Cardinals | 68 | 70 | .493 | 17 | -15 | L2 |
10 Pirates | 67 | 71 | .486 | 18 | +26 | W2 |
11 Nationals | 66 | 74 | .471 | 20 | +19 | W1 |
12 Reds | 65 | 73 | .471 | 20 | -113 | L1 |
| 13Mets | 62 | 76 | .449 | 23 | -52 | W1 |
14 Giants | 57 | 81 | .413 | 28 | -70 | W2 |
15 Rockies | 52 | 86 | .377 | 33 | -143 | L5 |
NYM
VS
TB
Pitchers
Robert Stock
Catchers
Francisco Alvarez
Infielders
Francisco Lindor
Bo Bichette
Jared Young
Marcus Semien
Outfielders
Carson Benge
Christopher Morel
A.J. Ewing
Designated Hitters
Mark Vientos
Pitchers
Ian Seymour
Catchers
Liam Hicks
Infielders
Jonathan Aranda
Junior Caminero
Richie Palacios
Taylor Walls
Outfielders
Chandler Simpson
Cedric Mullins
Jonny DeLuca
Designated Hitters
Yandy Diaz
Mets
VS
Rays
Batting
138
Team Games Played
137
4637
At Bats
4602
1094
Hits
1197
539
Runs Batted In
586
166
Home Runs
142
73
Stolen Bases
137
.236
Batting Average
.260
565
Runs
618
175
Doubles
190
18
Triples
20
1803
Total Bases
1853
435
Walks
441
1175
Strikeouts
959
.305
On Base Percentage
.329
.389
Slugging Percentage
.403
.694
OBP Pct + SLG Pct
.732
138
Games Played
137
138
Games Started
137
42
Hit By Pitch
50
0.0
Wins Above Replacement
0.0
0.0
Offensive Wins Above Replacement
0.0
29
Caught Stealing
48
1
Is Qualified
1
552.5
Runs Created
620.0
4.0
Runs Created Per 27 Outs
4.6
.084
Walks Per Plate Appearance
.085
0.37
Walk To Strikeout Ratio
0.46
.153
Isolated Power
.143
.256
Secondary Average
.258
3.94
Pitches Per Plate Appearance
3.78
359
Extra Base Hits
352
5166
Plate Appearances
5173
27.9
At Bats Per Home Run
32.4
17
Sacrifice Hit
40
31
Sacrifice Flies
37
Pitching
138
Team Games Played
137
40
Quality Starts
45
62
Wins
82
76
Losses
55
26
Saves
54
63
Holds
104
1107
Hits
1061
556
Earned runs
512
151
Home Runs
171
491
Walks
341
1234
Strikeouts
1123
9.0
Strikeouts Per 9 Innings
8.3
148.9
Pitches Per Start
139.4
1.30
Walks Plus Hits Per Inning Pitched
1.15
4.07
Earned Run Average
3.76
76
Losses
55
1229.2
Innings pitched
1224.0
.449
Win Percentage
.599
43
Save Opportunities
69
.238
Opponent Batting Average
.231
.318
Opponent's On-base pct.
.289
.392
Opponent's Slugging pct.
.394
.710
Opponent's OPB Pct + SLG Pct
.682
4656
At Bats
4594
226
Doubles
206
20
Triples
14
70
Batters Hit
49
63
Stolen Bases
114
138
Games Played
137
0
Complete Games
1
5
Shutouts
12
33
Wild Pitches
36
590
Runs Batted In
538
3
Balks
3
1229.2
Innings pitched
1224.0
9.0
Strikeouts Per 9 Innings
8.3
28
Caught Stealing
31
138
Games Started
137
0.0
Wins Above Replacement
0.0
1
Is Qualified
1
617
Runs
565
556
Earned Runs
512
1826
Total Bases
1808
Fielding
138
Team Games Played
137
1230
Full Innings
1224
4860
Total Chances
4834
3689
Putouts
3672
1087
Assists
1080
84
Errors
82
175
Double Plays
190
0.983
Fielding Percentage
0.983
35.0
Range Factor
34.9
0.0
Zone Rating
0.0
138
Games Played
137
0
Games Started
0
0.0
Defensive Wins Above Replacement
0.0
1
Qualified
1