

Mets vs Yankees Live Score (12 Sep, 2026)
Game Information
Stage
STD
Season
2026
First Pitch
Sat, Sep 12, 1:35 pm
Venue
Yankee Stadium
Location
Bronx, New York
Venue Type
Outdoor
Broadcast
MLB.TV
Attendance
46,864
Live Situation
2Balls
3Strikes
0Outs
—Pitcher
—At Bat
Pitch Sequence
1
STRIKE FOUL
Cutter
85 MPH
2
BALL
Splitter
78 MPH
3
BALL
Slider
85 MPH
4
STRIKE SWINGING
Four-seam FB
92 MPH
5
STRIKE SWINGING
Four-seam FB
92 MPH
Injury Report


Team Stats
 NYM
NYY


12
Runs
2
14
Hits
7
0
Errors
0
6
Home Runs
1
2
Walks
1
7
Strikeouts
6
Player Box Score
New York Mets
| Player | H-AB | AB | R | H | RBI | HR | BB | K | #P | AVG | OBP | SLG |
|---|---|---|---|---|---|---|---|---|---|---|---|---|
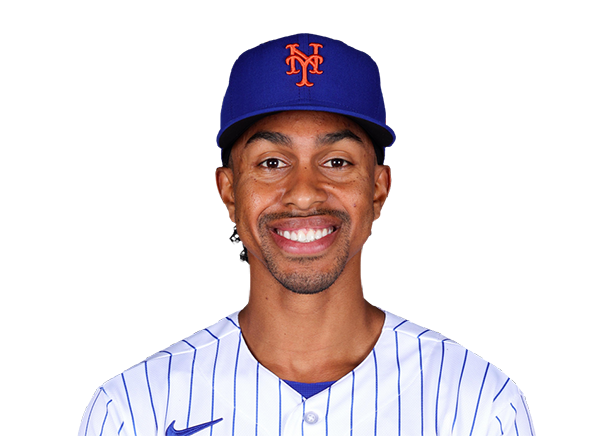 Francisco Lindor | 3-5 | 5 | 2 | 3 | 5 | 2 | 0 | 1 | 17 | .234 | .316 | .448 |
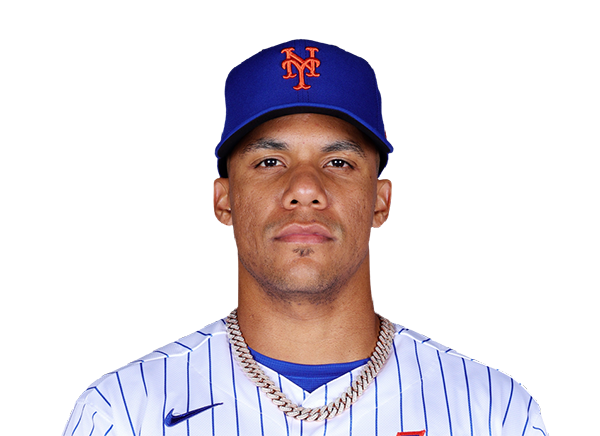 Juan Soto | 2-5 | 5 | 2 | 2 | 1 | 1 | 0 | 1 | 28 | .275 | .394 | .533 |
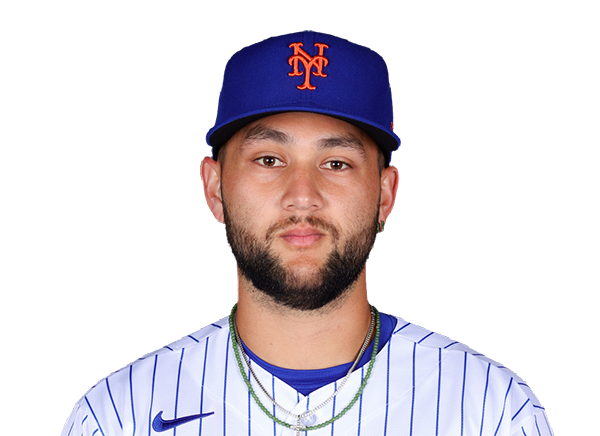 Bo Bichette | 0-5 | 5 | 0 | 0 | 0 | 0 | 0 | 1 | 11 | .263 | .314 | .394 |
 Carson Benge | 2-5 | 5 | 1 | 2 | 2 | 1 | 0 | 1 | 15 | .273 | .337 | .414 |
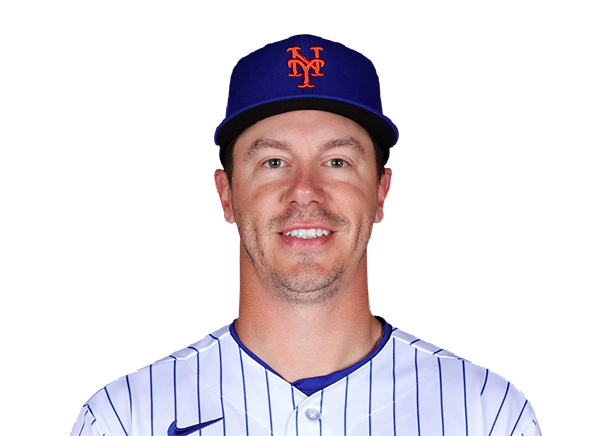 Jared Young | 3-5 | 5 | 2 | 3 | 1 | 1 | 0 | 0 | 15 | .272 | .333 | .439 |
 Marcus Semien | 1-5 | 5 | 1 | 1 | 0 | 0 | 0 | 0 | 21 | .219 | .284 | .345 |
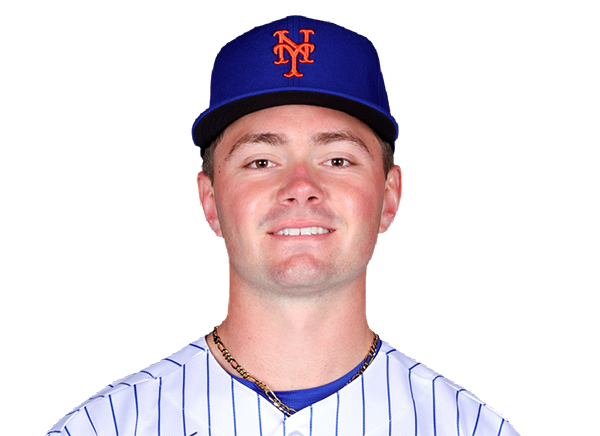 A.J. Ewing | 0-3 | 3 | 1 | 0 | 0 | 0 | 1 | 2 | 17 | .253 | .323 | .376 |
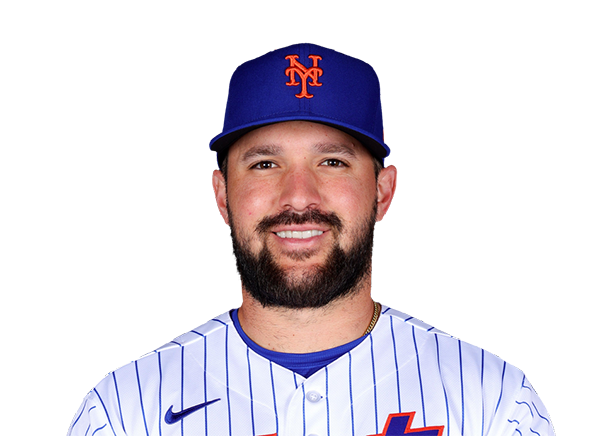 Luis Torrens | 2-4 | 4 | 2 | 2 | 3 | 1 | 0 | 1 | 21 | .245 | .306 | .418 |
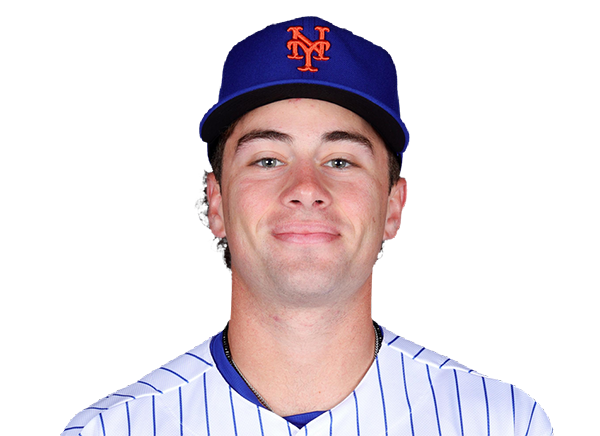 Nick Morabito | 1-3 | 3 | 1 | 1 | 0 | 0 | 1 | 0 | 15 | .192 | .323 | .231 |
New York Yankees
| Player | H-AB | AB | R | H | RBI | HR | BB | K | #P | AVG | OBP | SLG |
|---|---|---|---|---|---|---|---|---|---|---|---|---|
 Paul Goldschmidt | 1-4 | 4 | 1 | 1 | 0 | 0 | 0 | 0 | 15 | .252 | .314 | .458 |
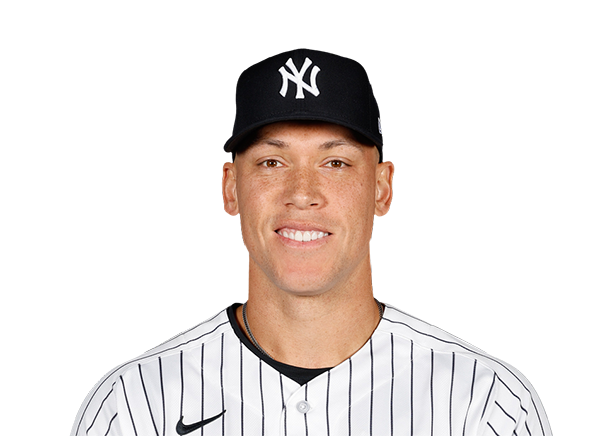 Aaron Judge | 0-4 | 4 | 0 | 0 | 0 | 0 | 0 | 1 | 10 | .246 | .369 | .513 |
 Cody Bellinger | 2-4 | 4 | 1 | 2 | 2 | 1 | 0 | 0 | 12 | .271 | .346 | .439 |
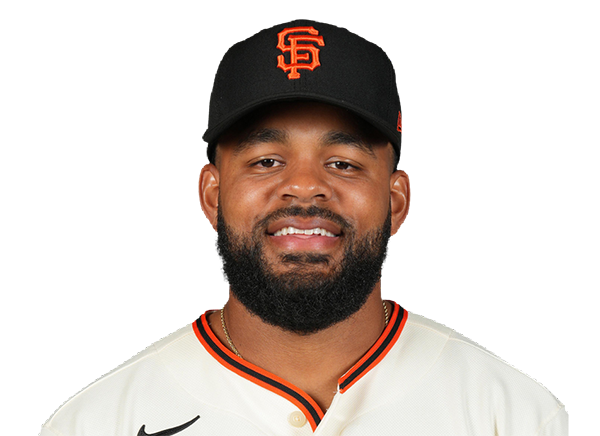 Heliot Ramos | 1-4 | 4 | 0 | 1 | 0 | 0 | 0 | 2 | 10 | .242 | .301 | .399 |
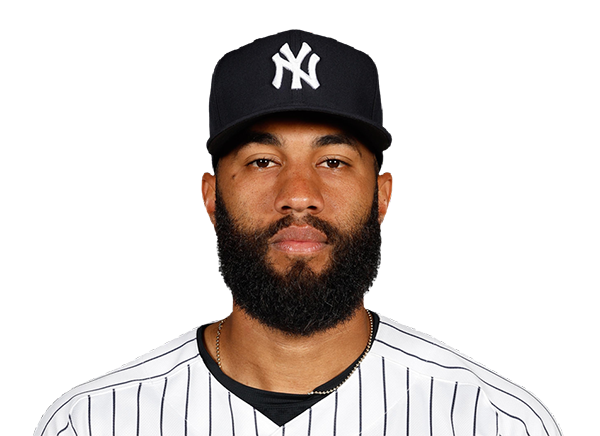 Amed Rosario | 0-4 | 4 | 0 | 0 | 0 | 0 | 0 | 0 | 10 | .234 | .277 | .411 |
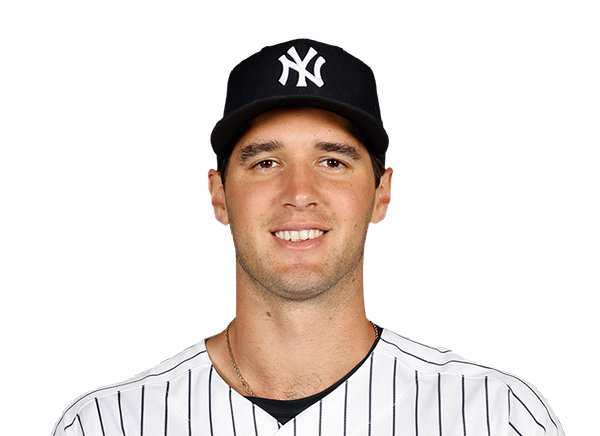 Spencer Jones | 2-4 | 4 | 0 | 2 | 0 | 0 | 0 | 2 | 14 | .264 | .339 | .454 |
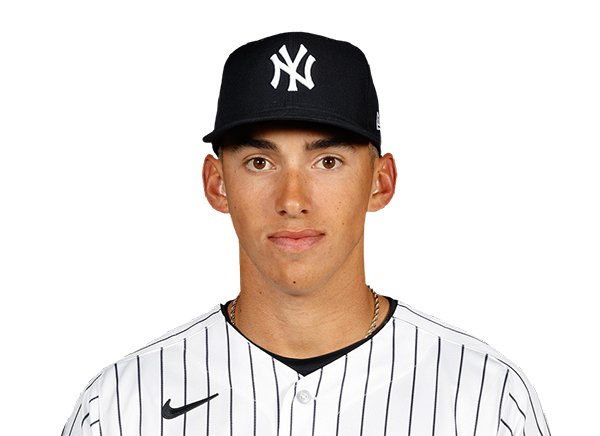 George Lombard Jr. | 0-3 | 3 | 0 | 0 | 0 | 0 | 1 | 1 | 23 | .217 | .280 | .340 |
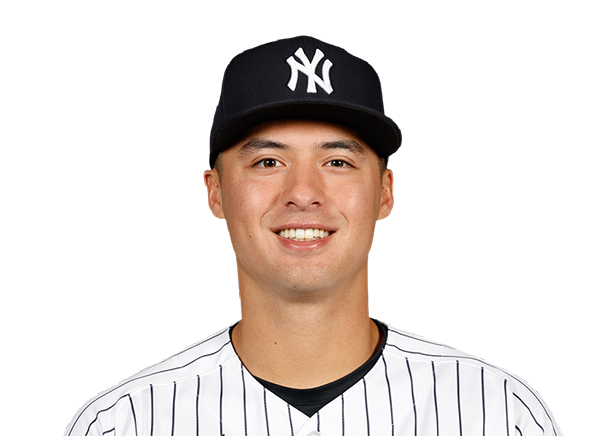 Anthony Volpe | 0-3 | 3 | 0 | 0 | 0 | 0 | 0 | 0 | 7 | .247 | .327 | .341 |
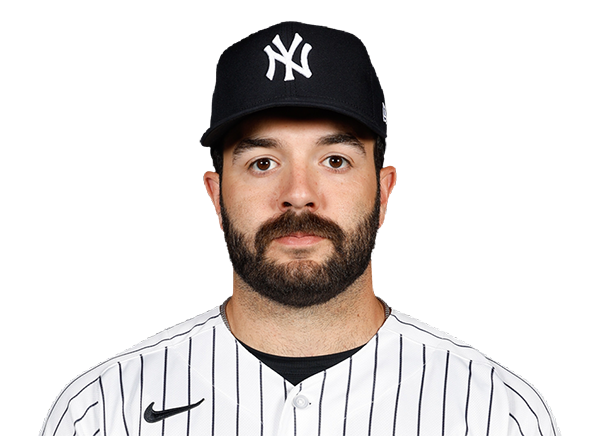 Austin Wells | 0-2 | 2 | 0 | 0 | 0 | 0 | 0 | 0 | 2 | .177 | .278 | .297 |
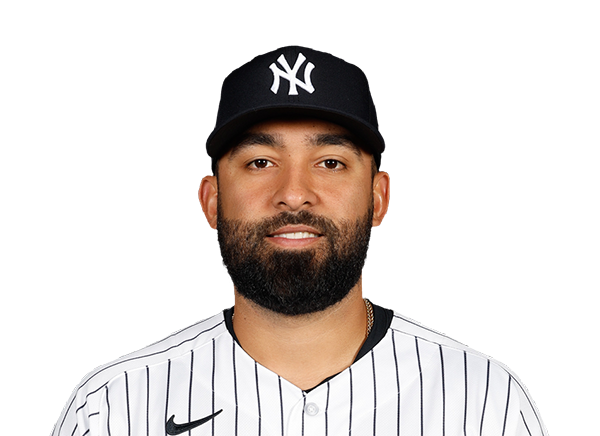 Ali Sanchez | 1-1 | 1 | 0 | 1 | 0 | 0 | 0 | 0 | 3 | .246 | .274 | .319 |
New York Mets
| Player | IP | H | R | ER | BB | K | HR | PC-ST | ERA | PC |
|---|---|---|---|---|---|---|---|---|---|---|
 Zac Thornton | 7.0 | 5 | 2 | 2 | 1 | 4 | 1 | 81-61 | 3.44 | 81 |
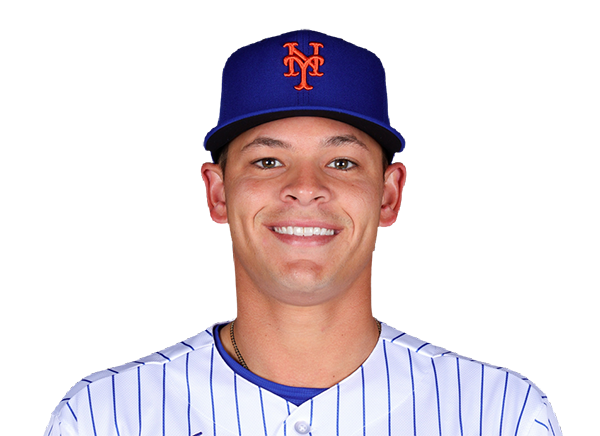 Tobias Myers | 2.0 | 2 | 0 | 0 | 0 | 2 | 0 | 25-19 | 5.80 | 25 |
New York Yankees
| Player | IP | H | R | ER | BB | K | HR | PC-ST | ERA | PC |
|---|---|---|---|---|---|---|---|---|---|---|
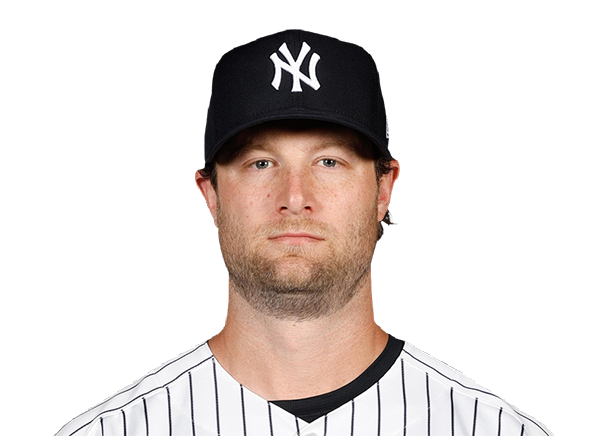 Gerrit Cole | 4.1 | 9 | 5 | 5 | 0 | 4 | 3 | 77-53 | 3.67 | 77 |
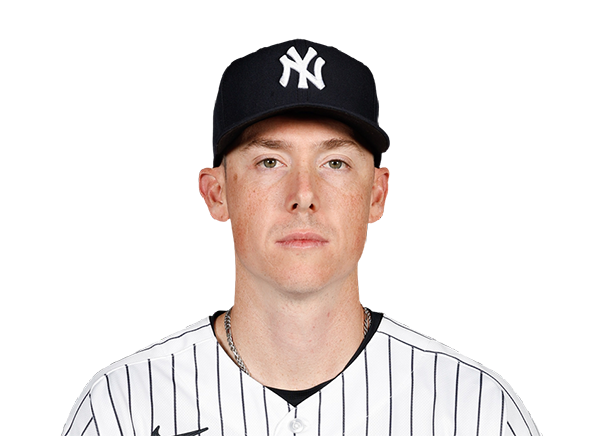 Ryan Yarbrough | 2.1 | 0 | 0 | 0 | 0 | 1 | 0 | 27-19 | 3.81 | 27 |
 Tim Hill | 1.0 | 2 | 3 | 3 | 1 | 1 | 1 | 29-19 | 4.72 | 29 |
 Bradley Hanner | 1.1 | 3 | 4 | 4 | 1 | 1 | 2 | 27-17 | 11.81 | 27 |
H2H / Season Series
NYY2–12
NYM
NYY6–4
NYM
NYM7–6
NYY
NYM6–3
NYY
NYM2–5
NYY
NYM10–4
NYY
NYY4–6
NYM
Last 5 Games
| Date | Opponent | Result |
|---|---|---|
| Sep 12 | @ NYY | W12–2 |
| Sep 11 | @ NYY | L4–6 |
| Sep 9 |  @ MIA | W15–14 |
| Sep 8 | @ MIA | W7–5 |
| Sep 7 | @ MIA | W9–4 |
| Date | Opponent | Result |
|---|---|---|
| Sep 12 | vs NYM | L2–12 |
| Sep 11 | vs NYM | W6–4 |
| Sep 10 |  vs COL | W10–3 |
| Sep 9 | vs COL | W6–1 |
| Sep 8 | vs COL | W5–3 |
Standings
American League
| Team | W | L | PCT | GB | DIFF | STRK |
|---|---|---|---|---|---|---|
1 Rays | 89 | 59 | .601 | - | +59 | W2 |
2 White Sox | 76 | 72 | .514 | 13 | +36 | W1 |
3 Astros | 75 | 74 | .503 | 14.5 | -43 | L2 |
| 4Yankees | 85 | 63 | .574 | 4 | +123 | L1 |
5 Red Sox | 81 | 68 | .544 | 8.5 | +85 | W1 |
6 Guardians | 75 | 74 | .503 | 14.5 | -14 | L1 |
7 Blue Jays | 74 | 75 | .497 | 15.5 | -38 | W1 |
8 Rangers | 73 | 76 | .490 | 16.5 | -45 | W1 |
9 Orioles | 72 | 77 | .483 | 17.5 | -28 | L1 |
10 Twins | 70 | 78 | .473 | 19 | -55 | W1 |
11 Mariners | 70 | 79 | .470 | 19.5 | -57 | W1 |
12 Tigers | 69 | 79 | .466 | 20 | +63 | W3 |
13 Royals | 66 | 83 | .443 | 23.5 | -91 | L1 |
14 Athletics | 60 | 89 | .403 | 29.5 | -204 | L1 |
15 Angels | 56 | 92 | .378 | 33 | -75 | L2 |
National League
| Team | W | L | PCT | GB | DIFF | STRK |
|---|---|---|---|---|---|---|
1 Brewers | 93 | 56 | .624 | - | +196 | W5 |
2 Dodgers | 90 | 58 | .608 | 2.5 | +172 | L1 |
3 Braves | 88 | 61 | .591 | 5 | +121 | W3 |
4 Cubs | 83 | 66 | .557 | 10 | +139 | W2 |
5 Phillies | 82 | 67 | .550 | 11 | +26 | L3 |
6 Padres | 80 | 68 | .541 | 12.5 | +20 | W6 |
7 Diamondbacks | 79 | 70 | .530 | 14 | +3 | L1 |
8 Pirates | 74 | 75 | .497 | 19 | +25 | L2 |
| 9Marlins | 73 | 76 | .490 | 20 | +4 | W1 |
10 Cardinals | 73 | 76 | .490 | 20 | -9 | L1 |
11 Reds | 69 | 79 | .466 | 23.5 | -146 | L5 |
| 12Mets | 69 | 79 | .466 | 23.5 | -32 | W1 |
13 Nationals | 69 | 81 | .460 | 24.5 | +2 | W2 |
14 Giants | 62 | 87 | .416 | 31 | -75 | L2 |
| 15Rockies | 55 | 93 | .372 | 37.5 | -162 | L6 |
NYM
VS
NYY
Pitchers
Zac Thornton
Catchers
Luis Torrens
Infielders
Francisco Lindor
Bo Bichette
Jared Young
Marcus Semien
Outfielders
Carson Benge
A.J. Ewing
Nick Morabito
Designated Hitters
Juan Soto
Pitchers
Gerrit Cole
Catchers
Austin Wells
Infielders
Paul Goldschmidt
Amed Rosario
George Lombard Jr.
Anthony Volpe
Outfielders
Cody Bellinger
Heliot Ramos
Spencer Jones
Designated Hitters
Aaron Judge
Mets
VS
Yankees
Batting
148
Team Games Played
148
4992
At Bats
4890
1192
Hits
1150
614
Runs Batted In
644
188
Home Runs
202
80
Stolen Bases
140
.239
Batting Average
.235
643
Runs
675
191
Doubles
212
18
Triples
17
1983
Total Bases
2002
477
Walks
529
1248
Strikeouts
1353
.309
On Base Percentage
.312
.397
Slugging Percentage
.409
.706
OBP Pct + SLG Pct
.722
148
Games Played
148
148
Games Started
148
47
Hit By Pitch
37
0.0
Wins Above Replacement
0.0
0.0
Offensive Wins Above Replacement
0.0
32
Caught Stealing
47
1
Is Qualified
1
617.9
Runs Created
641.3
4.2
Runs Created Per 27 Outs
4.4
.086
Walks Per Plate Appearance
.096
0.38
Walk To Strikeout Ratio
0.39
.158
Isolated Power
.174
.264
Secondary Average
.301
3.93
Pitches Per Plate Appearance
3.98
397
Extra Base Hits
431
5572
Plate Appearances
5509
26.6
At Bats Per Home Run
24.2
18
Sacrifice Hit
10
34
Sacrifice Flies
38
Pitching
148
Team Games Played
148
42
Quality Starts
59
69
Wins
85
79
Losses
63
29
Saves
42
68
Holds
84
1211
Hits
1100
614
Earned runs
479
166
Home Runs
154
510
Walks
446
1317
Strikeouts
1329
9.0
Strikeouts Per 9 Innings
9.0
148.5
Pitches Per Start
145.0
1.31
Walks Plus Hits Per Inning Pitched
1.17
4.19
Earned Run Average
3.26
79
Losses
63
1317.2
Innings pitched
1323.0
.466
Win Percentage
.574
47
Save Opportunities
69
.242
Opponent Batting Average
.224
.319
Opponent's On-base pct.
.293
.398
Opponent's Slugging pct.
.368
.717
Opponent's OPB Pct + SLG Pct
.661
5012
At Bats
4921
242
Doubles
205
23
Triples
22
74
Batters Hit
54
63
Stolen Bases
66
148
Games Played
148
0
Complete Games
0
5
Shutouts
13
34
Wild Pitches
32
648
Runs Batted In
527
3
Balks
3
1317.2
Innings pitched
1323.0
9.0
Strikeouts Per 9 Innings
9.0
29
Caught Stealing
20
148
Games Started
148
0.0
Wins Above Replacement
0.0
1
Is Qualified
1
675
Runs
552
614
Earned Runs
479
1997
Total Bases
1811
Fielding
148
Team Games Played
148
1318
Full Innings
1323
5197
Total Chances
5334
3953
Putouts
3969
1155
Assists
1279
89
Errors
86
191
Double Plays
212
0.983
Fielding Percentage
0.984
34.9
Range Factor
35.7
0.0
Zone Rating
0.0
148
Games Played
148
0
Games Started
0
0.0
Defensive Wins Above Replacement
0.0
1
Qualified
1