

Nationals vs Braves Live Score (22 May, 2026)
Game Information
Stage
Standard
Season
2026
First Pitch
Fri, May 22, 7:15 pm
Venue
Truist Park
Location
Atlanta, Georgia
Attendance
36,082
Live Situation
2Balls
2Strikes
0Outs
—Pitcher
—At Bat
Pitch Sequence
1
BALL
Cutter
87 MPH
2
BALL
Cutter
87 MPH
3
STRIKE FOUL
Four-seam FB
93 MPH
4
STRIKE FOUL
Cutter
88 MPH
5
BALL IN PLAY
Four-seam FB
93 MPH
Injury Report

Team Stats
 WSH
ATL


4
Runs
5
10
Hits
11
0
Errors
0
2
Home Runs
0
2
Walks
3
8
Strikeouts
8
Player Box Score
Washington Nationals
| Player | H-AB | AB | R | H | RBI | HR | BB | K | #P | AVG | OBP | SLG |
|---|---|---|---|---|---|---|---|---|---|---|---|---|
 James Wood | 1-4 | 4 | 1 | 1 | 0 | 0 | 1 | 1 | 25 | .254 | .390 | .517 |
 Luis Garcia Jr. | 0-4 | 4 | 0 | 0 | 0 | 0 | 0 | 1 | 15 | .253 | .280 | .396 |
 Andres Chaparro | 0-0 | 0 | 1 | 0 | 0 | 0 | 1 | 0 | 7 | .167 | .375 | .250 |
 Curtis Mead | 2-5 | 5 | 1 | 2 | 1 | 1 | 0 | 1 | 20 | .234 | .354 | .449 |
 CJ Abrams | 2-5 | 5 | 1 | 2 | 3 | 1 | 0 | 0 | 16 | .299 | .391 | .556 |
 Dylan Crews | 1-5 | 5 | 0 | 1 | 0 | 0 | 0 | 1 | 16 | .188 | .235 | .188 |
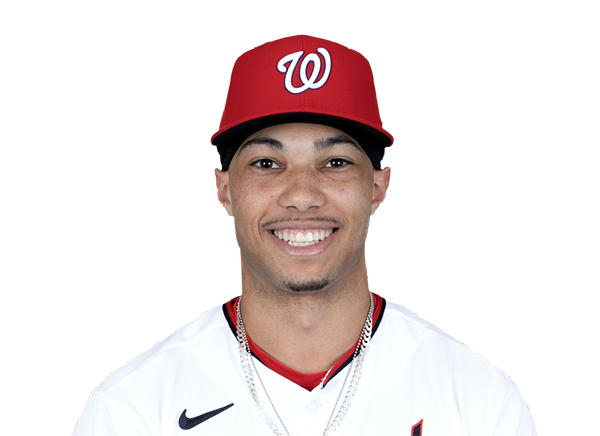 Daylen Lile | 1-5 | 5 | 0 | 1 | 0 | 0 | 0 | 0 | 22 | .267 | .322 | .437 |
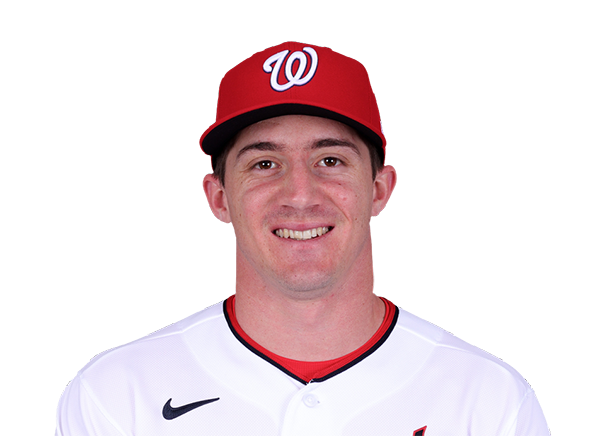 Jacob Young | 1-3 | 3 | 0 | 1 | 0 | 0 | 0 | 1 | 11 | .229 | .281 | .373 |
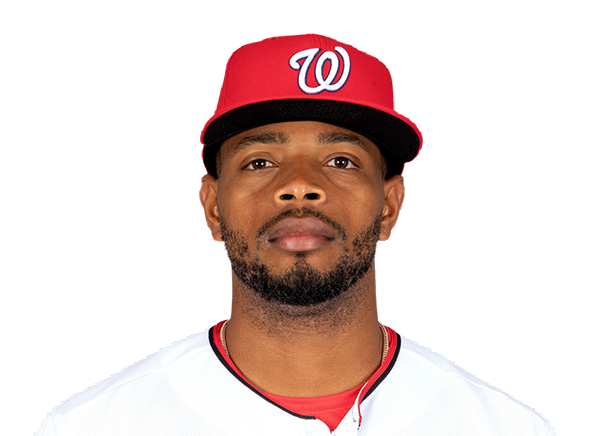 Jose Tena | 0-1 | 1 | 0 | 0 | 0 | 0 | 0 | 0 | 4 | .242 | .301 | .432 |
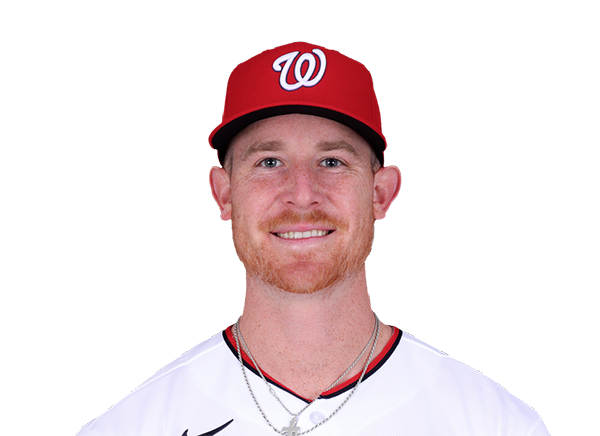 Clayton Beeter | 0-0 | 0 | 0 | 0 | 0 | 0 | 0 | 0 | 0 | .000 | .000 | .000 |
 Gus Varland | 0-0 | 0 | 0 | 0 | 0 | 0 | 0 | 0 | 0 | .000 | .000 | .000 |
 Orlando Ribalta | 0-0 | 0 | 0 | 0 | 0 | 0 | 0 | 0 | 0 | .000 | .000 | .000 |
 Jorbit Vivas | 0-1 | 1 | 0 | 0 | 0 | 0 | 0 | 1 | 4 | .237 | .324 | .301 |
 Paxton Schultz | 0-0 | 0 | 0 | 0 | 0 | 0 | 0 | 0 | 0 | .000 | .000 | .000 |
 Drew Millas | 1-5 | 5 | 0 | 1 | 0 | 0 | 0 | 1 | 13 | .173 | .256 | .247 |
 Nasim Nunez | 1-5 | 5 | 0 | 1 | 0 | 0 | 0 | 1 | 23 | .189 | .297 | .209 |
Atlanta Braves
| Player | H-AB | AB | R | H | RBI | HR | BB | K | #P | AVG | OBP | SLG |
|---|---|---|---|---|---|---|---|---|---|---|---|---|
 Ronald Acuna Jr. | 0-4 | 4 | 0 | 0 | 0 | 0 | 1 | 0 | 24 | .254 | .365 | .373 |
 Mauricio Dubon | 3-5 | 5 | 0 | 3 | 1 | 0 | 0 | 1 | 15 | .269 | .321 | .407 |
 Matt Olson | 0-5 | 5 | 0 | 0 | 0 | 0 | 0 | 1 | 21 | .267 | .345 | .554 |
 Ozzie Albies | 0-4 | 4 | 0 | 0 | 0 | 0 | 1 | 0 | 21 | .270 | .330 | .430 |
 Michael Harris II | 1-5 | 5 | 1 | 1 | 0 | 0 | 0 | 1 | 16 | .295 | .320 | .514 |
 Austin Riley | 3-3 | 3 | 1 | 3 | 0 | 0 | 1 | 0 | 15 | .221 | .292 | .385 |
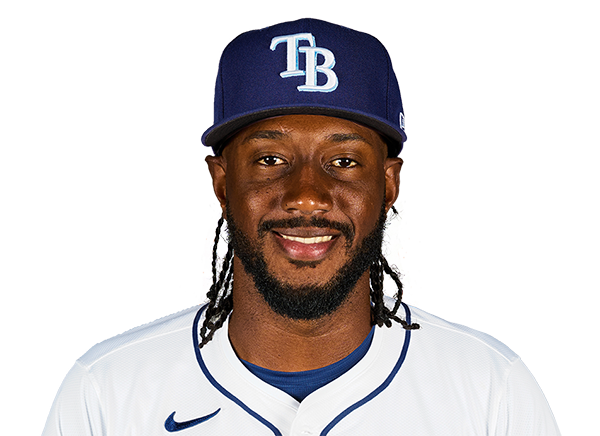 Jorge Mateo | 0-0 | 0 | 0 | 0 | 0 | 0 | 0 | 0 | 0 | .305 | .349 | .458 |
 Eli White | 0-1 | 1 | 1 | 0 | 0 | 0 | 0 | 0 | 4 | .242 | .273 | .403 |
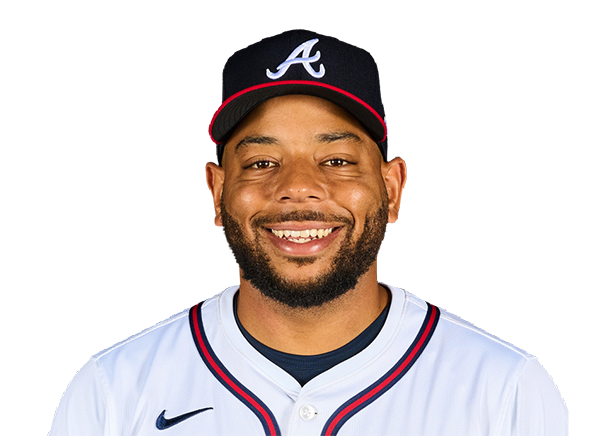 Dominic Smith | 1-5 | 5 | 0 | 1 | 1 | 0 | 0 | 1 | 18 | .336 | .360 | .533 |
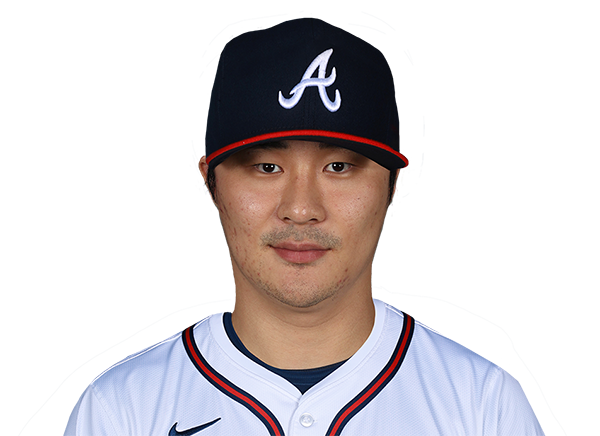 Ha-Seong Kim | 1-5 | 5 | 1 | 1 | 1 | 0 | 0 | 2 | 23 | .129 | .229 | .129 |
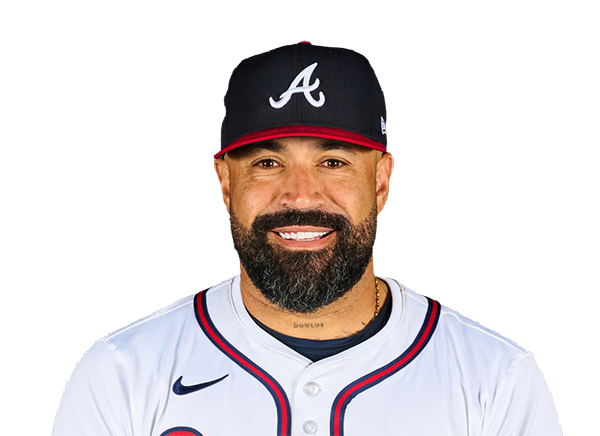 Sandy Leon | 0-1 | 1 | 0 | 0 | 0 | 0 | 0 | 0 | 2 | .125 | .125 | .125 |
 Mike Yastrzemski | 0-1 | 1 | 0 | 0 | 0 | 0 | 0 | 1 | 5 | .232 | .303 | .362 |
 Chadwick Tromp | 2-3 | 3 | 1 | 2 | 2 | 0 | 0 | 1 | 11 | .571 | .571 | .571 |
Washington Nationals
| Player | IP | H | R | ER | BB | K | HR | PC-ST | ERA | PC |
|---|---|---|---|---|---|---|---|---|---|---|
 Richard Lovelady | 1.0 | 1 | 0 | 0 | 0 | 0 | 0 | 12-9 | 2.49 | 12 |
 Miles Mikolas | 5.0 | 3 | 0 | 0 | 0 | 3 | 0 | 66-42 | 6.17 | 66 |
 Mitchell Parker | 1.0 | 3 | 2 | 2 | 1 | 1 | 0 | 31-20 | 5.25 | 31 |
|
Clayton Beeter | 1.0 | 0 | 0 | 0 | 0 | 2 | 0 | 17-11 | 2.92 | 17 |
|
Gus Varland | 1.0 | 1 | 0 | 0 | 0 | 1 | 0 | 12-10 | 3.66 | 12 |
|
Orlando Ribalta | 1.0 | 2 | 2 | 1 | 2 | 0 | 0 | 23-12 | 2.45 | 23 |
|
Paxton Schultz | 0.2 | 1 | 1 | 0 | 0 | 1 | 0 | 14-9 | 5.30 | 14 |
Atlanta Braves
| Player | IP | H | R | ER | BB | K | HR | PC-ST | ERA | PC |
|---|---|---|---|---|---|---|---|---|---|---|
 Bryce Elder | 6.0 | 5 | 1 | 1 | 1 | 4 | 1 | 87-58 | 1.97 | 87 |
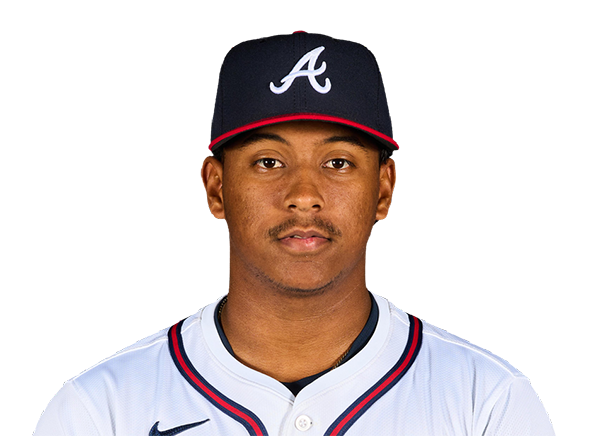 Didier Fuentes | 1.0 | 2 | 0 | 0 | 0 | 1 | 0 | 27-20 | 2.79 | 27 |
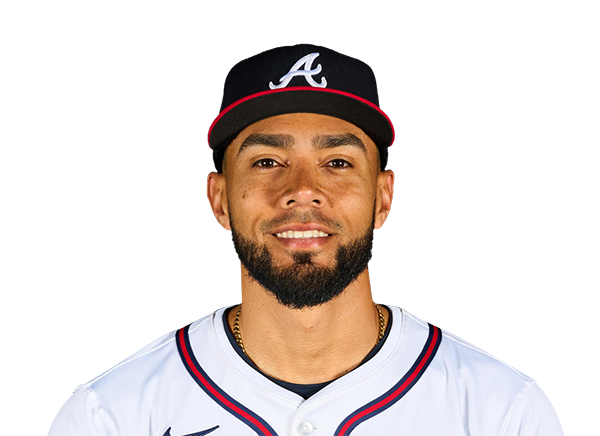 Robert Suarez | 1.0 | 2 | 1 | 1 | 0 | 0 | 1 | 20-14 | 0.81 | 20 |
 Raisel Iglesias | 1.0 | 0 | 0 | 0 | 0 | 1 | 0 | 10-8 | 0.00 | 10 |
 Dylan Lee | 1.0 | 1 | 2 | 1 | 1 | 0 | 0 | 21-13 | 1.11 | 21 |
 Tyler Kinley | 1.0 | 0 | 0 | 0 | 0 | 2 | 0 | 11-7 | 3.74 | 11 |
H2H / Season Series
ATL4–2
WSH
ATL8–3
WSH
ATL6–2
WSH
ATL5–4
WSH
ATL1–2
WSH
ATL0–2
WSH
ATL5–4
WSH
WSH2–7
ATL
WSH6–8
ATL
WSH11–4
ATL
Last 5 Games
| Date | Opponent | Result |
|---|---|---|
| Aug 22 |  @ MIA | L2–4 |
| Aug 21 | @ MIA | L2–3 |
| Aug 20 |  @ TEX | L0–2 |
| Aug 19 | @ TEX | W6–0 |
| Aug 18 | @ TEX | L0–5 |
| Date | Opponent | Result |
|---|---|---|
| Aug 22 |  @ MIL | L1–4 |
| Aug 21 | @ MIL | L1–2 |
| Aug 20 |  @ CHW | W2–0 |
| Aug 19 |  @ MIN | L4–6 |
| Aug 18 | @ MIN | L1–4 |
Standings
American League
| Team | W | L | PCT | GB | DIFF | STRK |
|---|---|---|---|---|---|---|
1 Rays | 76 | 52 | .594 | - | +43 | L2 |
| 2White Sox | 67 | 61 | .523 | 9 | +47 | W1 |
3 Astros | 65 | 64 | .504 | 11.5 | -42 | W1 |
4 Yankees | 73 | 56 | .566 | 3.5 | +95 | L1 |
5 Red Sox | 69 | 59 | .539 | 7 | +97 | W1 |
| 6Rangers | 64 | 65 | .496 | 12.5 | -45 | W2 |
7 Blue Jays | 64 | 67 | .489 | 13.5 | -50 | W1 |
| 8Twins | 63 | 66 | .488 | 13.5 | -45 | L1 |
9 Guardians | 63 | 66 | .488 | 13.5 | -15 | W2 |
10 Orioles | 62 | 67 | .481 | 14.5 | -34 | W1 |
11 Tigers | 61 | 67 | .477 | 15 | +79 | L3 |
12 Mariners | 61 | 68 | .473 | 15.5 | -45 | W1 |
13 Royals | 56 | 74 | .431 | 21 | -97 | W6 |
14 Angels | 51 | 78 | .395 | 25.5 | -71 | L1 |
15 Athletics | 49 | 80 | .380 | 27.5 | -189 | L5 |
National League
| Team | W | L | PCT | GB | DIFF | STRK |
|---|---|---|---|---|---|---|
| 1Brewers | 81 | 49 | .623 | - | +163 | W3 |
2 Dodgers | 78 | 51 | .605 | 2.5 | +146 | W4 |
| 3Braves | 75 | 55 | .577 | 6 | +108 | L2 |
4 Cubs | 74 | 55 | .574 | 6.5 | +99 | L2 |
5 Phillies | 72 | 58 | .554 | 9 | +25 | W8 |
6 Padres | 69 | 60 | .535 | 11.5 | +7 | W1 |
7 Diamondbacks | 68 | 61 | .527 | 12.5 | +13 | W2 |
| 8Marlins | 66 | 64 | .508 | 15 | +17 | W2 |
9 Cardinals | 66 | 65 | .504 | 15.5 | 0 | L2 |
10 Pirates | 63 | 67 | .485 | 18 | +30 | L1 |
11 Reds | 61 | 68 | .473 | 19.5 | -98 | L2 |
| 12Nationals | 61 | 70 | .466 | 20.5 | +14 | L3 |
13 Mets | 58 | 71 | .450 | 22.5 | -44 | L1 |
14 Giants | 52 | 76 | .406 | 28 | -78 | L2 |
15 Rockies | 50 | 78 | .391 | 30 | -130 | L4 |
WSH
VS
ATL
Pitchers
Clayton Beeter
Gus Varland
Orlando Ribalta
Paxton Schultz
Richard Lovelady
Miles Mikolas
Mitchell Parker
Catchers
Drew Millas
Infielders
Luis Garcia Jr.
Andres Chaparro
Curtis Mead
CJ Abrams
Nasim Nunez
Outfielders
James Wood
Dylan Crews
Daylen Lile
Jacob Young
Other Players
Jose Tena
Jorbit Vivas
Pitchers
Bryce Elder
Didier Fuentes
Robert Suarez
Raisel Iglesias
Dylan Lee
Tyler Kinley
Catchers
Sandy Leon
Chadwick Tromp
Infielders
Mauricio Dubon
Matt Olson
Ozzie Albies
Austin Riley
Ha-Seong Kim
Outfielders
Ronald Acuna Jr.
Michael Harris II
Eli White
Designated Hitters
Dominic Smith
Other Players
Jorge Mateo
Mike Yastrzemski
Nationals
VS
Braves
Batting
130
Team Games Played
129
4450
At Bats
4363
1110
Hits
1074
649
Runs Batted In
584
183
Home Runs
167
139
Stolen Bases
63
.249
Batting Average
.246
678
Runs
609
218
Doubles
206
26
Triples
9
1929
Total Bases
1799
449
Walks
375
1088
Strikeouts
1046
.325
On Base Percentage
.310
.433
Slugging Percentage
.412
.758
OBP Pct + SLG Pct
.723
130
Games Played
129
130
Games Started
129
63
Hit By Pitch
48
0.0
Wins Above Replacement
0.0
0.0
Offensive Wins Above Replacement
0.0
31
Caught Stealing
21
1
Is Qualified
1
647.9
Runs Created
570.3
5.0
Runs Created Per 27 Outs
4.5
.090
Walks Per Plate Appearance
.078
0.41
Walk To Strikeout Ratio
0.36
.184
Isolated Power
.166
.309
Secondary Average
.262
3.81
Pitches Per Plate Appearance
3.88
427
Extra Base Hits
382
5009
Plate Appearances
4833
24.3
At Bats Per Home Run
26.1
15
Sacrifice Hit
7
29
Sacrifice Flies
37
Pitching
130
Team Games Played
129
29
Quality Starts
49
61
Wins
75
69
Losses
54
33
Saves
39
67
Holds
92
1143
Hits
983
599
Earned runs
462
178
Home Runs
145
459
Walks
439
999
Strikeouts
1101
7.8
Strikeouts Per 9 Innings
8.7
150.6
Pitches Per Start
144.4
1.39
Walks Plus Hits Per Inning Pitched
1.24
4.67
Earned Run Average
3.63
69
Losses
54
1155.0
Innings pitched
1145.0
.469
Win Percentage
.581
66
Save Opportunities
56
.257
Opponent Batting Average
.230
.333
Opponent's On-base pct.
.307
.429
Opponent's Slugging pct.
.378
.761
Opponent's OPB Pct + SLG Pct
.685
4444
At Bats
4270
207
Doubles
162
11
Triples
17
66
Batters Hit
45
93
Stolen Bases
95
130
Games Played
129
0
Complete Games
0
5
Shutouts
8
46
Wild Pitches
26
639
Runs Batted In
478
1
Balks
4
1155.0
Innings pitched
1145.0
7.8
Strikeouts Per 9 Innings
8.7
28
Caught Stealing
17
130
Games Started
129
0.0
Wins Above Replacement
0.0
1
Is Qualified
1
662
Runs
498
599
Earned Runs
462
1906
Total Bases
1614
Fielding
130
Team Games Played
129
1155
Full Innings
1145
4737
Total Chances
4538
3465
Putouts
3435
1182
Assists
1045
90
Errors
58
218
Double Plays
206
0.981
Fielding Percentage
0.987
36.2
Range Factor
35.2
0.0
Zone Rating
0.0
130
Games Played
129
0
Games Started
0
0.0
Defensive Wins Above Replacement
0.0
1
Qualified
1