

Nationals vs Cardinals Live Score (19 Sep, 2026)
Game Information
Stage
STD
Season
2026
First Pitch
Sat, Sep 19, 7:15 pm
Venue
Busch Stadium
Location
St. Louis, Missouri
Venue Type
Outdoor
Broadcast
MLB.TV
Attendance
29,774
Live Situation
0Balls
1Strikes
0Outs
—Pitcher
—At Bat
Pitch Sequence
1
STRIKE LOOKING
Four-seam FB
90 MPH
2
BALL IN PLAY
Four-seam FB
92 MPH
Injury Report



Team Stats
 WSH
STL


8
Runs
5
12
Hits
14
4
Errors
2
1
Home Runs
0
4
Walks
2
8
Strikeouts
13
Player Box Score
Washington Nationals
| Player | H-AB | AB | R | H | RBI | HR | BB | K | #P | AVG | OBP | SLG |
|---|---|---|---|---|---|---|---|---|---|---|---|---|
 James Wood | 2-5 | 5 | 1 | 2 | 0 | 0 | 0 | 1 | 31 | .267 | .392 | .517 |
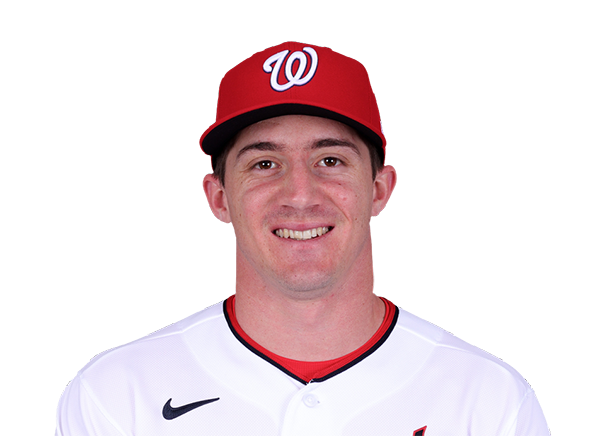 Jacob Young | 0-0 | 0 | 1 | 0 | 1 | 0 | 0 | 0 | 4 | .248 | .317 | .389 |
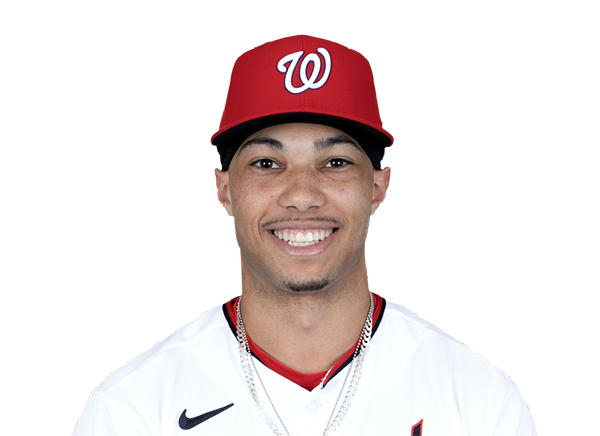 Daylen Lile | 1-6 | 6 | 1 | 1 | 2 | 1 | 0 | 3 | 20 | .249 | .302 | .438 |
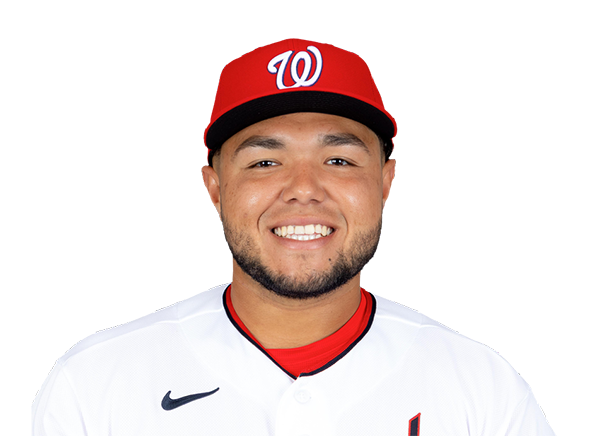 Abimelec Ortiz | 0-3 | 3 | 0 | 0 | 0 | 0 | 0 | 0 | 14 | .200 | .244 | .367 |
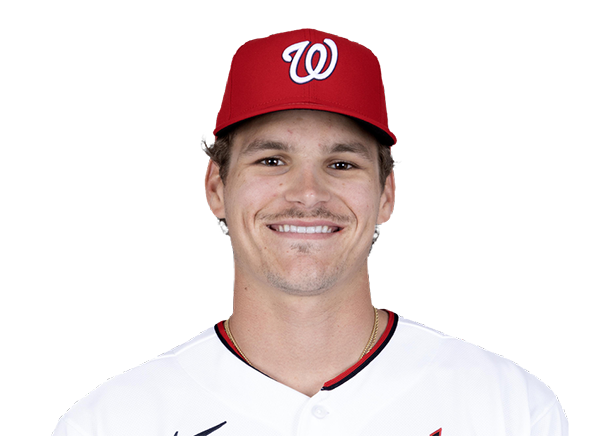 Brady House | 0-0 | 0 | 0 | 0 | 0 | 0 | 1 | 0 | 6 | .239 | .303 | .395 |
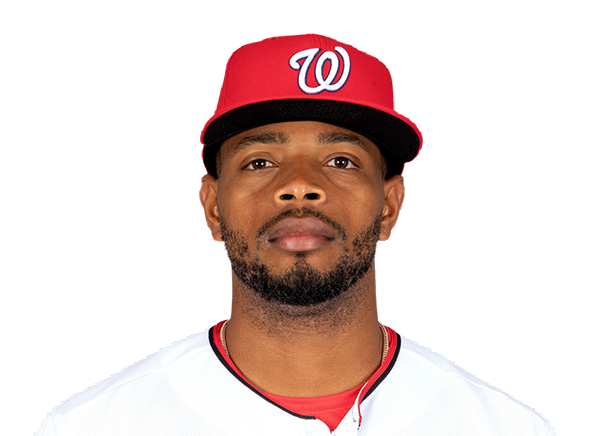 Jose Tena | 1-2 | 2 | 1 | 1 | 2 | 0 | 0 | 0 | 8 | .223 | .303 | .371 |
 CJ Abrams | 0-5 | 5 | 0 | 0 | 0 | 0 | 1 | 0 | 25 | .261 | .337 | .488 |
 Dylan Crews | 1-5 | 5 | 0 | 1 | 1 | 0 | 0 | 1 | 21 | .224 | .289 | .375 |
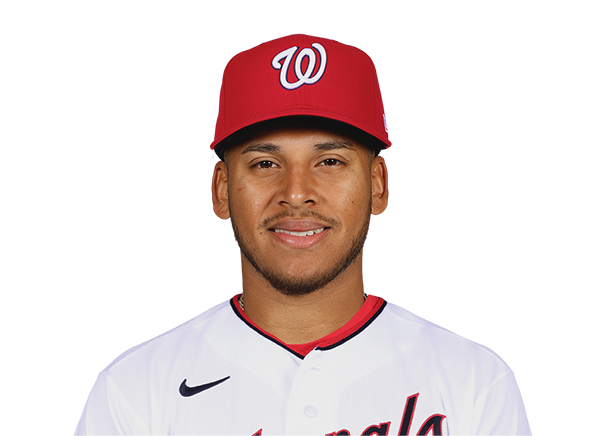 Jorbit Vivas | 4-6 | 6 | 1 | 4 | 1 | 0 | 0 | 1 | 33 | .248 | .341 | .336 |
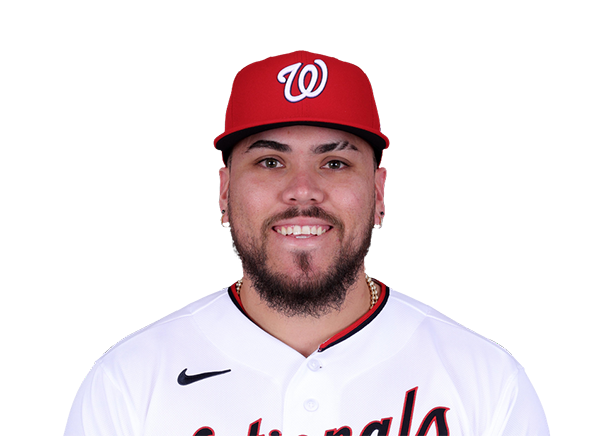 Andres Chaparro | 1-3 | 3 | 0 | 1 | 0 | 0 | 1 | 0 | 20 | .260 | .362 | .514 |
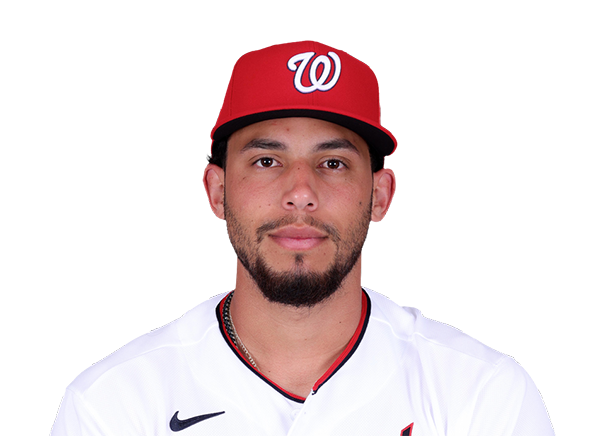 Yohandy Morales | 0-1 | 1 | 1 | 0 | 0 | 0 | 0 | 1 | 6 | .286 | .286 | .571 |
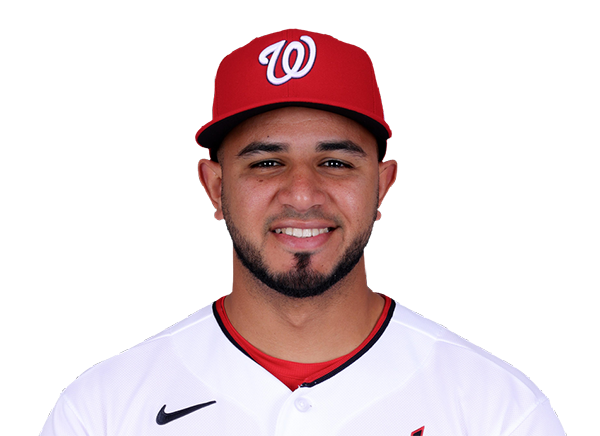 Keibert Ruiz | 1-5 | 5 | 0 | 1 | 0 | 0 | 0 | 0 | 10 | .286 | .324 | .456 |
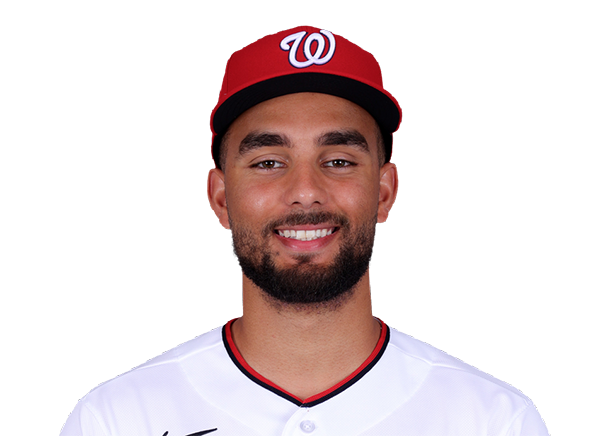 Harry Ford | 0-0 | 0 | 1 | 0 | 0 | 0 | 0 | 0 | 0 | .185 | .306 | .348 |
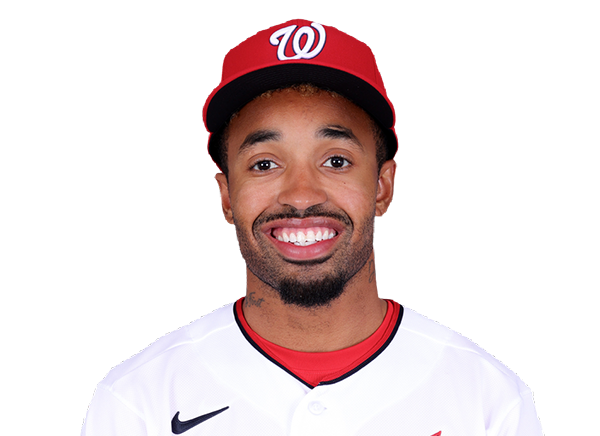 Nasim Nunez | 1-4 | 4 | 1 | 1 | 1 | 0 | 1 | 1 | 24 | .211 | .293 | .245 |
St. Louis Cardinals
| Player | H-AB | AB | R | H | RBI | HR | BB | K | #P | AVG | OBP | SLG |
|---|---|---|---|---|---|---|---|---|---|---|---|---|
 Jose Fermin | 3-5 | 5 | 0 | 3 | 1 | 0 | 1 | 0 | 30 | .247 | .311 | .356 |
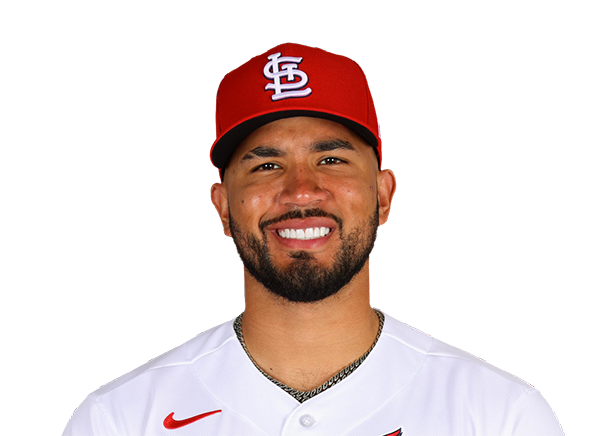 Ivan Herrera | 3-5 | 5 | 0 | 3 | 0 | 0 | 0 | 1 | 21 | .245 | .358 | .377 |
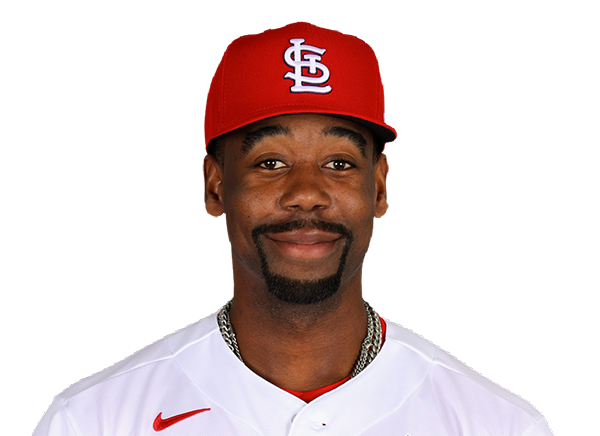 Jordan Walker | 0-6 | 6 | 0 | 0 | 0 | 0 | 0 | 4 | 23 | .276 | .333 | .476 |
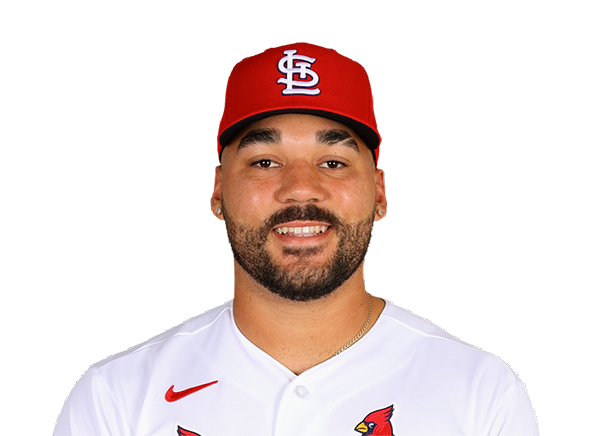 Leo Bernal | 1-6 | 6 | 1 | 1 | 0 | 0 | 0 | 2 | 17 | .310 | .347 | .479 |
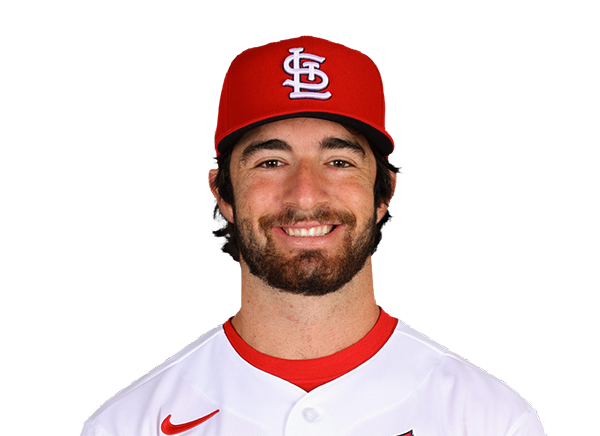 Thomas Saggese | 0-4 | 4 | 0 | 0 | 0 | 0 | 1 | 2 | 21 | .254 | .310 | .387 |
 Masyn Winn | 1-5 | 5 | 1 | 1 | 1 | 0 | 0 | 1 | 19 | .235 | .309 | .320 |
 Nathan Church | 2-5 | 5 | 2 | 2 | 0 | 0 | 0 | 0 | 16 | .254 | .299 | .375 |
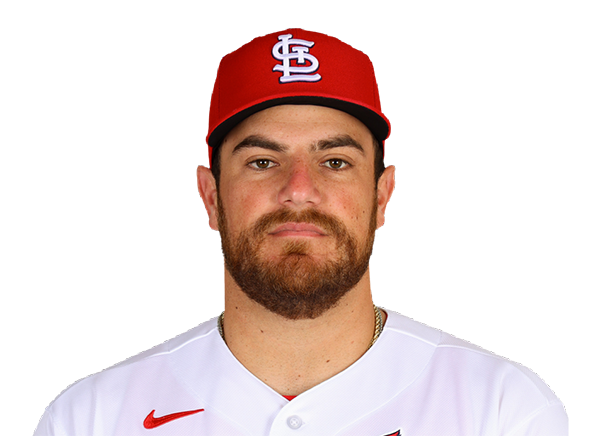 Pedro Pages | 2-4 | 4 | 1 | 2 | 1 | 0 | 0 | 1 | 20 | .215 | .267 | .312 |
 JJ Wetherholt | 1-1 | 1 | 0 | 1 | 1 | 0 | 0 | 0 | 2 | .242 | .342 | .368 |
 Victor Scott II | 0-3 | 3 | 0 | 0 | 0 | 0 | 0 | 1 | 9 | .190 | .269 | .252 |
 Alec Burleson | 1-2 | 2 | 0 | 1 | 0 | 0 | 0 | 1 | 9 | .284 | .349 | .469 |
Washington Nationals
| Player | IP | H | R | ER | BB | K | HR | PC-ST | ERA | PC |
|---|---|---|---|---|---|---|---|---|---|---|
 Andrew Alvarez | 6.0 | 5 | 0 | 0 | 1 | 8 | 0 | 92-61 | 3.17 | 92 |
 Richard Lovelady | 0.2 | 2 | 2 | 0 | 0 | 1 | 0 | 23-19 | 3.86 | 23 |
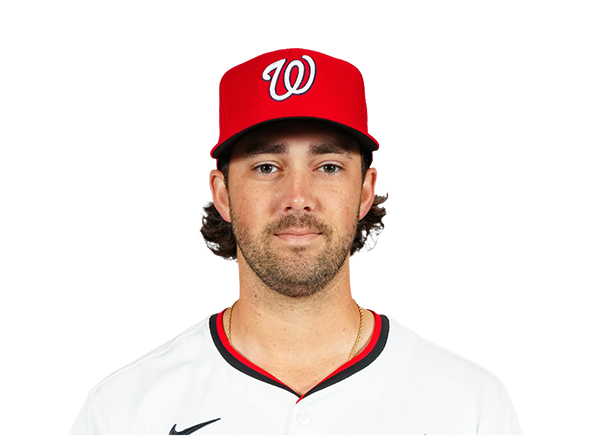 Jack Sinclair | 1.1 | 1 | 0 | 0 | 0 | 0 | 0 | 13-10 | 2.35 | 13 |
 Erik Tolman | 0.1 | 3 | 1 | 1 | 0 | 1 | 0 | 14-11 | 3.09 | 14 |
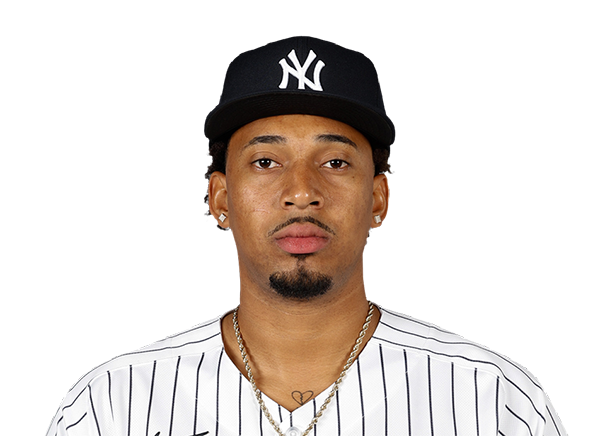 Yovanny Cruz | 0.2 | 0 | 0 | 0 | 0 | 1 | 0 | 10-6 | 4.05 | 10 |
 Riley Cornelio | 1.2 | 3 | 2 | 0 | 1 | 2 | 0 | 33-21 | 4.22 | 33 |
 Will Dion | 0.1 | 0 | 0 | 0 | 0 | 0 | 0 | 2-2 | 3.89 | 2 |
St. Louis Cardinals
| Player | IP | H | R | ER | BB | K | HR | PC-ST | ERA | PC |
|---|---|---|---|---|---|---|---|---|---|---|
 Michael McGreevy | 4.0 | 5 | 2 | 2 | 1 | 1 | 1 | 88-56 | 3.84 | 88 |
 Justin Bruihl | 1.1 | 1 | 1 | 1 | 0 | 1 | 0 | 28-19 | 3.60 | 28 |
 Luis Gastelum | 0.1 | 2 | 0 | 0 | 0 | 0 | 0 | 12-7 | 4.59 | 12 |
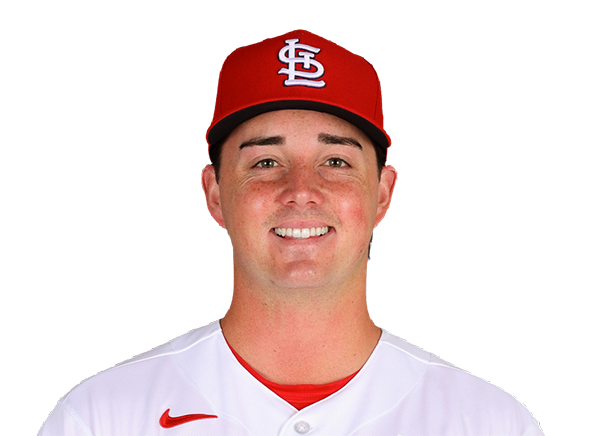 Brycen Mautz | 1.2 | 1 | 0 | 0 | 1 | 2 | 0 | 29-18 | 6.92 | 29 |
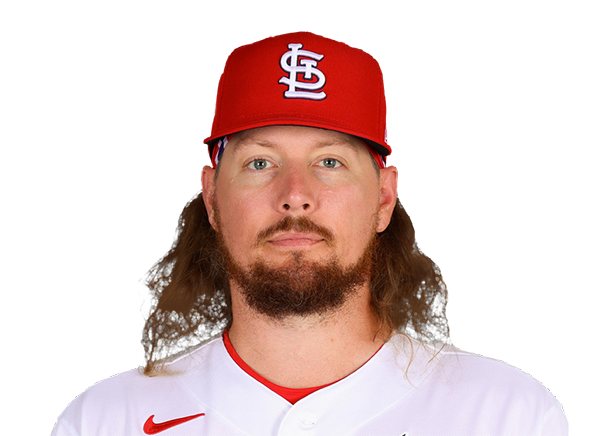 Ryne Stanek | 0.2 | 0 | 0 | 0 | 0 | 0 | 0 | 3-2 | 4.15 | 3 |
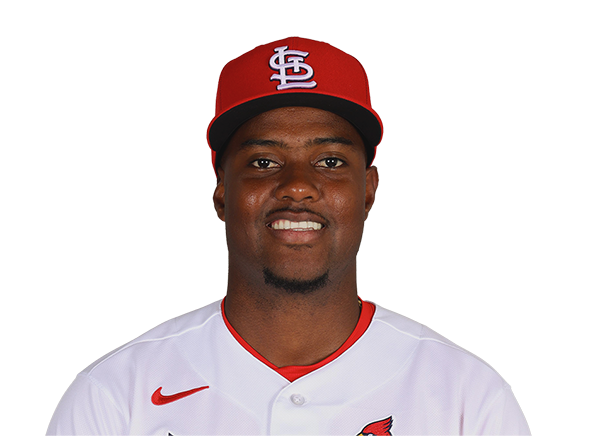 George Soriano | 1.0 | 0 | 0 | 0 | 0 | 1 | 0 | 16-9 | 4.29 | 16 |
 Riley O'Brien | 1.0 | 1 | 1 | 0 | 0 | 2 | 0 | 12-9 | 4.14 | 12 |
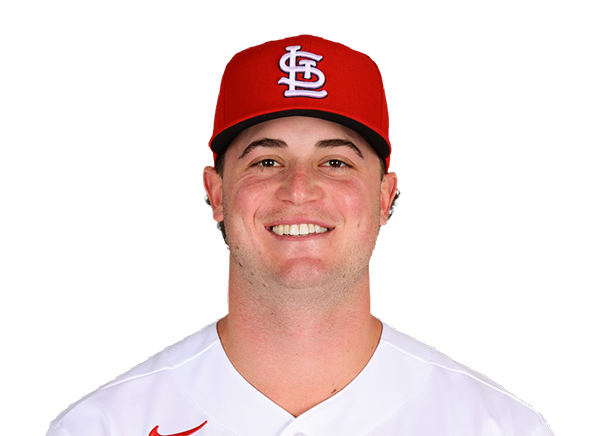 Gordon Graceffo | 1.0 | 2 | 4 | 2 | 2 | 1 | 0 | 34-21 | 2.76 | 34 |
H2H / Season Series
STL5–8
WSH
STL1–9
WSH
WSH1–6
STL
WSH6–7
STL
WSH9–6
STL
STL5–1
WSH
WSH1–0
STL
STL6–3
WSH
WSH3–1
STL
WSH6–1
STL
Last 5 Games
| Date | Opponent | Result |
|---|---|---|
| Sep 19 | @ STL | W8–5 |
| Sep 18 | @ STL | W9–1 |
| Sep 16 |  vs PHI | L0–3 |
| Sep 15 | vs PHI | W6–3 |
| Sep 13 |  vs LAA | W6–5 |
| Date | Opponent | Result |
|---|---|---|
| Sep 19 | vs WSH | L5–8 |
| Sep 18 | vs WSH | L1–9 |
| Sep 16 |  vs SF | L5–6 |
| Sep 15 | vs SF | L3–10 |
| Sep 14 | vs SF | W2–1 |
Standings
American League
| Team | W | L | PCT | GB | DIFF | STRK |
|---|---|---|---|---|---|---|
1 Rays | 94 | 60 | .610 | - | +79 | W1 |
2 Guardians | 80 | 75 | .516 | 14.5 | +1 | W4 |
3 Rangers | 78 | 77 | .503 | 16.5 | -29 | W2 |
4 Yankees | 89 | 65 | .578 | 5 | +141 | L1 |
5 Red Sox | 84 | 71 | .542 | 10.5 | +84 | L1 |
6 White Sox | 79 | 76 | .510 | 15.5 | +35 | W1 |
7 Astros | 77 | 78 | .497 | 17.5 | -57 | L2 |
8 Blue Jays | 76 | 79 | .490 | 18.5 | -47 | L2 |
9 Orioles | 75 | 80 | .484 | 19.5 | -28 | L2 |
10 Tigers | 73 | 82 | .471 | 21.5 | +75 | L1 |
11 Mariners | 72 | 83 | .465 | 22.5 | -57 | L1 |
12 Twins | 72 | 83 | .465 | 22.5 | -72 | L1 |
13 Royals | 67 | 88 | .432 | 27.5 | -101 | L3 |
14 Athletics | 61 | 94 | .394 | 33.5 | -222 | L5 |
| 15Angels | 60 | 95 | .387 | 34.5 | -79 | W1 |
National League
| Team | W | L | PCT | GB | DIFF | STRK |
|---|---|---|---|---|---|---|
1 Brewers | 97 | 58 | .626 | - | +199 | W2 |
2 Dodgers | 95 | 60 | .613 | 2 | +191 | W3 |
3 Braves | 91 | 64 | .587 | 6 | +118 | W2 |
4 Cubs | 86 | 69 | .555 | 11 | +144 | W1 |
5 Padres | 86 | 69 | .555 | 11 | +37 | W4 |
| 6Phillies | 85 | 70 | .548 | 12 | +24 | L2 |
7 Diamondbacks | 81 | 74 | .523 | 16 | -5 | W1 |
8 Pirates | 78 | 77 | .503 | 19 | +28 | W3 |
9 Marlins | 76 | 79 | .490 | 21 | +1 | L2 |
| 10Cardinals | 75 | 80 | .484 | 22 | -25 | L4 |
| 11Nationals | 73 | 82 | .471 | 24 | +14 | W2 |
12 Reds | 72 | 83 | .465 | 25 | -155 | L1 |
13 Mets | 71 | 84 | .458 | 26 | -36 | W2 |
| 14Giants | 64 | 91 | .413 | 33 | -82 | L2 |
15 Rockies | 57 | 98 | .368 | 40 | -176 | W1 |
WSH
VS
STL
Pitchers
Andrew Alvarez
Catchers
Keibert Ruiz
Infielders
CJ Abrams
Jorbit Vivas
Andres Chaparro
Nasim Nunez
Outfielders
James Wood
Daylen Lile
Dylan Crews
Designated Hitters
Abimelec Ortiz
Pitchers
Michael McGreevy
Catchers
Pedro Pages
Infielders
Jose Fermin
Leo Bernal
Thomas Saggese
Masyn Winn
Outfielders
Jordan Walker
Nathan Church
Victor Scott II
Designated Hitters
Ivan Herrera
Nationals
VS
Cardinals
Batting
155
Team Games Played
155
5287
At Bats
5241
1308
Hits
1271
753
Runs Batted In
676
202
Home Runs
158
170
Stolen Bases
97
.247
Batting Average
.243
795
Runs
699
275
Doubles
224
30
Triples
14
2249
Total Bases
1997
538
Walks
494
1295
Strikeouts
1226
.323
On Base Percentage
.316
.425
Slugging Percentage
.381
.748
OBP Pct + SLG Pct
.697
155
Games Played
155
155
Games Started
155
68
Hit By Pitch
93
0.0
Wins Above Replacement
0.0
0.0
Offensive Wins Above Replacement
0.0
38
Caught Stealing
25
1
Is Qualified
1
753.8
Runs Created
645.3
4.9
Runs Created Per 27 Outs
4.2
.090
Walks Per Plate Appearance
.084
0.42
Walk To Strikeout Ratio
0.40
.178
Isolated Power
.139
.305
Secondary Average
.247
3.83
Pitches Per Plate Appearance
3.86
507
Extra Base Hits
396
5952
Plate Appearances
5904
26.2
At Bats Per Home Run
33.2
19
Sacrifice Hit
19
36
Sacrifice Flies
55
Pitching
155
Team Games Played
155
36
Quality Starts
52
73
Wins
75
82
Losses
80
38
Saves
45
76
Holds
95
1333
Hits
1338
712
Earned runs
662
204
Home Runs
154
575
Walks
542
1219
Strikeouts
1230
8.0
Strikeouts Per 9 Innings
8.0
150.9
Pitches Per Start
150.4
1.39
Walks Plus Hits Per Inning Pitched
1.36
4.66
Earned Run Average
4.30
82
Losses
80
1376.0
Innings pitched
1384.2
.471
Win Percentage
.484
79
Save Opportunities
75
.253
Opponent Batting Average
.254
.333
Opponent's On-base pct.
.330
.420
Opponent's Slugging pct.
.399
.753
Opponent's OPB Pct + SLG Pct
.728
5266
At Bats
5267
244
Doubles
273
12
Triples
14
80
Batters Hit
74
114
Stolen Bases
114
155
Games Played
155
0
Complete Games
1
5
Shutouts
9
59
Wild Pitches
60
749
Runs Batted In
687
1
Balks
3
1376.0
Innings pitched
1384.2
8.0
Strikeouts Per 9 Innings
8.0
33
Caught Stealing
27
155
Games Started
155
0.0
Wins Above Replacement
0.0
1
Is Qualified
1
781
Runs
724
712
Earned Runs
662
2213
Total Bases
2101
Fielding
155
Team Games Played
155
1376
Full Innings
1385
5630
Total Chances
5681
4128
Putouts
4154
1400
Assists
1454
102
Errors
73
275
Double Plays
224
0.982
Fielding Percentage
0.987
36.2
Range Factor
36.5
0.0
Zone Rating
0.0
155
Games Played
155
0
Games Started
0
0.0
Defensive Wins Above Replacement
0.0
1
Qualified
1