

Nationals vs Cardinals Live Score (20 Sep, 2026)
Game Information
Stage
STD
Season
2026
First Pitch
Sun, Sep 20, 2:15 pm
Venue
Busch Stadium
Location
St. Louis, Missouri
Venue Type
Outdoor
Broadcast
MLB.TV
Attendance
27,814
Live Situation
0Balls
0Strikes
0Outs
—Pitcher
—At Bat
Pitch Sequence
1
BALL IN PLAY
Sweeper
80 MPH
Injury Report
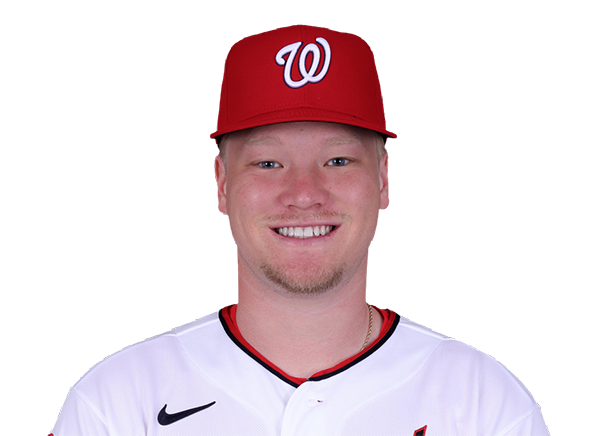
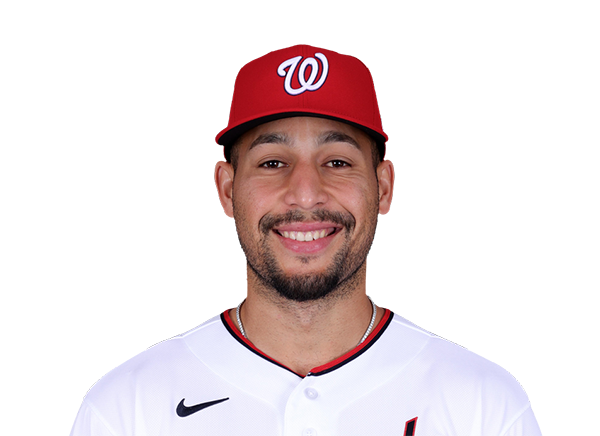
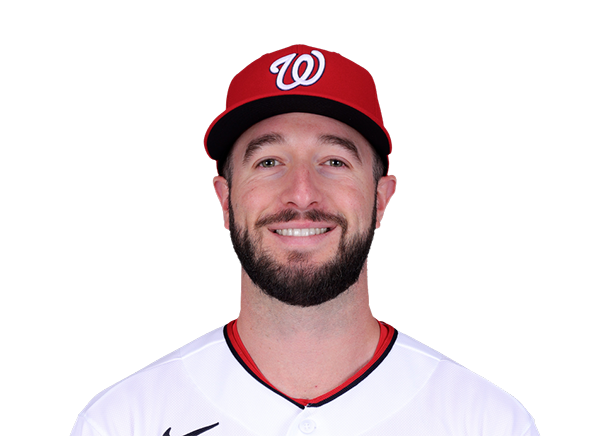
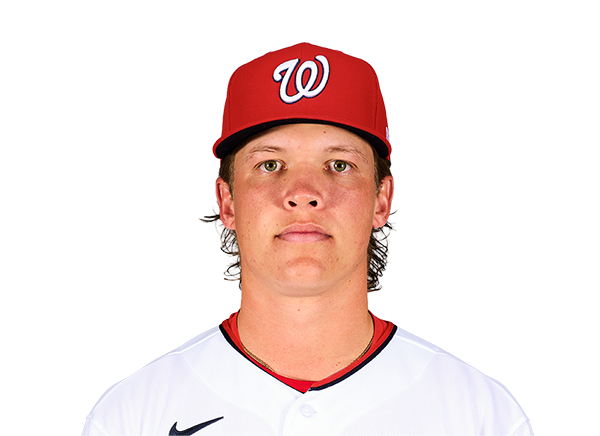



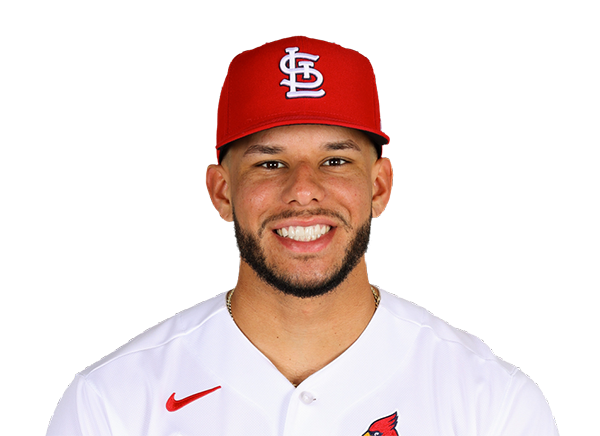
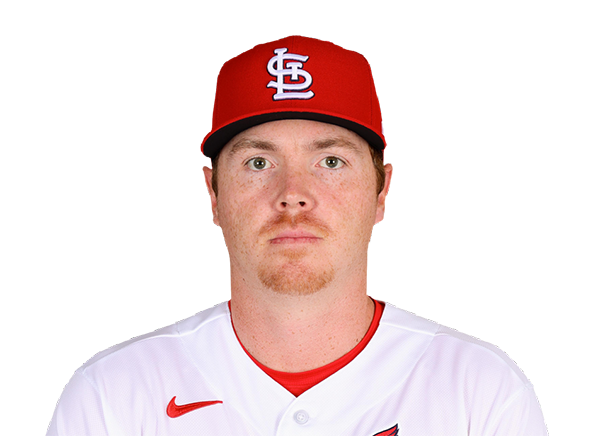

Team Stats
 WSH
STL


3
Runs
5
7
Hits
6
1
Errors
0
1
Home Runs
3
2
Walks
2
5
Strikeouts
8
Player Box Score
Washington Nationals
| Player | H-AB | AB | R | H | RBI | HR | BB | K | #P | AVG | OBP | SLG |
|---|---|---|---|---|---|---|---|---|---|---|---|---|
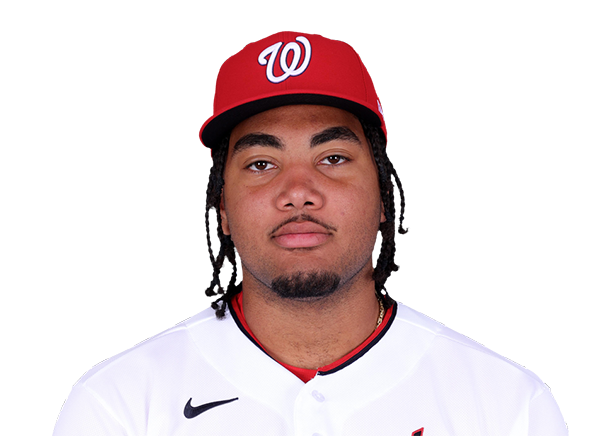 James Wood | 0-4 | 4 | 0 | 0 | 0 | 0 | 0 | 2 | 12 | .265 | .390 | .513 |
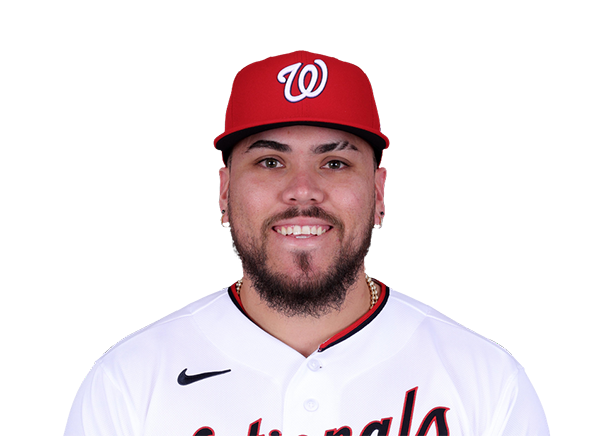 Andres Chaparro | 0-2 | 2 | 0 | 0 | 0 | 0 | 1 | 0 | 11 | .257 | .362 | .508 |
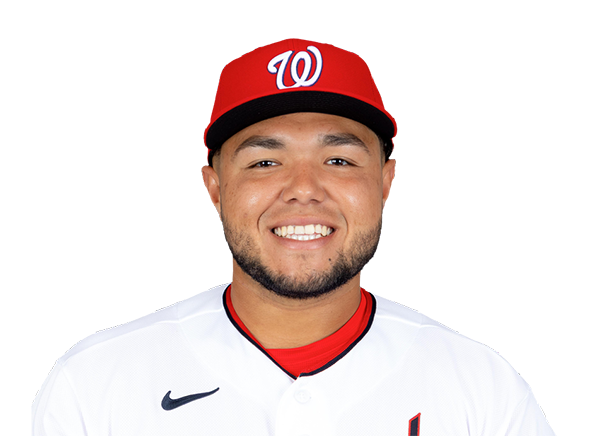 Abimelec Ortiz | 0-1 | 1 | 0 | 0 | 0 | 0 | 0 | 0 | 4 | .198 | .242 | .364 |
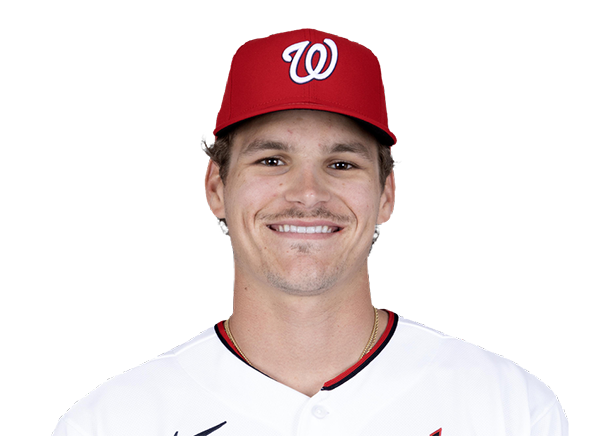 Brady House | 2-2 | 2 | 1 | 2 | 0 | 0 | 1 | 0 | 9 | .244 | .310 | .399 |
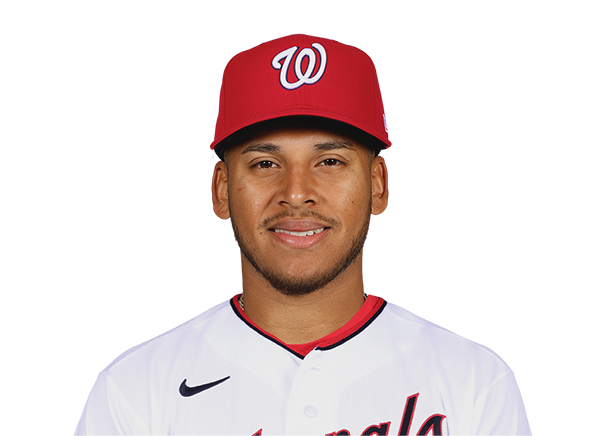 Jorbit Vivas | 0-1 | 1 | 0 | 0 | 0 | 0 | 0 | 1 | 3 | .247 | .340 | .334 |
 CJ Abrams | 1-4 | 4 | 1 | 1 | 2 | 1 | 0 | 1 | 21 | .261 | .336 | .492 |
 Dylan Crews | 0-4 | 4 | 0 | 0 | 0 | 0 | 0 | 0 | 10 | .222 | .286 | .371 |
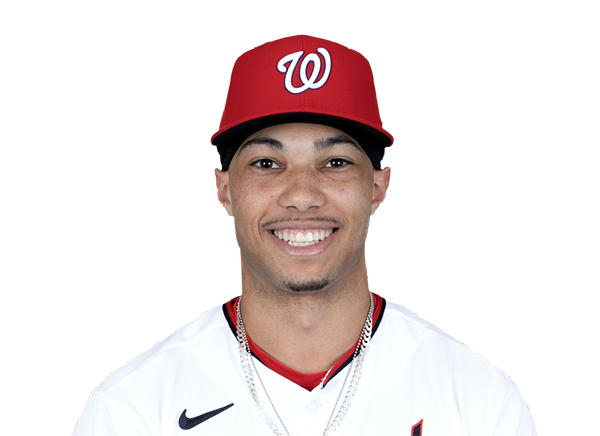 Daylen Lile | 2-4 | 4 | 1 | 2 | 0 | 0 | 0 | 0 | 10 | .251 | .303 | .440 |
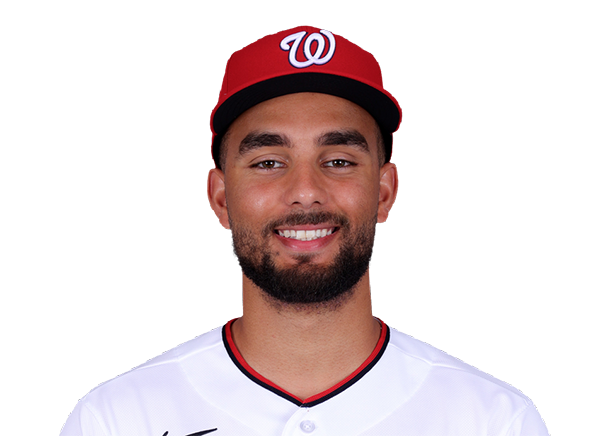 Harry Ford | 1-3 | 3 | 0 | 1 | 0 | 0 | 0 | 1 | 16 | .189 | .306 | .347 |
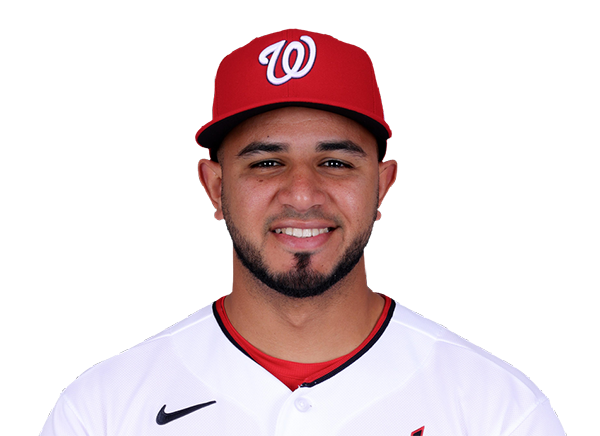 Keibert Ruiz | 0-1 | 1 | 0 | 0 | 0 | 0 | 0 | 0 | 1 | .285 | .323 | .455 |
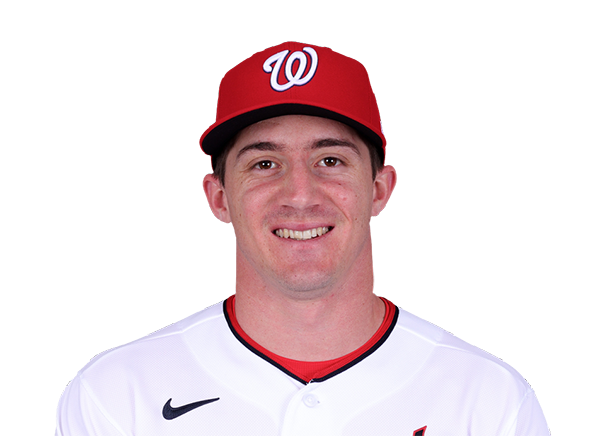 Jacob Young | 1-2 | 2 | 0 | 1 | 1 | 0 | 0 | 0 | 7 | .249 | .317 | .389 |
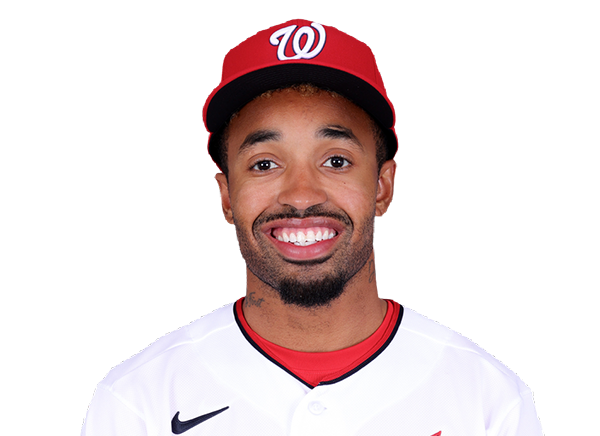 Nasim Nunez | 0-3 | 3 | 0 | 0 | 0 | 0 | 0 | 0 | 10 | .210 | .291 | .243 |
St. Louis Cardinals
| Player | H-AB | AB | R | H | RBI | HR | BB | K | #P | AVG | OBP | SLG |
|---|---|---|---|---|---|---|---|---|---|---|---|---|
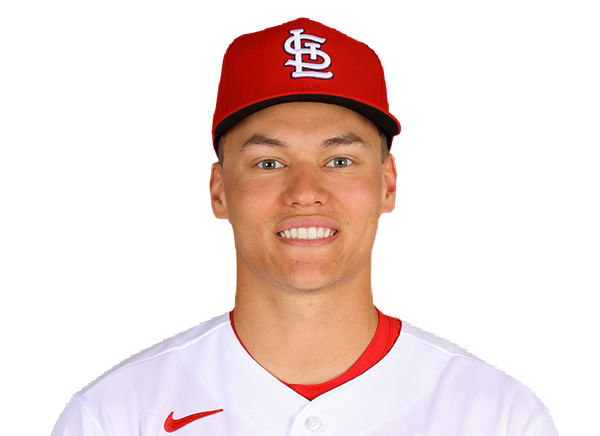 JJ Wetherholt | 1-4 | 4 | 0 | 1 | 1 | 0 | 0 | 0 | 23 | .242 | .341 | .368 |
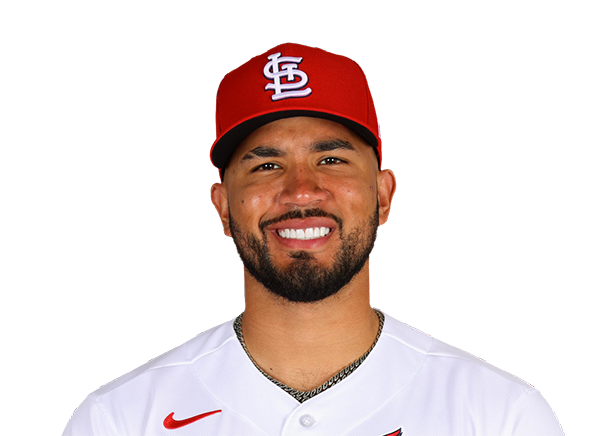 Ivan Herrera | 2-4 | 4 | 2 | 2 | 2 | 2 | 0 | 1 | 16 | .247 | .358 | .388 |
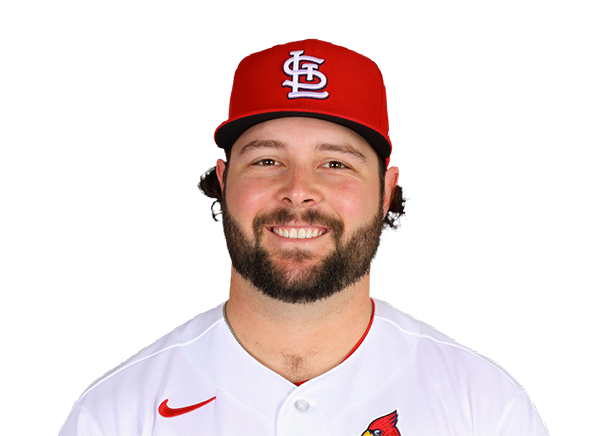 Alec Burleson | 0-4 | 4 | 0 | 0 | 0 | 0 | 0 | 1 | 17 | .282 | .347 | .466 |
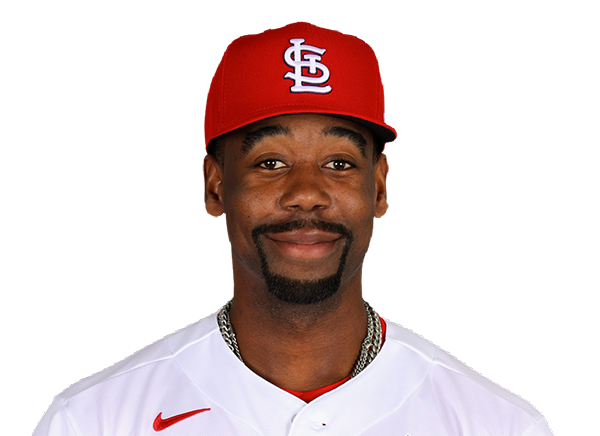 Jordan Walker | 0-3 | 3 | 1 | 0 | 0 | 0 | 1 | 1 | 17 | .274 | .332 | .474 |
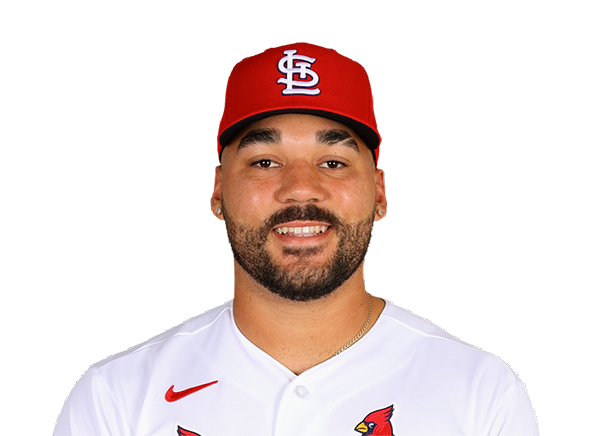 Leo Bernal | 1-3 | 3 | 1 | 1 | 2 | 1 | 1 | 1 | 23 | .311 | .354 | .514 |
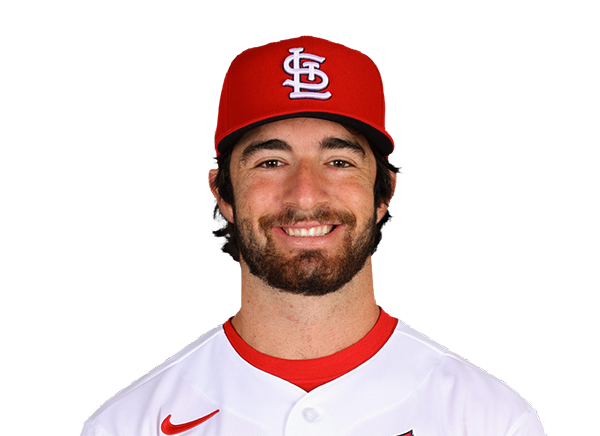 Thomas Saggese | 0-4 | 4 | 0 | 0 | 0 | 0 | 0 | 2 | 19 | .247 | .302 | .377 |
 Bryan Torres | 0-3 | 3 | 0 | 0 | 0 | 0 | 0 | 1 | 11 | .239 | .313 | .346 |
 Masyn Winn | 0-0 | 0 | 0 | 0 | 0 | 0 | 0 | 0 | 0 | .235 | .309 | .320 |
 Jose Fermin | 2-3 | 3 | 1 | 2 | 0 | 0 | 0 | 0 | 15 | .251 | .314 | .362 |
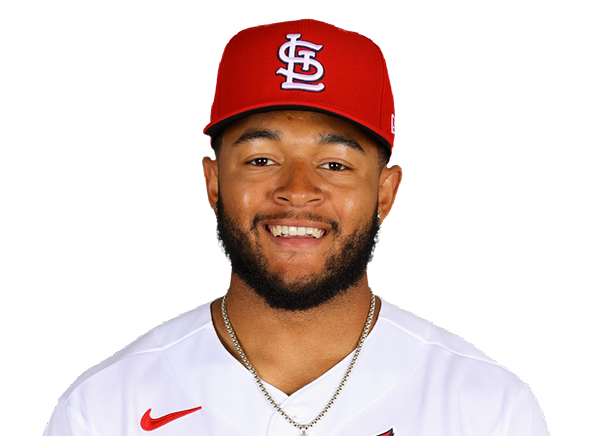 Victor Scott II | 0-0 | 0 | 0 | 0 | 0 | 0 | 0 | 0 | 0 | .190 | .269 | .252 |
 Nathan Church | 0-3 | 3 | 0 | 0 | 0 | 0 | 0 | 1 | 14 | .252 | .297 | .373 |
Washington Nationals
| Player | IP | H | R | ER | BB | K | HR | PC-ST | ERA | PC |
|---|---|---|---|---|---|---|---|---|---|---|
 Jake Irvin | 5.1 | 3 | 2 | 2 | 0 | 8 | 1 | 97-67 | 5.40 | 97 |
 Will Dion | 1.2 | 1 | 0 | 0 | 1 | 0 | 0 | 29-15 | 3.74 | 29 |
 Erik Tolman | 0.2 | 1 | 1 | 1 | 0 | 0 | 1 | 13-9 | 3.65 | 13 |
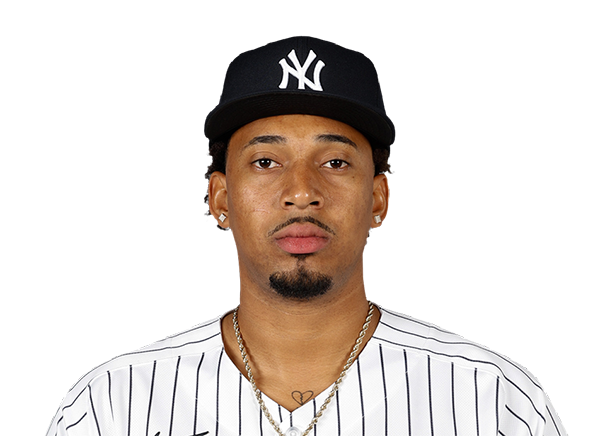 Yovanny Cruz | 0.1 | 1 | 2 | 2 | 1 | 0 | 1 | 16-10 | 5.27 | 16 |
St. Louis Cardinals
| Player | IP | H | R | ER | BB | K | HR | PC-ST | ERA | PC |
|---|---|---|---|---|---|---|---|---|---|---|
 Quinn Mathews | 7.0 | 7 | 3 | 3 | 2 | 3 | 1 | 96-59 | 3.65 | 96 |
 Luis Gastelum | 1.0 | 0 | 0 | 0 | 0 | 2 | 0 | 12-9 | 4.46 | 12 |
 Riley O'Brien | 1.0 | 0 | 0 | 0 | 0 | 0 | 0 | 6-6 | 4.08 | 6 |
H2H / Season Series
STL5–3
WSH
STL5–8
WSH
STL1–9
WSH
WSH1–6
STL
WSH6–7
STL
WSH9–6
STL
STL5–1
WSH
WSH1–0
STL
STL6–3
WSH
WSH3–1
STL
Last 5 Games
| Date | Opponent | Result |
|---|---|---|
| Sep 20 | @ STL | L3–5 |
| Sep 19 | @ STL | W8–5 |
| Sep 18 | @ STL | W9–1 |
| Sep 16 |  vs PHI | L0–3 |
| Sep 15 | vs PHI | W6–3 |
| Date | Opponent | Result |
|---|---|---|
| Sep 20 | vs WSH | W5–3 |
| Sep 19 | vs WSH | L5–8 |
| Sep 18 | vs WSH | L1–9 |
| Sep 16 |  vs SF | L5–6 |
| Sep 15 | vs SF | L3–10 |
Standings
American League
| Team | W | L | PCT | GB | DIFF | STRK |
|---|---|---|---|---|---|---|
1 Rays | 95 | 60 | .613 | - | +83 | W2 |
2 Guardians | 81 | 75 | .519 | 14.5 | +2 | W5 |
3 Rangers | 78 | 78 | .500 | 17.5 | -34 | L1 |
4 Yankees | 89 | 66 | .574 | 6 | +137 | L2 |
5 Red Sox | 84 | 72 | .538 | 11.5 | +80 | L2 |
6 White Sox | 80 | 76 | .513 | 15.5 | +42 | W2 |
7 Astros | 77 | 79 | .494 | 18.5 | -59 | L3 |
8 Blue Jays | 77 | 79 | .494 | 18.5 | -42 | W1 |
9 Orioles | 75 | 81 | .481 | 20.5 | -31 | L3 |
10 Mariners | 73 | 83 | .468 | 22.5 | -56 | W1 |
11 Twins | 73 | 83 | .468 | 22.5 | -64 | W1 |
12 Tigers | 73 | 83 | .468 | 22.5 | +68 | L2 |
13 Royals | 67 | 89 | .429 | 28.5 | -102 | L4 |
14 Athletics | 61 | 95 | .391 | 34.5 | -223 | L6 |
15 Angels | 60 | 96 | .385 | 35.5 | -87 | L1 |
National League
| Team | W | L | PCT | GB | DIFF | STRK |
|---|---|---|---|---|---|---|
1 Brewers | 98 | 58 | .628 | - | +202 | W3 |
2 Dodgers | 96 | 60 | .615 | 2 | +193 | W4 |
3 Braves | 92 | 64 | .590 | 6 | +120 | W3 |
4 Cubs | 87 | 69 | .558 | 11 | +152 | W2 |
5 Padres | 87 | 69 | .558 | 11 | +41 | W5 |
| 6Phillies | 86 | 70 | .551 | 12 | +29 | W1 |
7 Diamondbacks | 82 | 74 | .526 | 16 | -1 | W2 |
8 Pirates | 79 | 77 | .506 | 19 | +29 | W4 |
9 Marlins | 76 | 80 | .487 | 22 | -3 | L3 |
| 10Cardinals | 76 | 80 | .487 | 22 | -23 | W1 |
| 11Nationals | 73 | 83 | .468 | 25 | +12 | L1 |
12 Reds | 72 | 84 | .462 | 26 | -163 | L2 |
13 Mets | 71 | 85 | .455 | 27 | -41 | L1 |
| 14Giants | 64 | 92 | .410 | 34 | -84 | L3 |
15 Rockies | 57 | 99 | .365 | 41 | -177 | L1 |
WSH
VS
STL
Pitchers
Jake Irvin
Catchers
Harry Ford
Infielders
Andres Chaparro
Brady House
CJ Abrams
Nasim Nunez
Outfielders
Dylan Crews
Daylen Lile
Jacob Young
Designated Hitters
James Wood
Pitchers
Quinn Mathews
Catchers
Leo Bernal
Infielders
JJ Wetherholt
Alec Burleson
Thomas Saggese
Jose Fermin
Outfielders
Jordan Walker
Bryan Torres
Nathan Church
Designated Hitters
Ivan Herrera
Nationals
VS
Cardinals
Batting
156
Team Games Played
156
5318
At Bats
5272
1315
Hits
1277
756
Runs Batted In
681
203
Home Runs
161
171
Stolen Bases
97
.247
Batting Average
.242
798
Runs
704
276
Doubles
225
30
Triples
14
2260
Total Bases
2013
540
Walks
496
1300
Strikeouts
1234
.322
On Base Percentage
.315
.425
Slugging Percentage
.382
.747
OBP Pct + SLG Pct
.697
156
Games Played
156
156
Games Started
156
68
Hit By Pitch
93
0.0
Wins Above Replacement
0.0
0.0
Offensive Wins Above Replacement
0.0
39
Caught Stealing
25
1
Is Qualified
1
756.8
Runs Created
649.4
4.9
Runs Created Per 27 Outs
4.2
.090
Walks Per Plate Appearance
.084
0.42
Walk To Strikeout Ratio
0.40
.178
Isolated Power
.140
.304
Secondary Average
.247
3.82
Pitches Per Plate Appearance
3.86
509
Extra Base Hits
400
5986
Plate Appearances
5937
26.2
At Bats Per Home Run
32.7
19
Sacrifice Hit
19
37
Sacrifice Flies
55
Pitching
156
Team Games Played
156
36
Quality Starts
53
73
Wins
76
83
Losses
80
38
Saves
46
77
Holds
95
1339
Hits
1345
717
Earned runs
665
207
Home Runs
155
577
Walks
544
1227
Strikeouts
1235
8.0
Strikeouts Per 9 Innings
8.0
150.9
Pitches Per Start
150.2
1.38
Walks Plus Hits Per Inning Pitched
1.36
4.66
Earned Run Average
4.29
83
Losses
80
1384.0
Innings pitched
1393.2
.468
Win Percentage
.487
80
Save Opportunities
76
.253
Opponent Batting Average
.254
.332
Opponent's On-base pct.
.329
.421
Opponent's Slugging pct.
.399
.753
Opponent's OPB Pct + SLG Pct
.728
5297
At Bats
5298
245
Doubles
274
12
Triples
14
80
Batters Hit
74
114
Stolen Bases
115
156
Games Played
156
0
Complete Games
1
5
Shutouts
9
61
Wild Pitches
60
754
Runs Batted In
690
1
Balks
3
1384.0
Innings pitched
1393.2
8.0
Strikeouts Per 9 Innings
8.0
33
Caught Stealing
28
156
Games Started
156
0.0
Wins Above Replacement
0.0
1
Is Qualified
1
786
Runs
727
717
Earned Runs
665
2229
Total Bases
2112
Fielding
156
Team Games Played
156
1384
Full Innings
1394
5663
Total Chances
5716
4152
Putouts
4181
1408
Assists
1462
103
Errors
73
276
Double Plays
225
0.982
Fielding Percentage
0.987
36.2
Range Factor
36.4
0.0
Zone Rating
0.0
156
Games Played
156
0
Games Started
0
0.0
Defensive Wins Above Replacement
0.0
1
Qualified
1